
Nearing An Inflection Point
2024 BLACK FRIDAY SPECIAL-EXTENDED TO CYBER MONDAY! Due to popular demand, our temporary $300 discount on our annual Portfolio Manager-tier subscription has been extended through Monday (until Wednesday, actually). You can participate by entering code BLACKFRIDAY at checkout! We have 2 more open spots available for this limited time promotion.
We saw nice fulfillment of the possible “catch-up” scenario for QQQ we mentioned in yesterday’s newsletter, with the Nasdaq starting out strong and maintaining relative strength throughout the day. However, it looks like we skipped the pullback first, but no big deal on that point. QQQ appears poised to continue toward the 520+ target, though we’re rapidly approaching yet another potential inflection point as QQQ’s 520 magnet will bring it to the top of the daily Keltner channel, and SPX is already there. On top of the contrarian stretch indicators, the VIX is nearing the lower edge of a support line we can draw back to 2023, with VIX/VVIX divergences restarting again. We last noted the negative correlation between VIX and VVIX right before the last spilloff for markets in early November. We posted a YouTube video that discusses VIX and VVIX more in depth as well as SPY and SPX, so give it a look for some additional related commentary.

SPX didn’t participate as much in the upside move today, but we did get a good gamma (GEX) signal early in the morning that we shared in Discord for free when SPX was in the mid-6030s pointing to 6055 as a solid upside target. We topped out within a point and a half of that indication and boringly moved sideways the rest of the day. Hey, if it’s not going to be an exciting day, I can still thank GEX for helping me to set my expectations properly on many days.
Nonetheless, SPX is up against the top Keltner channel, which doesn’t bode well for massive, sustainable upside in the immediate future. As you can see just over the last several months, while we’re in a solid uptrend, touches of the top line sometimes continue along the top for a few days, but in this specific time period, price always drops back down to some degree eventually, even if only for a short time.

SPX GEX remains solidly positive, though it has slightly dropped from recent highs. We consider anything over 1B to be in firm positive territory.
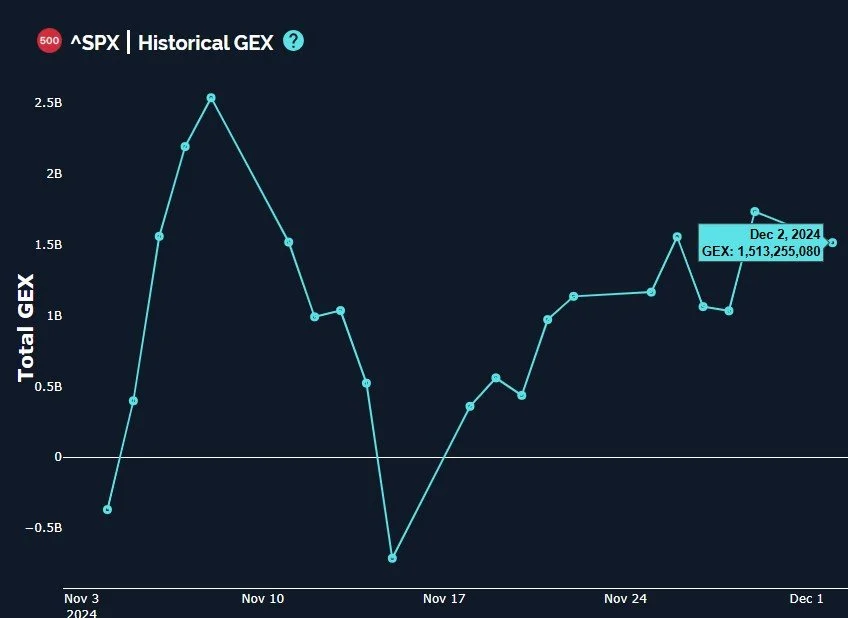
SPX Historical GEX: www.geeksoffinance.com
SPX has finally touched the 6050+ G1 Dealer Cluster zone we’ve been advertising for some time as a likely GEX target. That said, we note the bullish increase in GEX above 6050, with 6100 now being very prominent, and 6200 is getting hard to ignore as well. Does this mean we go straight up to all of those targets? Not necessarily.
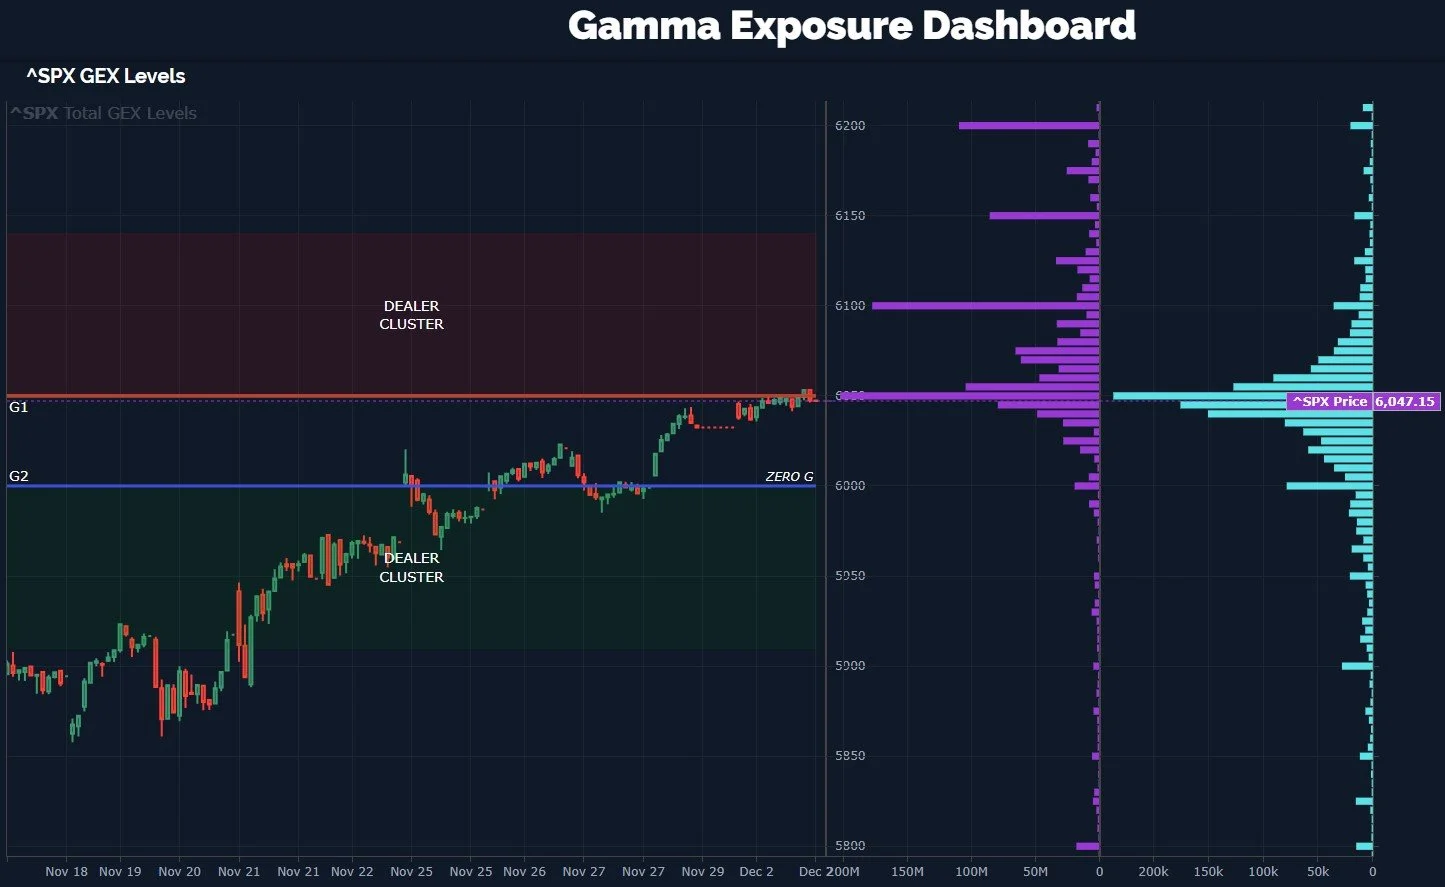
SPX GEX Levels: www.geeksoffinance.com
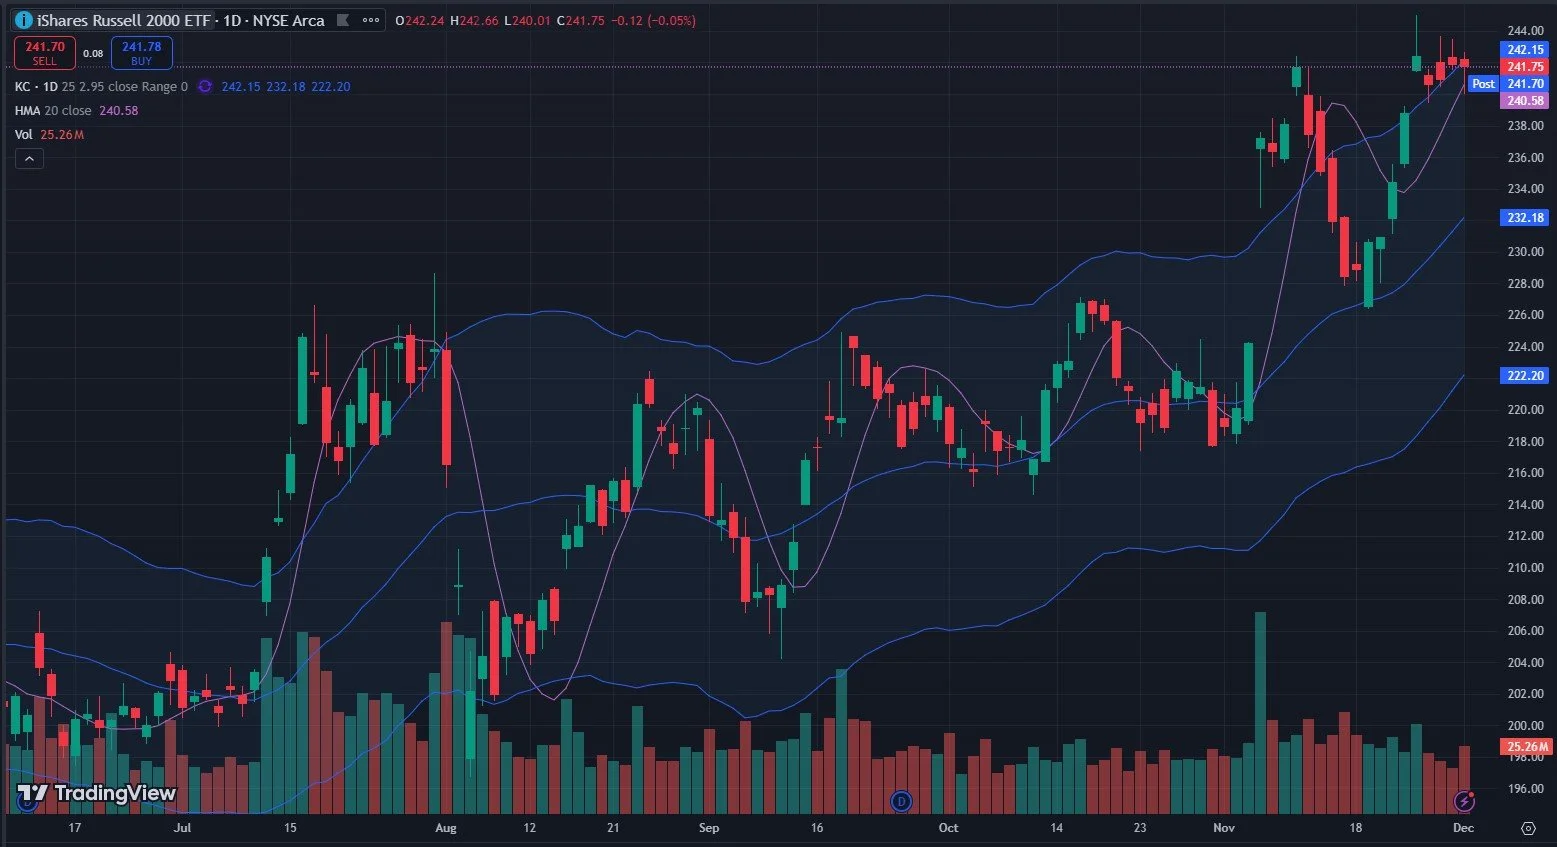
IWM looks quite bullish as well, with the Keltners on a mission to paint higher targets for the top line. That said, we have some gaps below, and IWM has been consolidating since breaching the upper Keltner, actually dropping back within the top boundary and retesting the Hull Moving Average intraday. Strictly based on the chart, I wouldn’t want to initiate a new long personally unless we could retest 230-232. Now let’s look at GEX.
IWM has a very noticeable G1 cluster overhead at 250, roughly 4% away. Not bad! If we can make it there…When I see my Keltners saying “not so fast,” but GEX is saying “higher (no timeframe specified),” I generally take the cue from the Keltners and assume we need more time to allow the chart to create a pathway to those higher GEX targets. This doesn’t always hold true, especially if we see a violent short squeeze like TSLA in the past, or NVDA when they sneezed the letters “A” and “I” anytime from 2023 through the first half of this year, but rapid moonshots are fairly rare.
Also, notice the light blue line I circled at 230, that’s today’s option volume. While very speculative, I could see IWM heading lower while the Keltners play catch-up, then perhaps a final year-end move toward 250. IWM can be tricky, but the big picture still looks bullish.

IWM GEX Levels: www.geeksoffinance.com
The Satoshi Special (BTC) has the most bullish Keltner channels of anything we’ve looked at tonight, with a straight line being painted to 100k+. Price has been consolidating in what appears to be a bull flag. I will say that being below the Hull is bearish in my view, but it’s hard to ignore the trajectory of the Keltners, which (combined with GEX) cause me to lean more bullish than I otherwise would.

As I was saying, look at BTC’s GEX picture below, we have a big GEX cluster at 100k and we have yet to touch it. As long as BTC holds the 92k-93k area, I assign higher odds to touching 100k before a deeper possible move down.

BTC GEX Levels: www.geeksoffinance.com
Despite not seeing any pullback to speak of this morning, a more rapid tagging of the upper targets for SPX (1% away) and QQQ (also about 1% away at this point) could potentially mean a pullback in December. The odds favor higher, but the magnitude of gains from this point are likely not great, at least not without an ensuing pullback. Let’s see if we can get some sort of reset to then build a base for a final push higher toward 6200 into 12/31. Seems crazy…And it is crazy. But here we are!
Join us in Discord for our discussions around what’s happening as the day progresses. We’ll be active and posting some updates and we’d love to see you there!
If you’re interested in accessing our tools and analytics or taking advantage of our promotion (see the top of this newsletter), be sure to check out our website.
If you’re interested in learning more about our strategy and approach, we address all of these topics in our Geek University course which is included in all memberships.
We recently posted a YouTube video, and we have many other short videos, so give our channel a look if you’re curious about recent market commentary and ideas as well as gamma (GEX) concepts explained.
Thanks for being part of our community and know that we invite your feedback!
The information provided by Geeks of Finance LLC is for educational purposes only and is not intended to be, nor should be construed as, an offer, recommendation or solicitation to buy or sell any security or instrument or to participate in any transaction or activity. Please view our Investment Adviser Disclaimer and Risk Disclosure.