
Market On A Mission
2024 BLACK FRIDAY SPECIAL-EXTENDED TO CYBER MONDAY! Due to popular demand, our temporary $300 discount on our annual Portfolio Manager-tier subscription has been extended through Monday (until Wednesday, actually). You can participate by entering code BLACKFRIDAY at checkout! We have 1 more open spots available for this limited time promotion.
The VIX started out showing signs of life this morning, opening above the Hull Moving Average and at one point rallying close to 14. But then buyers awakened, stopping the market decline and creating another boring day for December. We posted a YouTube video where we discuss the broader market as well as similarities in the gamma (GEX) structure for the VIX this month compared to November, a timeframe in which we were able to identify in advance the VIX’s behavior due to a combination of GEX and charts.
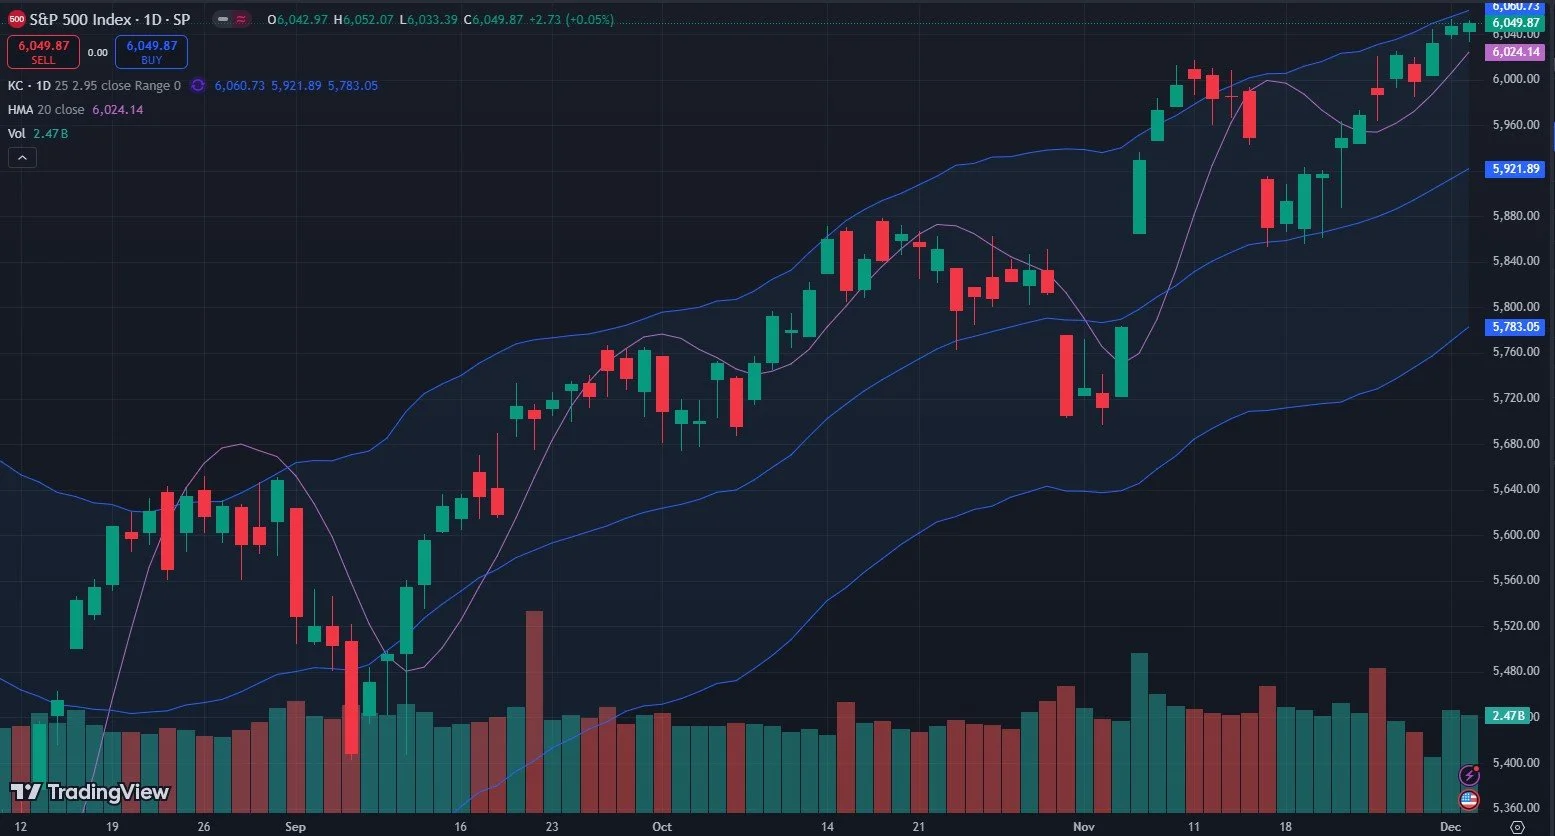
Looking at the chart above, we can see SPX continuing above the Hull, which is bullish. We also see the upper Keltner continuing to increase, now at 6060, though even 6060 implies limited upside from this point. What does GEX say?
We’ll take a closer look, but a cursory glance at the levels shows that GEX levels continue moving up, with 6100 currently the largest positive cluster. We even see growing GEX at 6200. Seems crazy, right?

SPX Levels: www,geekoffinance.com
One interesting negative factor is the decline in positive GEX while we see price hitting new highs. I would not be comfortable calling any top, and 1.36B is still solidly positive, so it’s too early to make any contrarian prediction based on this data point, but the lack of GEX pushing more positive is noteworthy.
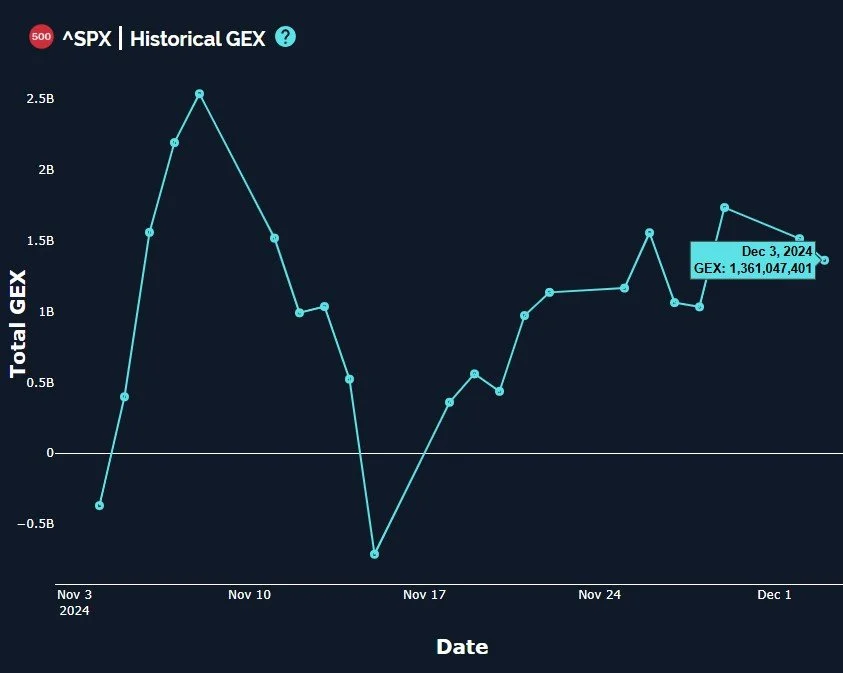
SPX Historical GEX: www.geeksoffinance.com
Let’s dig a little deeper into SPX’s 3D graph found on our website: While 6100 is the largest GEX cluster for Friday, the biggest GEX cluster on the map other than the 0 DTE options that have already expired is at 6050 for December 31. The highlighted clusters at 6150 and 6200 are actually concentrated on December 20. If this structure holds, we could end up seeing a market top by the 20th and then a drop into the 31st, though we’re going to have to reserve any actual conclusions until we see more data. The Keltners at 6060 not quite matching the GEX target of 6100 implies we might need more time (Friday?) to allow the Keltners to reach that 6100.
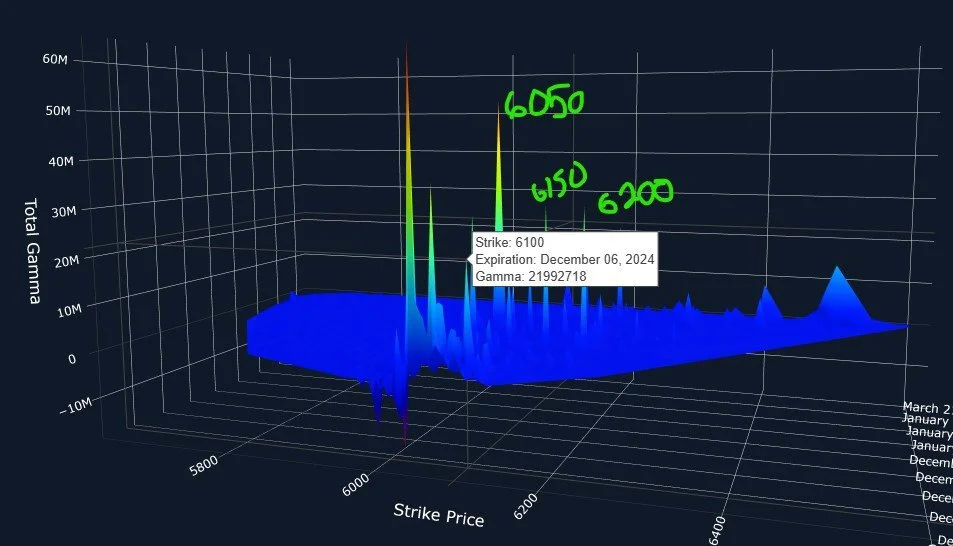
SPX 3D Graph: www.geeksoffinance.com
Lastly, let’s look at USO, which aims to mirror oil prices. For the first time in 5 days, we had a nice green candle that closed above the Hull, bringing attention to the next resistance area, the upper Keltner at 76.71.

We saw a corresponding increase in positive USO GEX , which gives more clues toward the bullish picture.
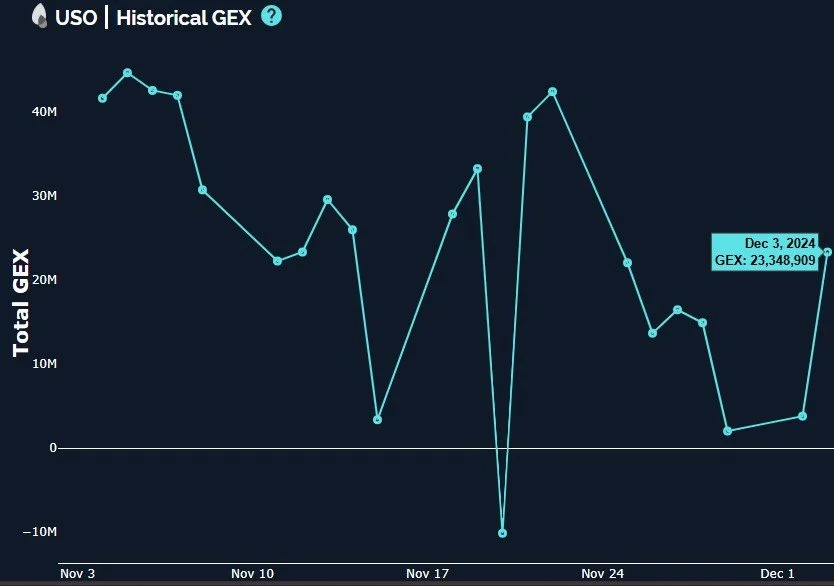
USO Historical GEX: www.geeksoffinance.com
We don’t see a lot of GEX clusters visible on USO, but of those we see, 79 on December 20 is the most prominent. Maybe this long-running sideways consolidation is about to end?
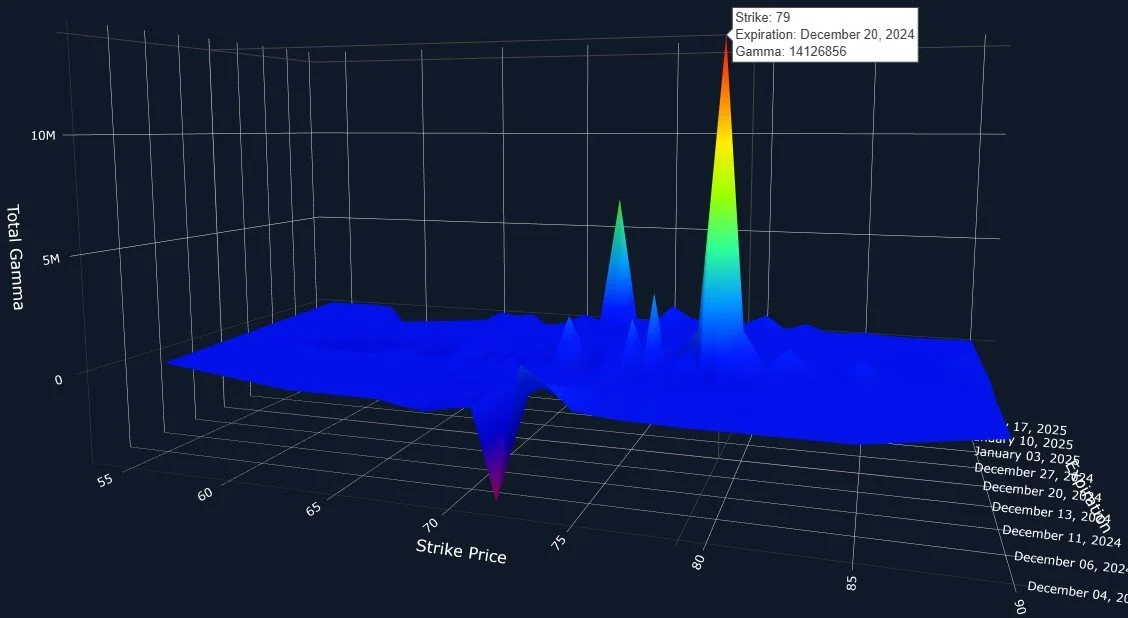
USO Historical GEX: www.geeksoffinance.com
With ADP, PMI, ISM, and Powell tomorrow, we’ll have plenty of reasons for market volatility, if the market so chooses. Let’s see where GEX is indicating that we’ll go once we’re 15-35 minutes from the open. WE hope you’ll join us in the morning, we have the link below!

Econoday.com
Join us in Discord for our discussions around what’s happening as the day progresses. We’ll be active and posting some updates and we’d love to see you there!
If you’re interested in accessing our tools and analytics or taking advantage of our promotion (see the top of this newsletter), be sure to check out our website.
If you’re interested in learning more about our strategy and approach, we address all of these topics in our Geek University course which is included in all memberships.
We recently posted a YouTube video, and we have many other short videos, so give our channel a look if you’re curious about recent market commentary and ideas as well as gamma (GEX) concepts explained.
Thanks for being part of our community and know that we invite your feedback!
The information provided by Geeks of Finance LLC is for educational purposes only and is not intended to be, nor should be construed as, an offer, recommendation or solicitation to buy or sell any security or instrument or to participate in any transaction or activity. Please view our Investment Adviser Disclaimer and Risk Disclosure.