
Too Bearish, Too Soon?
2024 BLACK FRIDAY SPECIAL-EXTENDED TO CYBER MONDAY! Due to popular demand, our temporary $300 discount on our annual Portfolio Manager-tier subscription has been extended through Monday (until Wednesday, actually). You can participate by entering code BLACKFRIDAY at checkout! We added 3 new spots available for this limited time promotion.
We posted a YouTube video that covers SPY, IWM, and a few other tickers that we think you’ll find of interest, so check it out. In today’s newsletter, we’ll dig into the primary scenario we mention on YouTube, with a little added flavor that is speculative and strictly reflective of what I’m personally watching as we enter this week. One thing we mentioned in the video was the AAII survey, a popular sentiment survey that can serve as a fairly good contrarian indicator at the extremes. We’re at the lowest level of bullishness in quite a few weeks, with seemingly all of that decrease in bullishness showing up in the bearish camp as opposed to neutral. Interestingly, while tech hasn’t yet made a higher high than Monday, November 25, the S&P did go on to make a new high while we see these bearish readings. In a potentially sad moment for bears, people feeling bearish does not historically translate to large immediate drops in the market, not that this time has to be the same as previous occasions.

Source: AAII survey
SPX has been the strongest between QQQ and SPX, but the chart also shows a fairly small amount of additional space to reach the upper Keltner channel, with the upper channel at 6049 on my chart. We can easily overshoot, but with history as our guide, it would be unusual to see a rally above that line sustain itself without some sort of consolidation for a period of time, either sideways or down. We won’t get into the VIX too much in today’s newsletter, but I also see the 2-hour and 4-hour VIX charts showing signs of a potential Keltner bottom, with 13 to 13.28 being potential spots for the VIX to rebound. That said, and fitting in with the overall bullish view, I don’t see evidence that the VIX will make it higher than 15-16 before ultimately dropping to as low as 12! I tend to lean bearish, so I’m amazed that the charts and GEX data are as bullish as they are, and I can’t ignore the data.

SPX shows positive gamma (GEX) and also very noticeable targets at 6100 and even 6200. SPX has been a good example of GEX shifting higher in a bullish environment, which we’ve seen in real-time over the last two weeks. In the immediate short term, I’ll note that 6050-6055 seem to be the largest single GEX clusters on specific dates (December 20 and 31 especially), whereas 6100 GEX consists of smaller clusters spread across more numerous expirations. Our subscribers can see this on our 3D chart. My tendency regarding such data? As we approach any given expiration, I give more weight to the larger GEX clusters, so while 6100 may be a large GEX spot overall, if 6050 is the largest cluster on a single date, I will give the edge toward that larger cluster by that date.

SPX GEX Levels: www.geeksoffinance.com
SPY and SPX don’t always necessarily agree with each other as far as the GEX picture is concerned, but this is one time where I notice they’re on almost the exact same page, with SPY reflecting a slightly higher G1 Dealer Cluster zone with the zone starting at 605 and stretching to 615. To summarize SPY and SPX, the chart looks bullish, but we’re a little stretched short term. The Keltners keep rising, but it might be just slightly premature to reach 6100 immediately, we might need a little more time…Maybe we can get a mini-spike on the VIX and retest the Hull Moving Average on SPX at 5986, then back up?

SPY GEX Levels: www.geeksoffinance.com
I doubt QQQ would be immune from SPX pulling back a little, though it has happened before..QQQ retesting the same Hull would mean around a 1% drop to the 505 area, but if tech can hold that zone (502-503 last stand for the bulls, in my opinion), QQQ is actually set up for a “catchup” move that would see bigger gains than the SPX, at least if the Keltners continue to mean anything. 520 QQQ is the current top of the channel, and the sideways consolidation in QQQ hasn’t stopped the channel from continuing to widen the gap between the current price and the top of the channel.

QQQ GEX seems to agree. We do see a large GEX cluster at 510, but the zone extends all the way to the same 520 we see on the Keltners, which makes it seems more likely, in my opinion. QQQ needs to get through 510 and hold the gain in order to open that door to the extended upside targets.
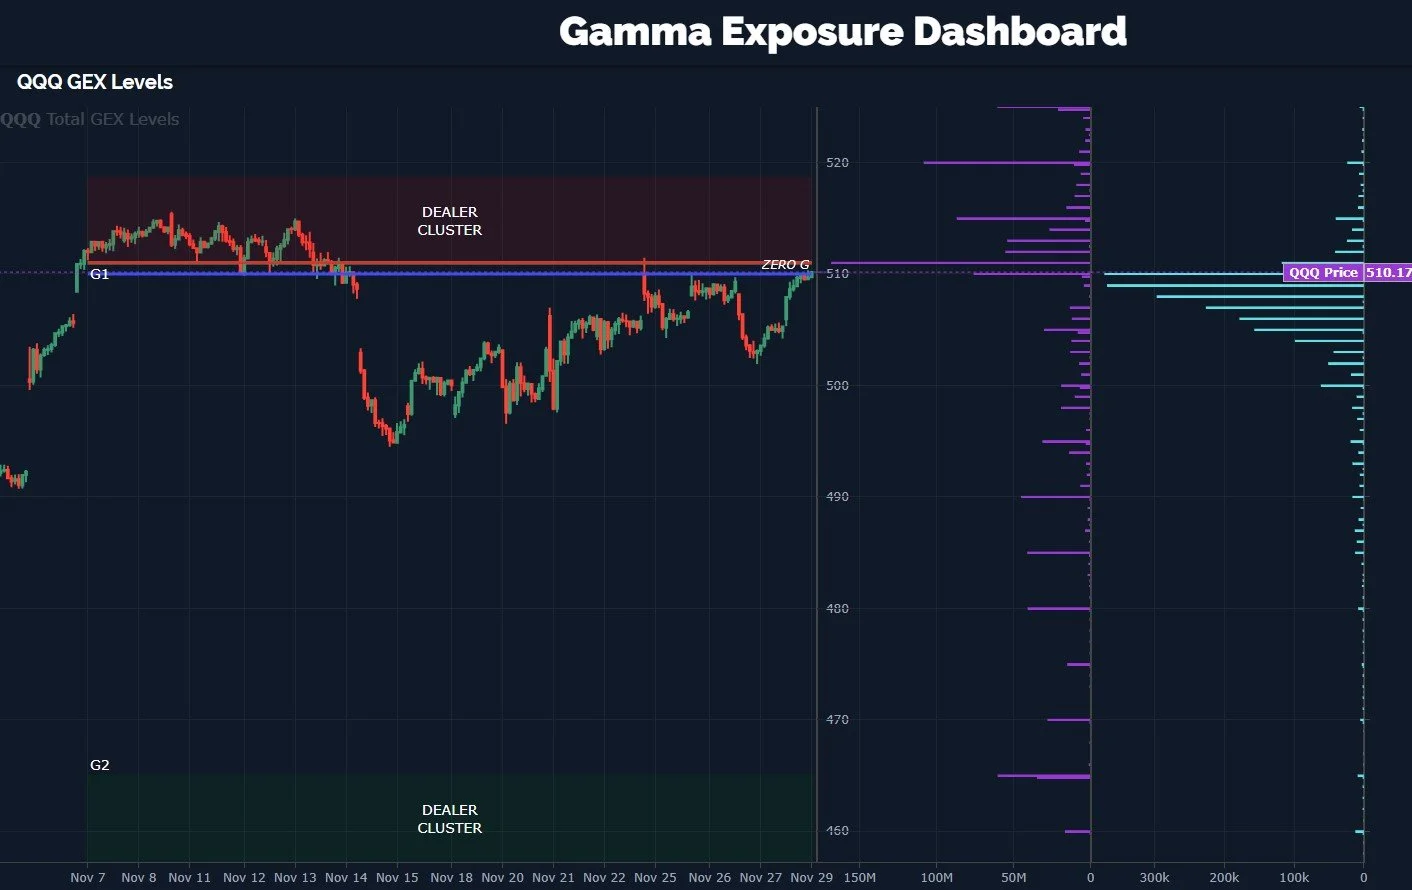
QQQ GEX Levels: www.geeksoffinance.com
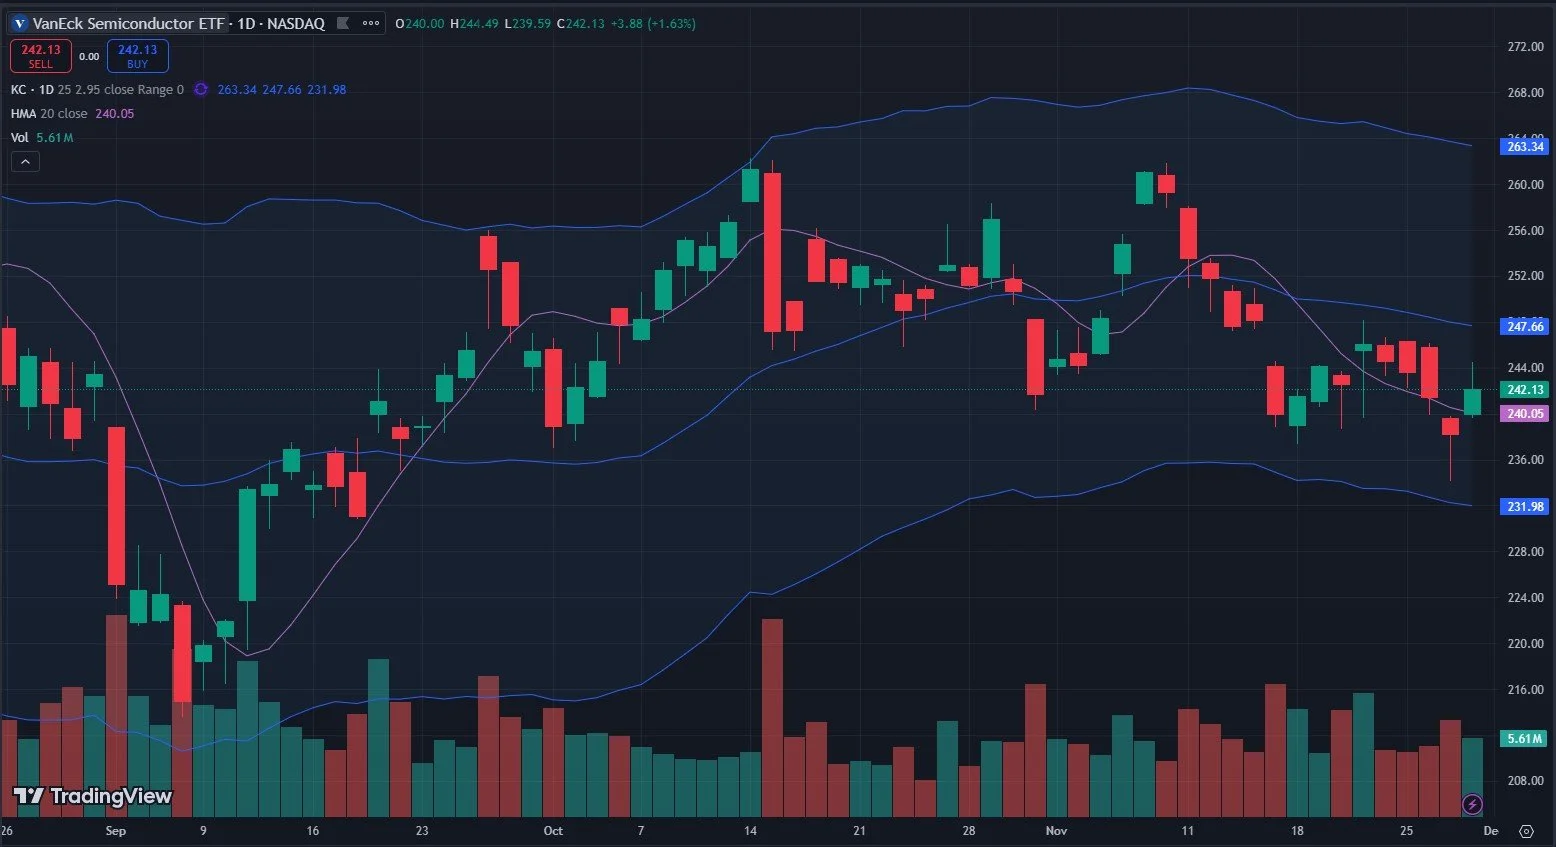
We also have an interesting setup with SMH, which regained the Hull after a brief “bad hair day (for a day)” on Thursday. The Keltners definitely seem to be neutral at best, but we are closer to the bottom of the channel, and getting through 248 opens the door to 260+. SMH going up will positively impact QQQ. In the “small pullback followed by rally” scenario, I’d like to see 1)relative strength from SMH and 2) SMH holding or regaining 240 fairly quickly to the upside. But what does its arguably most important representative NVDA have to say?
NVDA’s chart looks stronger than SMH, but ironically (or annoyingly for those looking for a crystal-clear signal), NVDA couldn’t close above the Hull Friday. What a party pooper.
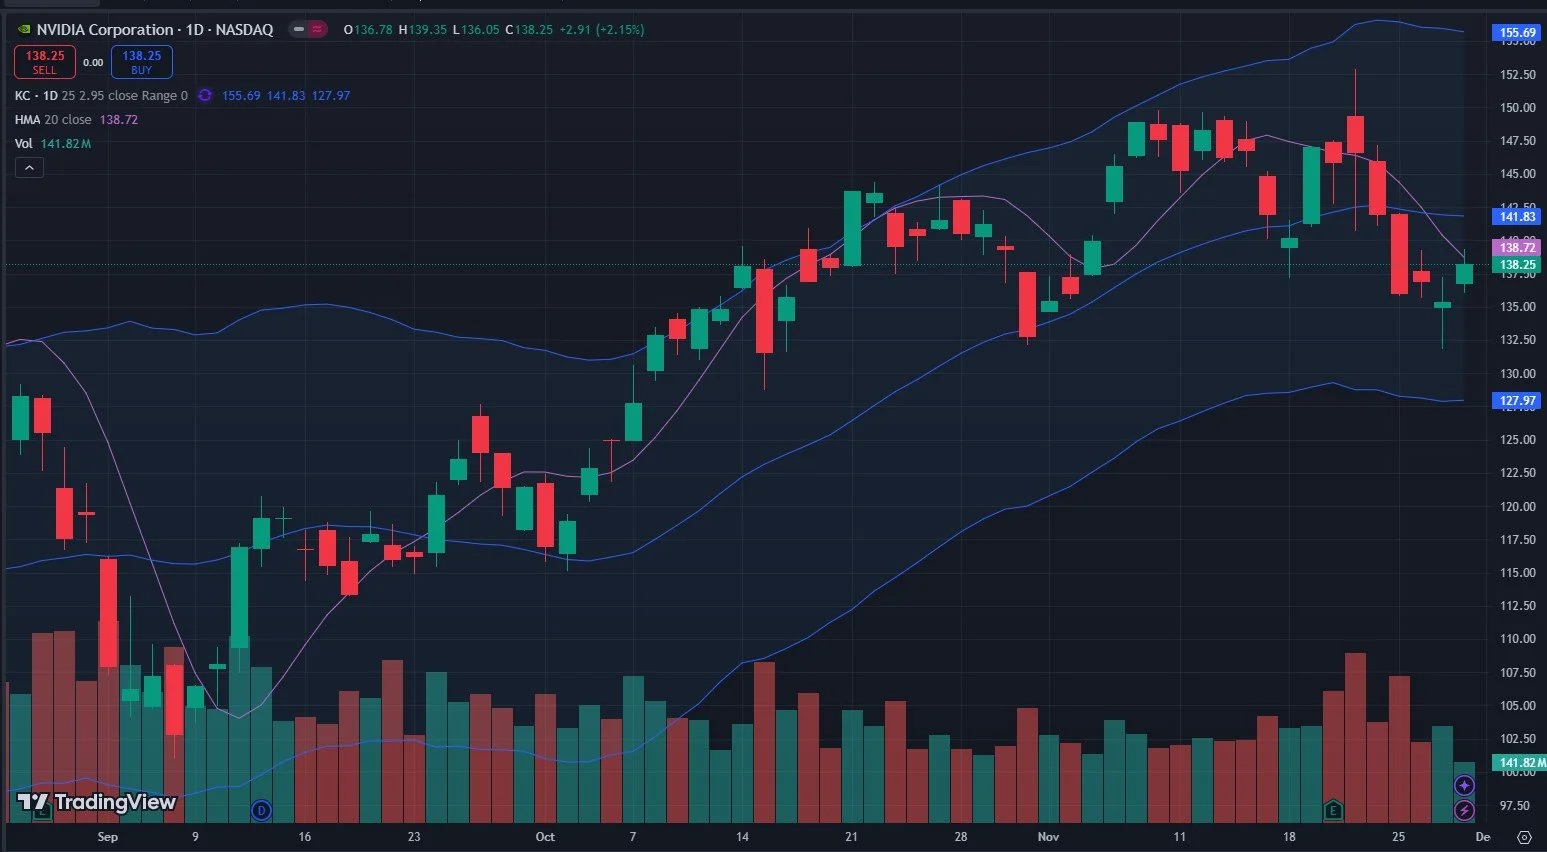
But wait, there’s light at the end of the toilet, I mean, tunnel: NVDA is showing a positive divergence with GEX, which has been increasing overall since November 15, and especially Friday. If we flip back to the chart pattern, we also see a reversal candle followed by a gap up that mostly held its intraday gains. Neither of those two factors are bearish at all.
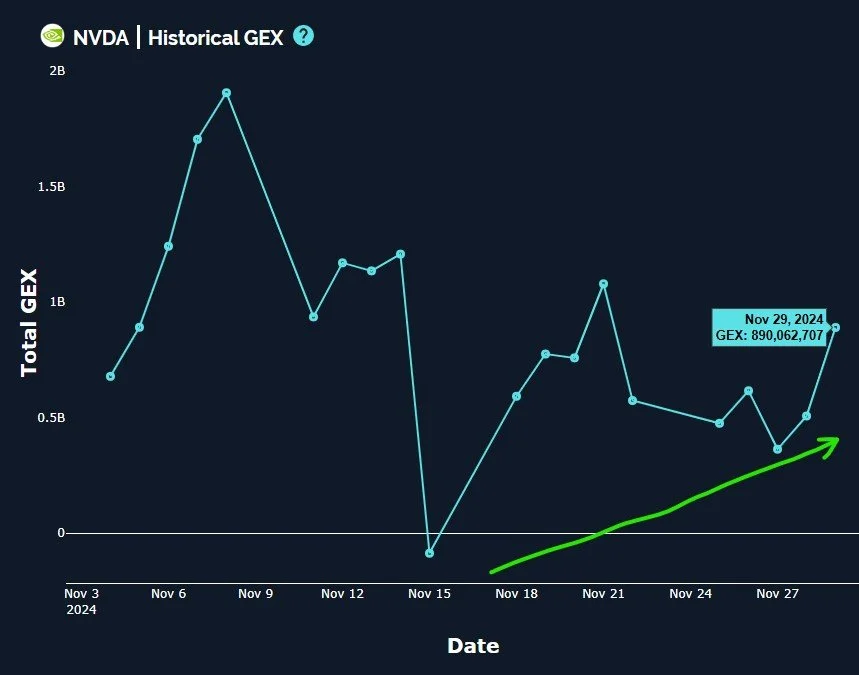
NVDA Historical GEX: www.geeksoffinance.com
And then the bears have the problem of the GEX picture: positive overall since November 15, and a big GEX cluster still remaining at 150. I actually would have expected the breach of 150 and spike downward to possibly mark the end of the 150 GEX cluster, but no, it’s still there like a 1980s high dive before insurance rates caused them to all be taken down (I miss those days at the summer pool). We see very little GEX below. Participants are telling us they don’t have much of an incentive to drive NVDA lower from here, at least according to GEX.

NVDA GEX Levels: www.geeksoffinance.com
All things considered, maybe the crowd is feeling too bearish without much of a drop (if any) to speak of. This contrarian signal combined with bullish GEX points to higher prices into year-end. We may see brief downside, but any spike in the VIX is likely to be met with a hammer, possibly crushing volatility back to a VIX 12 level. We’ll need to revisit where everything stands at that point, but for now, look out for the possibility of QQQ taking the lead to the upside and higher targets to be in focus.
Join us in Discord Friday for our discussions around what’s happening as the day progresses. We’ll be active and posting some updates and we’d love to see you there!
If you’re interested in accessing our tools and analytics or taking advantage of our promotion (see the top of this newsletter), be sure to check out our website.
If you’re interested in learning more about our strategy and approach, we address all of these topics in our Geek University course which is included in all memberships.
We recently posted a YouTube video, and we have many other short videos, so give our channel a look if you’re curious about recent market commentary and ideas as well as gamma (GEX) concepts explained.
Thanks for being part of our community and know that we invite your feedback!
The information provided by Geeks of Finance LLC is for educational purposes only and is not intended to be, nor should be construed as, an offer, recommendation or solicitation to buy or sell any security or instrument or to participate in any transaction or activity. Please view our Investment Adviser Disclaimer and Risk Disclosure.