
Breakdown
Over the last few days, we have been pointing out various divergences that were concerning yet inconclusive regarding the timing of a potential market decline, but today gave some definition to that with the sharp decline experienced by bulls. These divergences centered around the following:
VIX positive alongside market, VIX and VVIX negative correlation (on some days)
VIX daily option volume elevated at 30-40 strikes
DIA, IWM, SPX appearing weak, and even SMH, while QQQ at all-time highs
SPX GEX dropping to the lowest point in over a month, despite 1-day rebounds to marginally bullish readings
We said VIX expiration and FOMC could serve as potential catalysts. Tonight’s YouTube video looks SPX, SPY, BTC, and much more , so give it a brief minute.
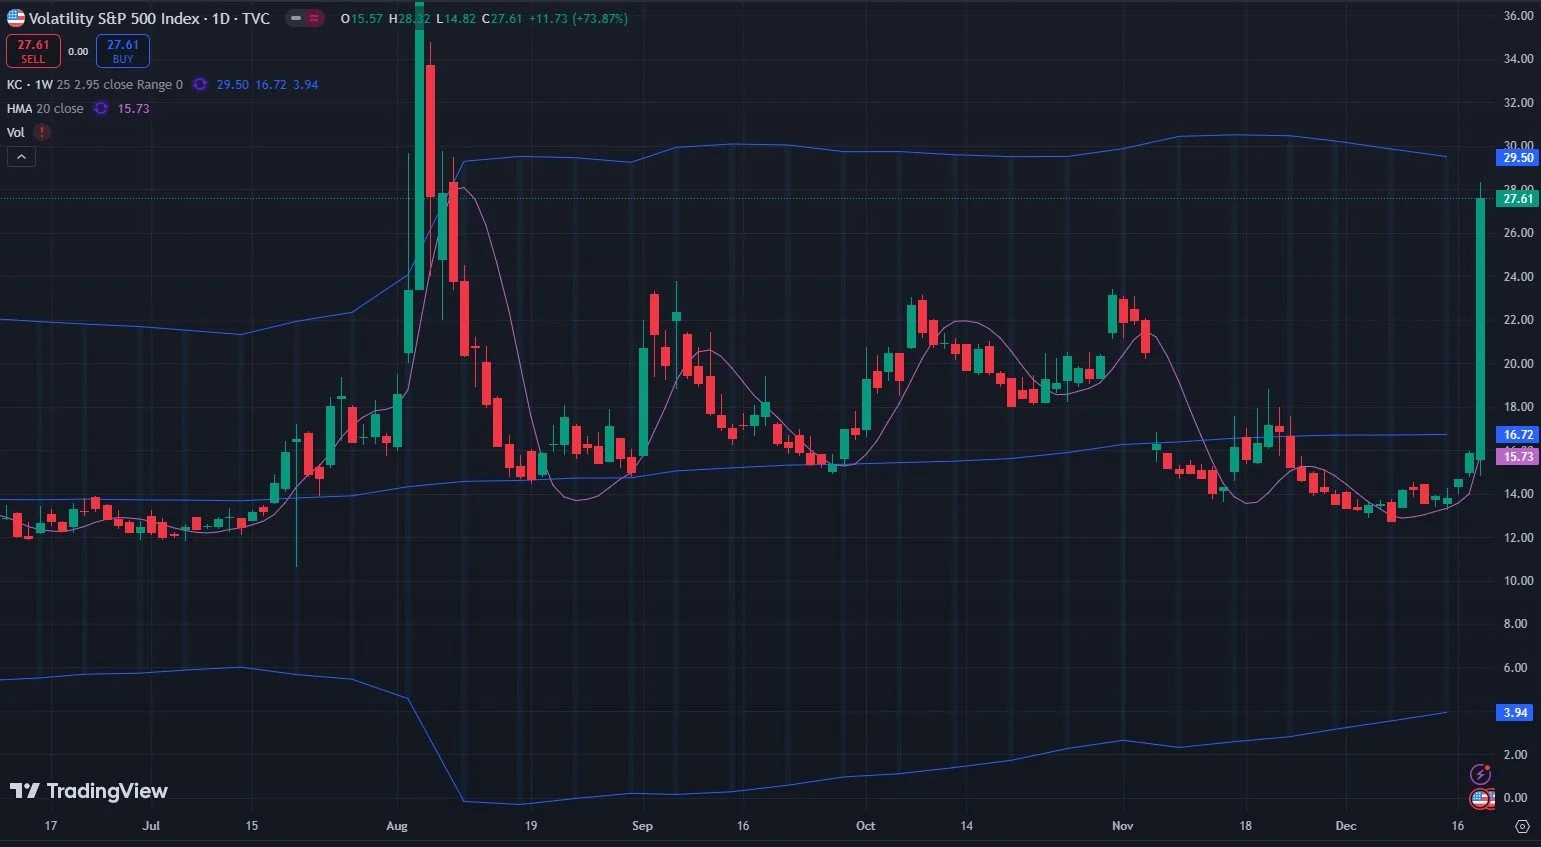
The VIX option volume noted earlier this week at higher strikes (30 and 40) makes sense now that we see a spike to over 27 so far. We’re way beyond the upper dealer cluster zone, as shown below:

Can we see any indicators that would point to where this VIX spike might stop? Volatility spikes (as indicated by the VIX) are notorious for becoming unhinged during market drops, and we have to keep this context in mind when we’re trying to figure out how to squeeze a wild animal into a tiny box (please don’t make my analogy a reality, for the love of animals). But I can say that the next hypothetical resistance point I can find for the VIX is right around that 30 area where we saw elevated volume, specifically 29.50, the upper Keltner channel using weekly Keltner settings. FOMC moves have sometimes created a whipsaw environment, so I consider the next 24-48 hours unpredictable and in need of more evidence, but if the VIX continues higher, I will be watching to see what happens at 29.50.
SPX, which we constantly harped on as struggling to get past the Hull moving average (the pink line currently showing 6051.61), broke down and has almost reached the lower Keltner channel already, making SPX unchanged since effectively mid-October.
We did see some conflicting signals on SPX, including a total GEX level that refused to go negative, yet we also highlighted how low GEX was relative to any point in the last month. The upper Keltner is still pointing higher while the lower channel is pointing lower, potentially signaling early signs of a higher volatility regime for SPX. We don’t point these things out in order to brag, but rather to give examples of why it’s NOT easy to always see a 100% clear picture of what comes next. All we can do is use the data to which we have access and improve our odds.
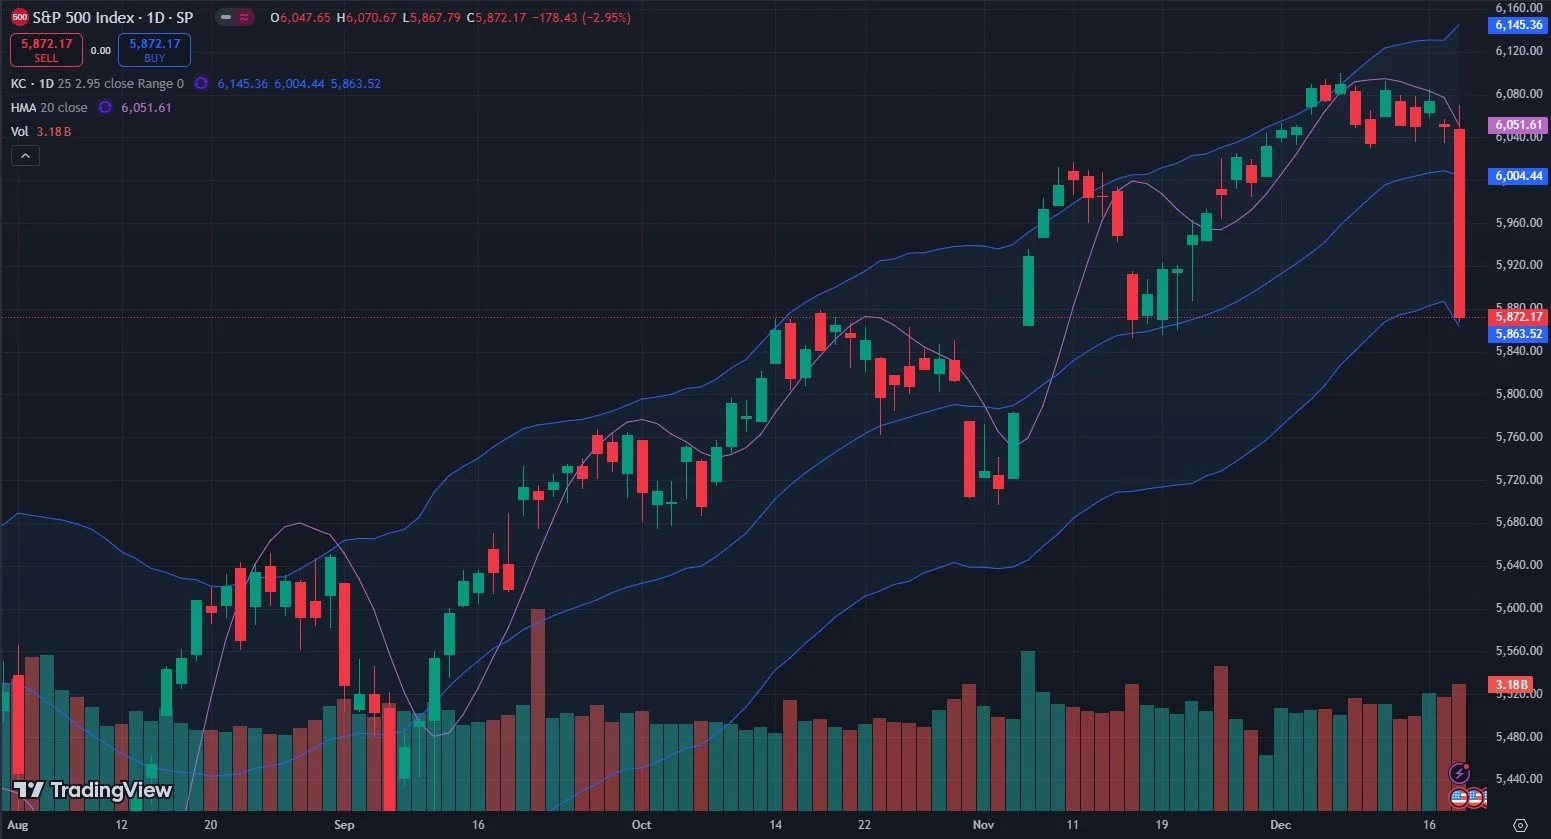
The lower Keltner channel on SPX is matching up nicely with the green Dealer Cluster Zone (5850-60 area), and we see big GEX at 5875. Volume today was still at 6100, and we have noteworthy GEX clusters still remaining between 6100 and 6200, though total GEX flipped negative. We had volume at 5000 today as well.
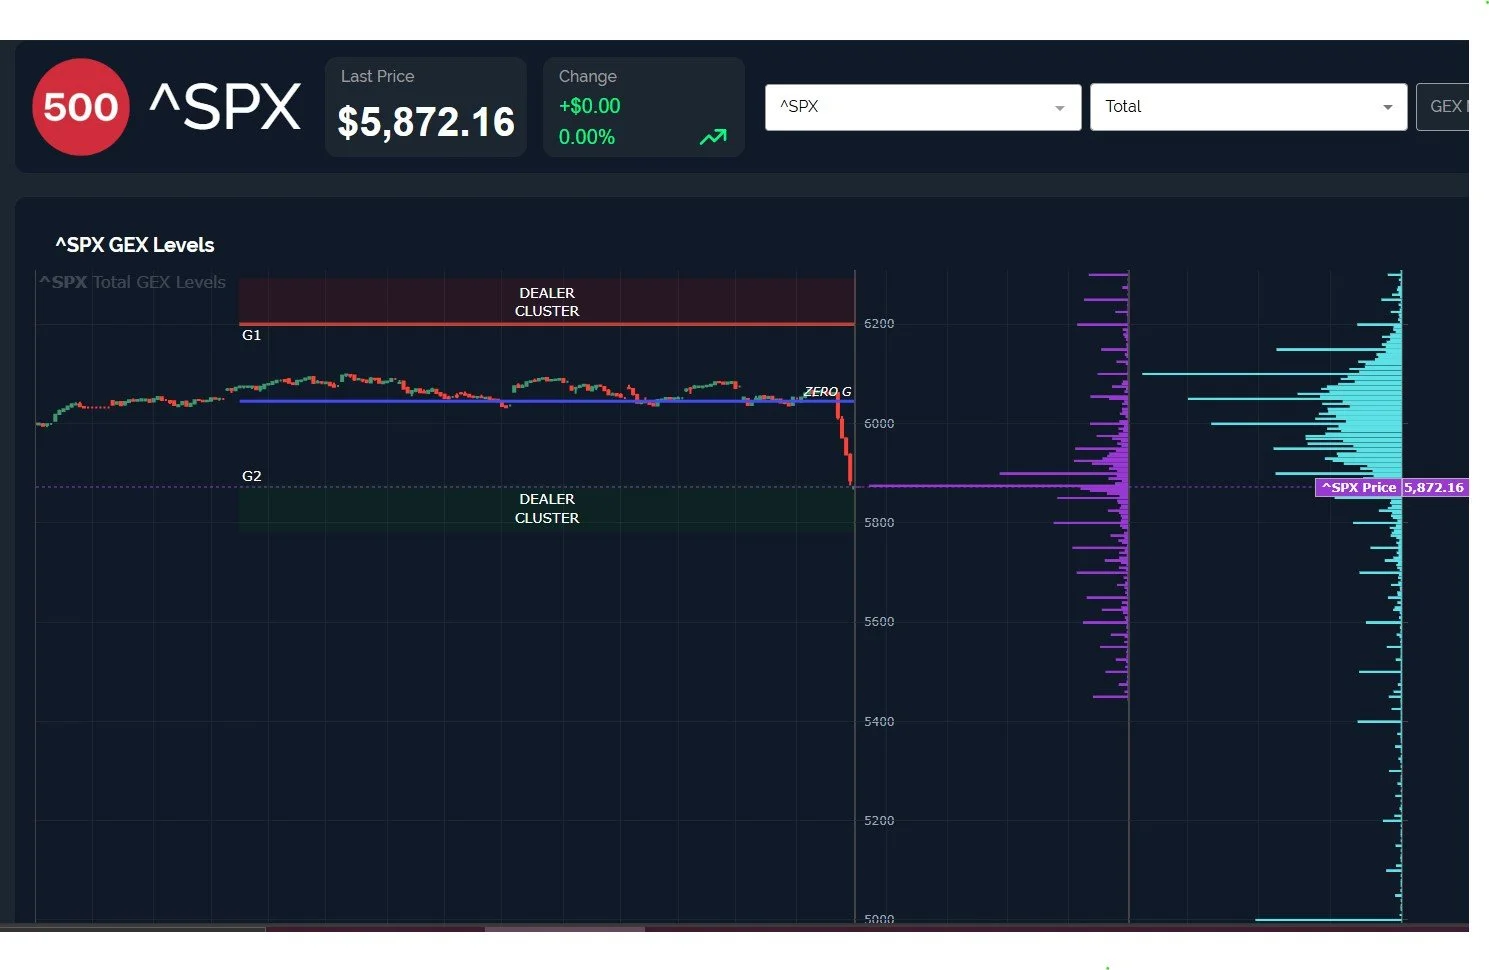
SPX total GEX seriously dropped to -1B, and the GEX intensity gauge measuring GEX relative to prior periods shows that GEX has a ways to go to the bottom, if this move so chooses to drop even more.

Latly, let’s take a brief look at BTC. BTC has an overall bullish GEX picture: positive GEX, strikes ranging from 100 to 110, as far as the largest GEX clusters go.

We mentioned 110k a couple of days ago, and it’s still standing strong for the moment.

The chart also shows BTC to have hit the middle Keltner and bounced perfectly. The top Keltner still matches the significant GEX cluster at 110k.

We saw a sharp, fast decline today, but all hope is not lost for bulls. SPX, DIA, and IWM look like they’re closer to a bottom than a top according to my speculative and subjective view, and each stopped at what I can argue are logical points to stop a decline. Will this drop morph into a larger decline, or will we bounce here for a Santa rally? Join us in Discord as we discuss what we see intraday as new developments emerge. We hope to see you there!
If you’re interested in accessing our tools and analytics, be sure to check out our website. We’re on the verge of rolling out several hundred new tickers and speed enhancements in coming days!
If you’re interested in learning more about our strategy and approach, we address all of these topics in our Geek University course which is included in all memberships.
We recently posted a YouTube video, and we have many other short videos, so give our channel a look if you’re curious about recent market commentary and ideas as well as gamma (GEX) concepts explained.
Thanks for being part of our community and know that we invite your feedback!
The information provided by Geeks of Finance LLC is for educational purposes only and is not intended to be, nor should be construed as, an offer, recommendation or solicitation to buy or sell any security or instrument or to participate in any transaction or activity. Please view our Investment Adviser Disclaimer and Risk Disclosure.