
Is The Drop Over?
2024 HOLIDAY SUBSCRIPTION SPECIAL- $300 off of the annual Portfolio Manager subscription! We JUST rolled out some of our last bug fixes and speed enhancements to our website today, as well as 500 new tickers on the dashboard. Check it out for yourself! Enter code HOLIDAYS at checkout! We are making available 7 discounted subscriptions for this limited time promotion.
Today we saw SPX and QQQ make new lows, but interestingly, IWM and DIA did not. We saw volume at 6000 SPX, which also represents the largest positive GEX cluster expiring tomorrow, despite negative total GEX. We discuss this more in our YouTube video this evening, which you can watch by clicking here. We also discuss MSTR and LQD, new tickers added to our dashboard, so give it a look!
Before we even look at a few tickers, let’s add some potential context to what’s happening this week. Is the character of the market changing permanently with the sharp decline experienced this week? Has this drop been entirely justified by some unexpected shift in market fundamentals? Or is it monthly option expiration week, and too many people got too bullish, so it’s the last opportunity to kill premium and set the stage for a final push higher into year end?
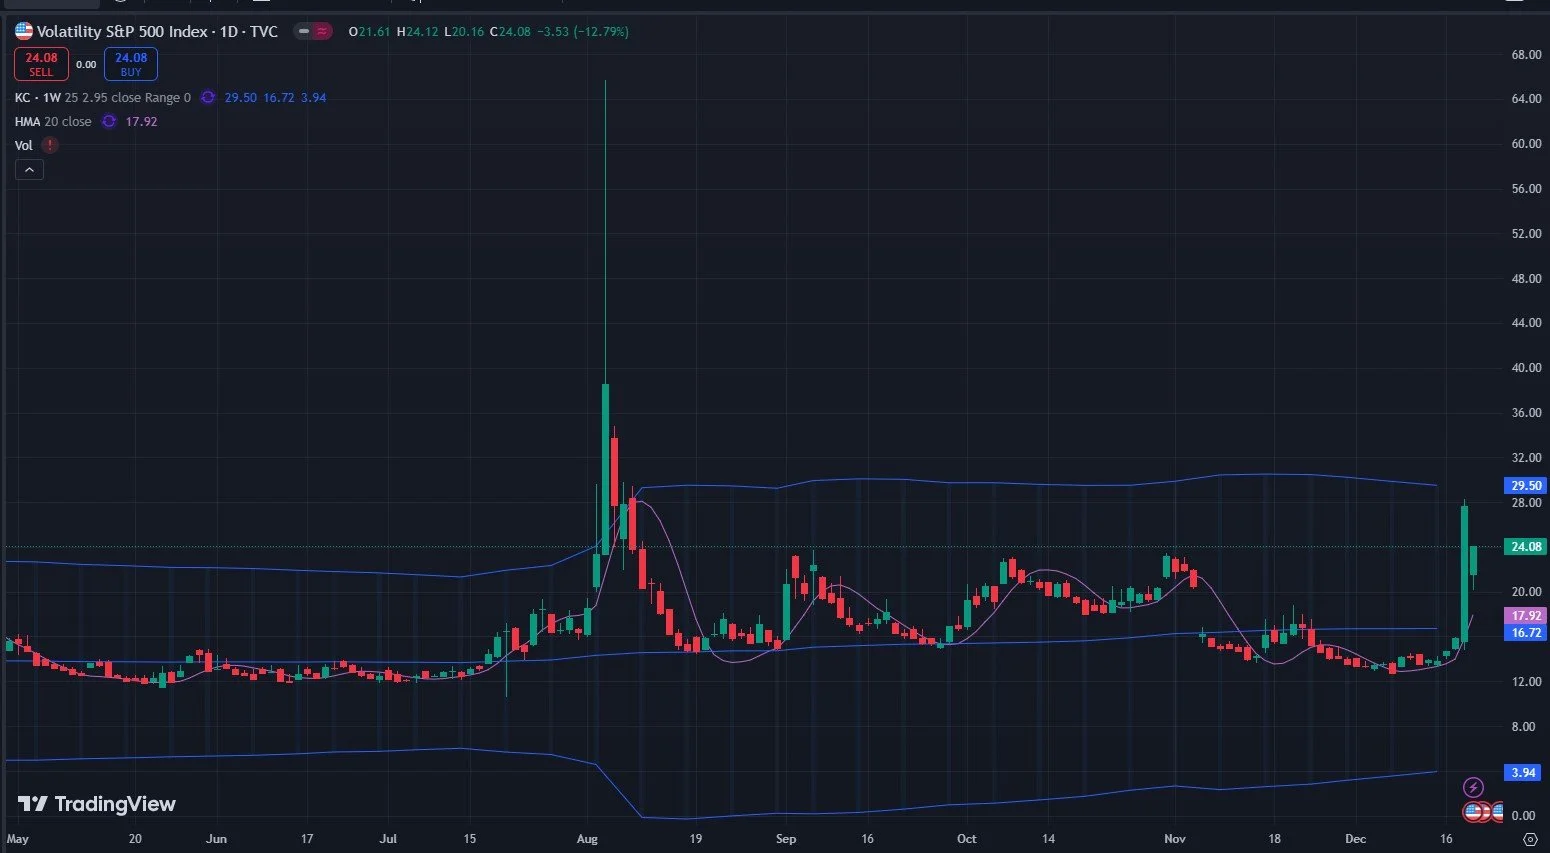
Looking at the chart of the VIX, the VIX gapped down today, but then moved higher, closing at highs of the day but not surpassing yesterday’s high. We haven’t seen a change regarding the 29.50 upper Keltner limit. We also saw noteworthy volume at the 40 and 50 strikes. While we show to be in an upper dealer cluster zone, I don’t get a warm fuzzy feeling seeing the VIX holding gains with option volume at out-of-the-money strikes way above the current level.
Furthermore, let’s look at QQQ’s chart below: We closed below the middle Keltner channel, though we aren’t far enough below to necessarily see the lower Keltner as inevitable. Since September, dropping slightly below the middle channel has marked the bottom, but we also didn’t reach those reversal areas in such a hasty fashion. I definitely see higher odds this time around for QQQ to continue toward the lower channel at 497, which is merely 3.5% away anyway. It’s a believable target and it still paints a picture of higher lows, which isn’t conclusively bearish by any means. And with the end of the year right around the corner, a mere 11 days away, it’s hard to have conviction in sustained downside.

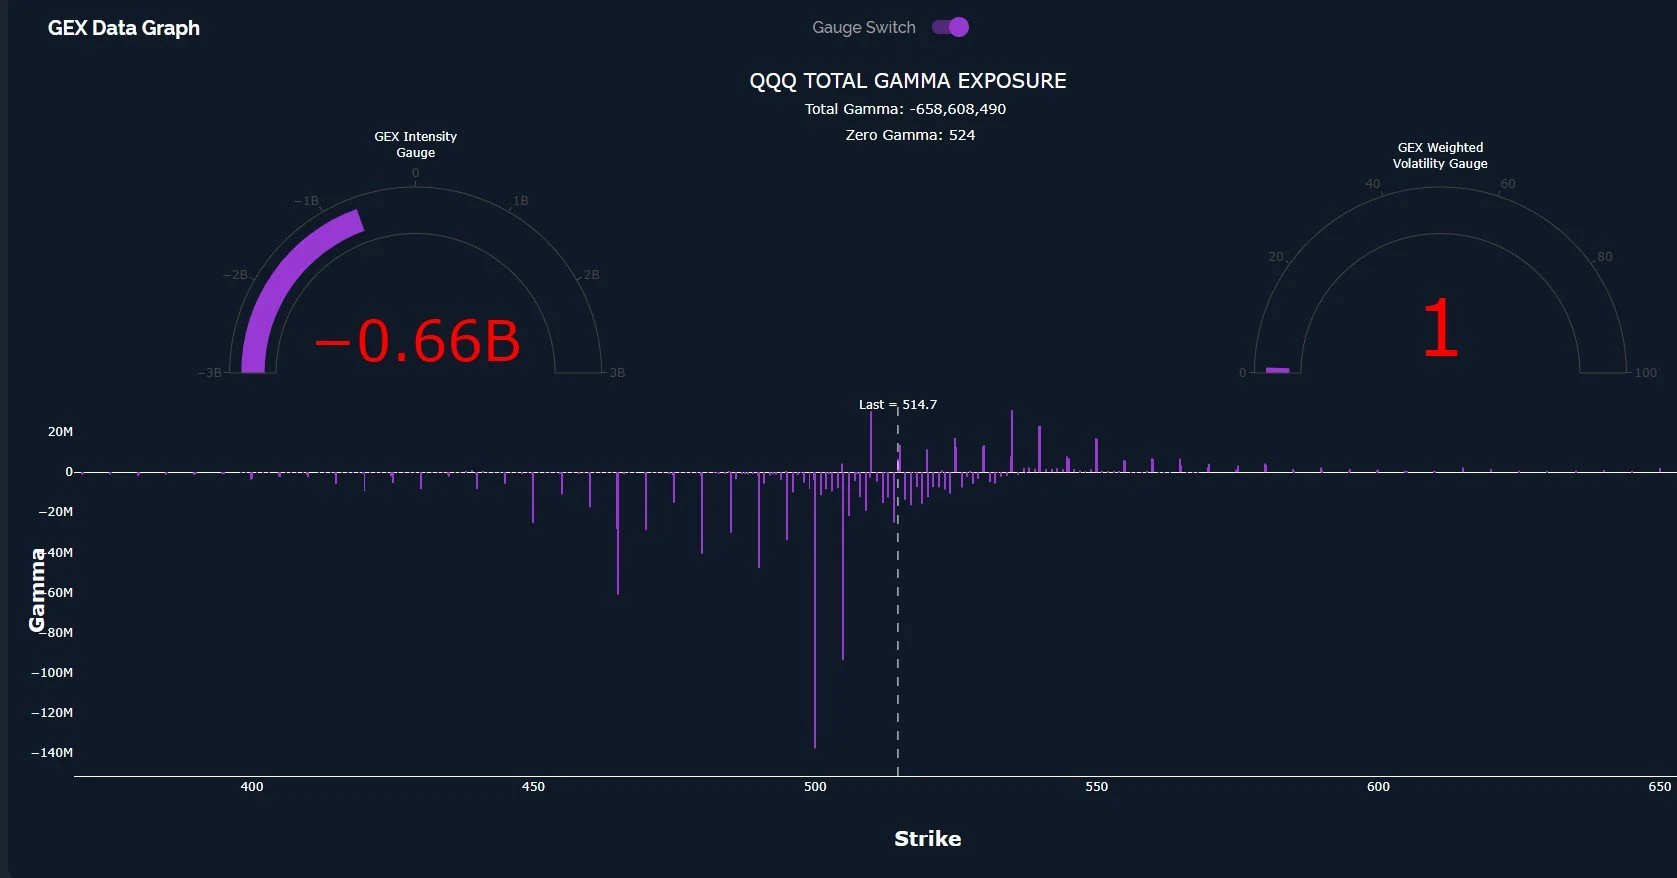
QQQ’s GEX levels also seem to point to a solid possible target of 490-500, as seen in the G2 Dealer Cluster zone below. Such a move could potentially coincide with a VIX spike to a higher high around 29.50-30, though neither of those events have to happen.

QQQ’s GEX data graph shows negative GEX, but it’s not at an extreme yet, and the 500 strike sticks out like a sore thumb as a possible magnet for price.
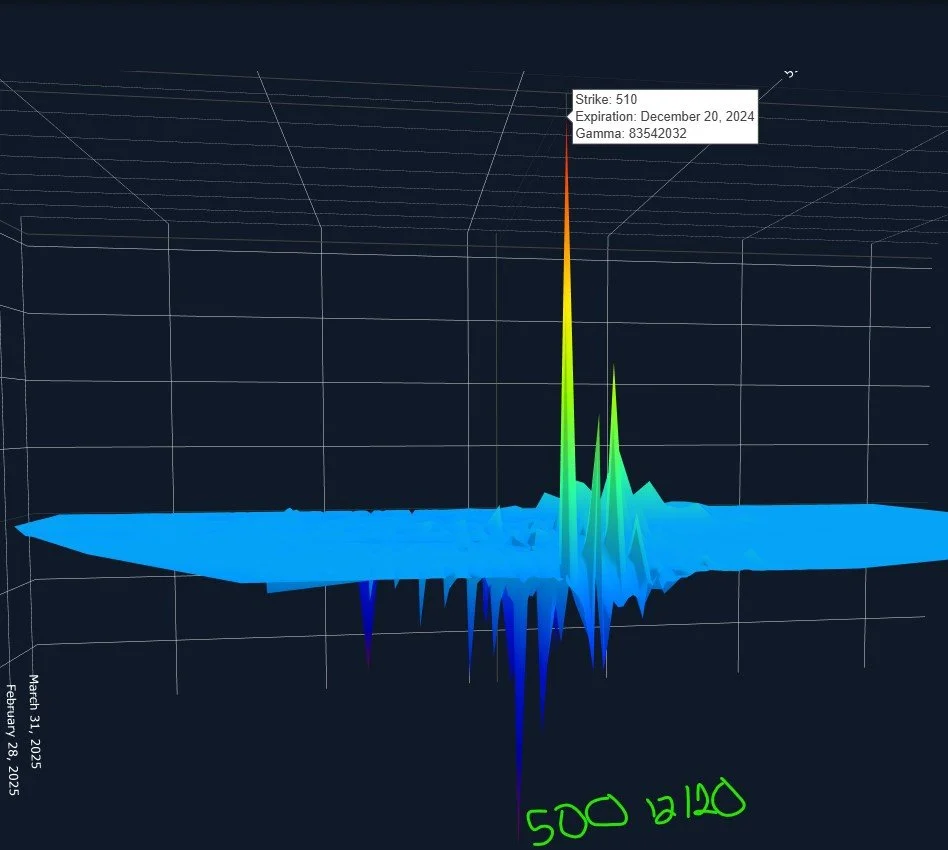
QQQ’s 3D Graph shows negative GEX at 500 and positive GEX at 510 as the two largest clusters expiring tomorrow. Both are lower than today’s closing price, implying two GEX clusters that both may act as magnets.
Switching gears to IWM, as mentioned earlier, we see a candle today that closed at lows, but the days low actually did not exceed the previous days low. IWM has overshot the daily Keltner, but the weekly middle Keltner (as shown below) is right around the current price, representing a logical place for a rebound, in theory.

Another aspect to watch for IWM is the lower Dealer Cluster, which represents an area where sellers may become buyers.

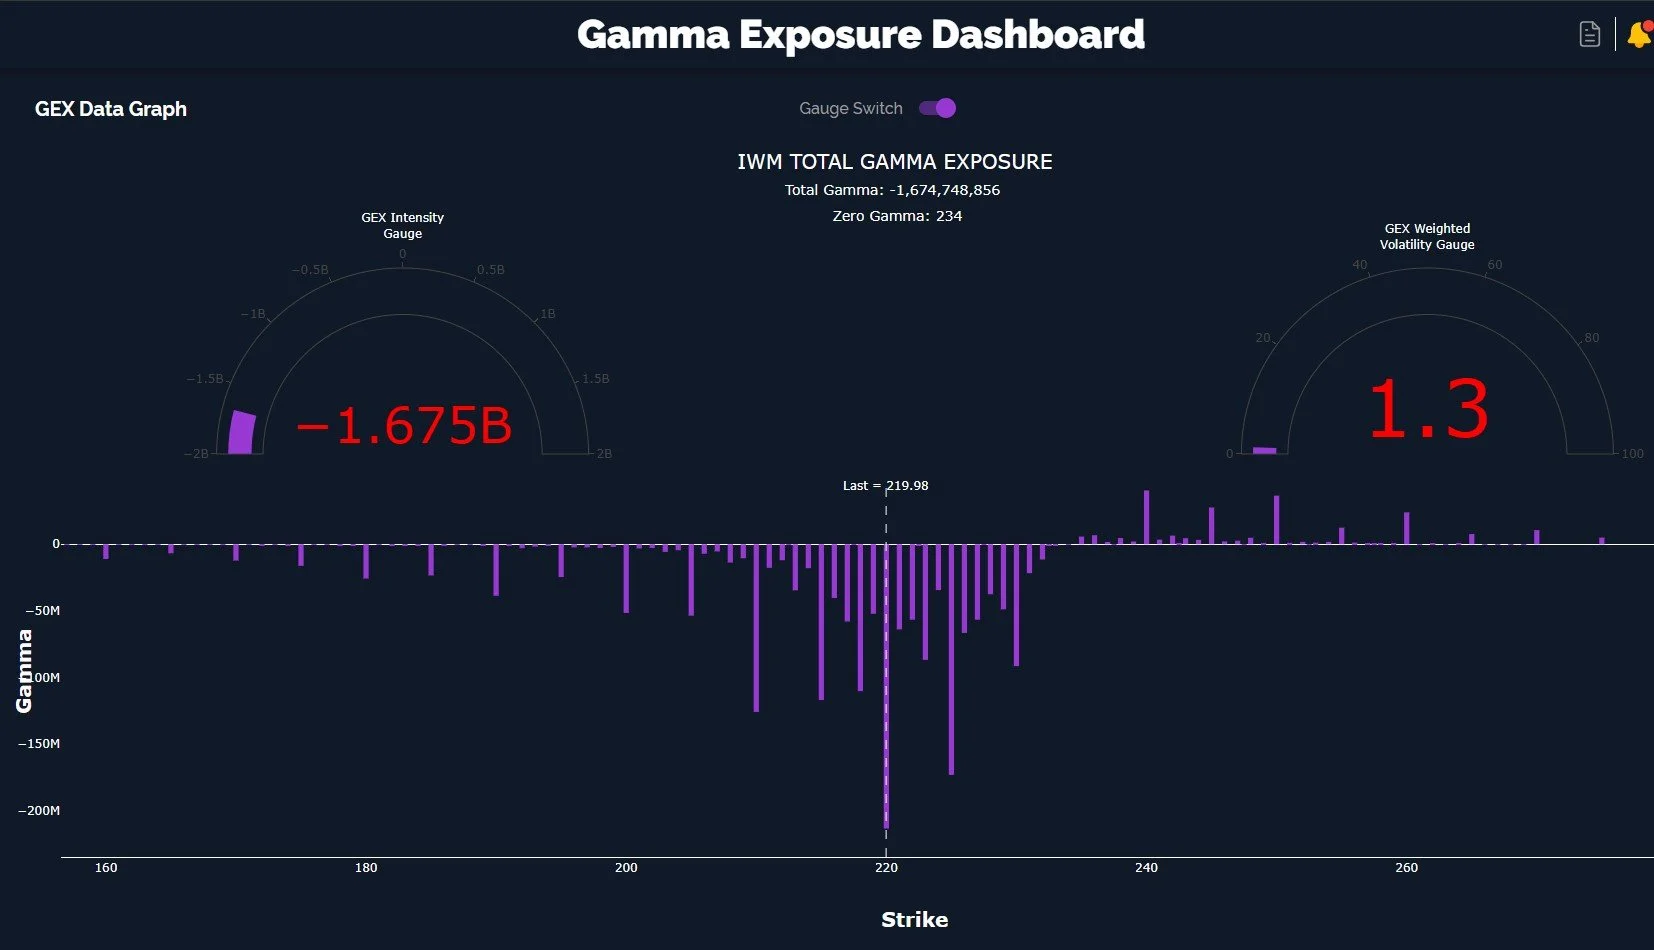
Another possible reason to keep IWM in mind is the lack of significant negative GEX clusters below 220. A long trader could potentially use 220 (or just below 220) as a stop, since that level is so significant. GEX is quite negative but not negative enough to be at an extreme..Though it’s close!
We have to consider the possibility that the VIX spike this week and the market drop could potentially be a liquidation of late and weak longs, setting the stage for a year-end rally. The challenge is that we’ve got up so far and so fast since 2023, it’s hard to know if this is or isn’t something bigger. IWM should (in theory) lead the way by showing relative strangth, and perhaps DIA and IWM both did that today. Join us in Discord as we discuss what we see intraday as new developments emerge. We hope to see you there!
If you’re interested in accessing our tools and analytics, be sure to check out our website. We just rolled out several hundred new tickers and speed enhancements!
If you’re interested in learning more about our strategy and approach, we address all of these topics in our Geek University course which is included in all memberships.
We recently posted a YouTube video, and we have many other short videos, so give our channel a look if you’re curious about recent market commentary and ideas as well as gamma (GEX) concepts explained.
Thanks for being part of our community and know that we invite your feedback!
The information provided by Geeks of Finance LLC is for educational purposes only and is not intended to be, nor should be construed as, an offer, recommendation or solicitation to buy or sell any security or instrument or to participate in any transaction or activity. Please view our Investment Adviser Disclaimer and Risk Disclosure.