
Change Is Imminent…In Which Direction?
Maybe both! Don’t you hate that answer? Let me explain: Today’s 9-day losing streak for the Dow (DIA) is the longest since 1978, according to FactSet. Meanwhile, QQQ is near highs and perched above key Keltner resistance. Today’s YouTube video makes it clear that (especially for SPX) we need to see if the market will trigger either the upside or downside scenarios tomorrow, but we also look at BTC and several other tickers, so check it out.
We mentioned that QQQ’s weekly Keltner channel shows 544 as a possible target. Today went in the opposite direction, but one day doesn’t invalidate the potential to still hit that target (unless you went all in on 0 DTE calls this morning, ouch!). You can see on the chart below, which shows the daily instead of weekly Keltner channels, that the Hull Moving Average is currently at 534 and change. I’ll tactically watch for a drop below 534 to mark a possible short-term shift in bias to the downside for QQQ. After today’s decline, QQQ Is still above 534, and we now have almost 2% to the upside to reach the “extreme” upside target of the weekly Keltner. Gamma (GEX) also backs this with a range shown of 540-550, as we mentioned yesterday.

In contrast to QQQ, look at DIA below. Looks like a foul-smelling dumpster fire at first glance, and we mentioned the stat about the longest losing streak already. But how do we square this with the stark contrast of the tech sector (QQQ) being at highs? Will the Dow and QQQ drop together, with the Dow starting from a much lower point? Will we see an equal and opposite move with QQQ dropping while DIA marches higher? I do like that the upper Keltner channel on DIA’s chart is remaining elevated with 452 the approximate upper boundary.
My contrarian tendencies cause a healthy dose of skepticism when I see the VIX rising into event risk or stocks dropping. If anything, I can think of times in the past (“PG” or “pre-GEX” for me) when Powell’s words were bearish, but no one cared, a short squeeze led to a huge move higher…But only for a day or two. All of these questions and examples can be summarized by saying “I don’t know.” But we won’t know if expectations (as reflected by the markets moves before the announcement) are too bearish or not bearish enough.

IWM looks very similar to DIA, now a mere 2% away from the lower Keltner channel. Will both of these follow the same pathway after this downward move is over?

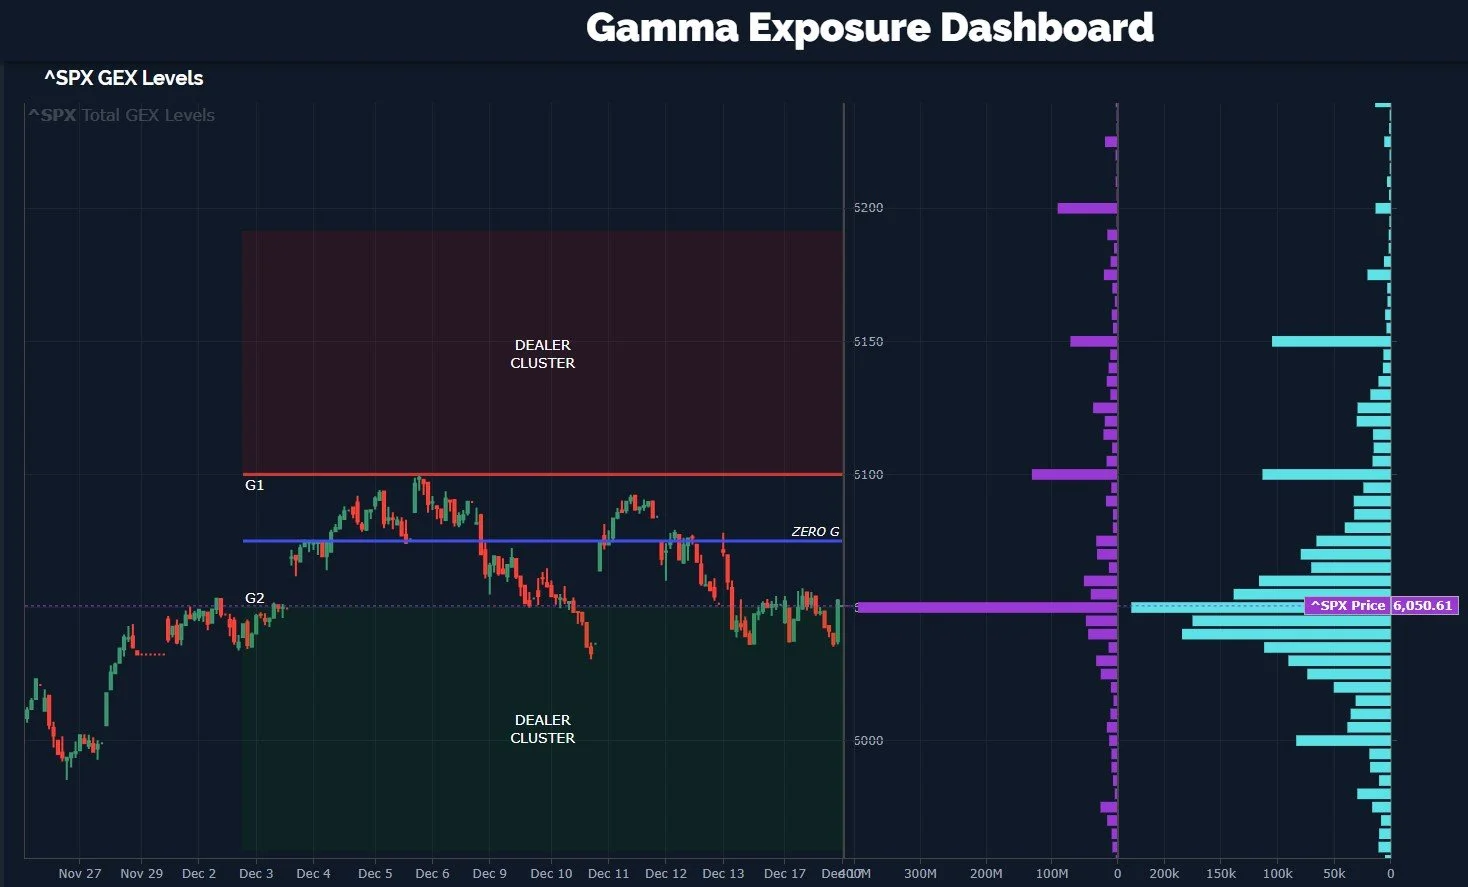
SPX seems to be somewhere in between, clearly not participating to the same extent as QQQ in this latest rally, yet not quite as disastrous as the recent DIA and IWM performance. I do observe some slight shifts that I consider to be more bullish in the short run for SPX, such as the sticky GEX that remains at 6100 and 6150, and the option volume today (light blue bars) at both of those strikes. SPX is also in a Dealer Cluster zone.
Another interesting divergence that I would normally consider to be bearish is SMH, which is lower than it was in October despite the QQQ rally. The divergence aside, I see reasons for semis to be hopeful: Price is above the middle Keltner and the Hull, and we’re generally seeing a pattern of higher highs and higher lows since the end of November.
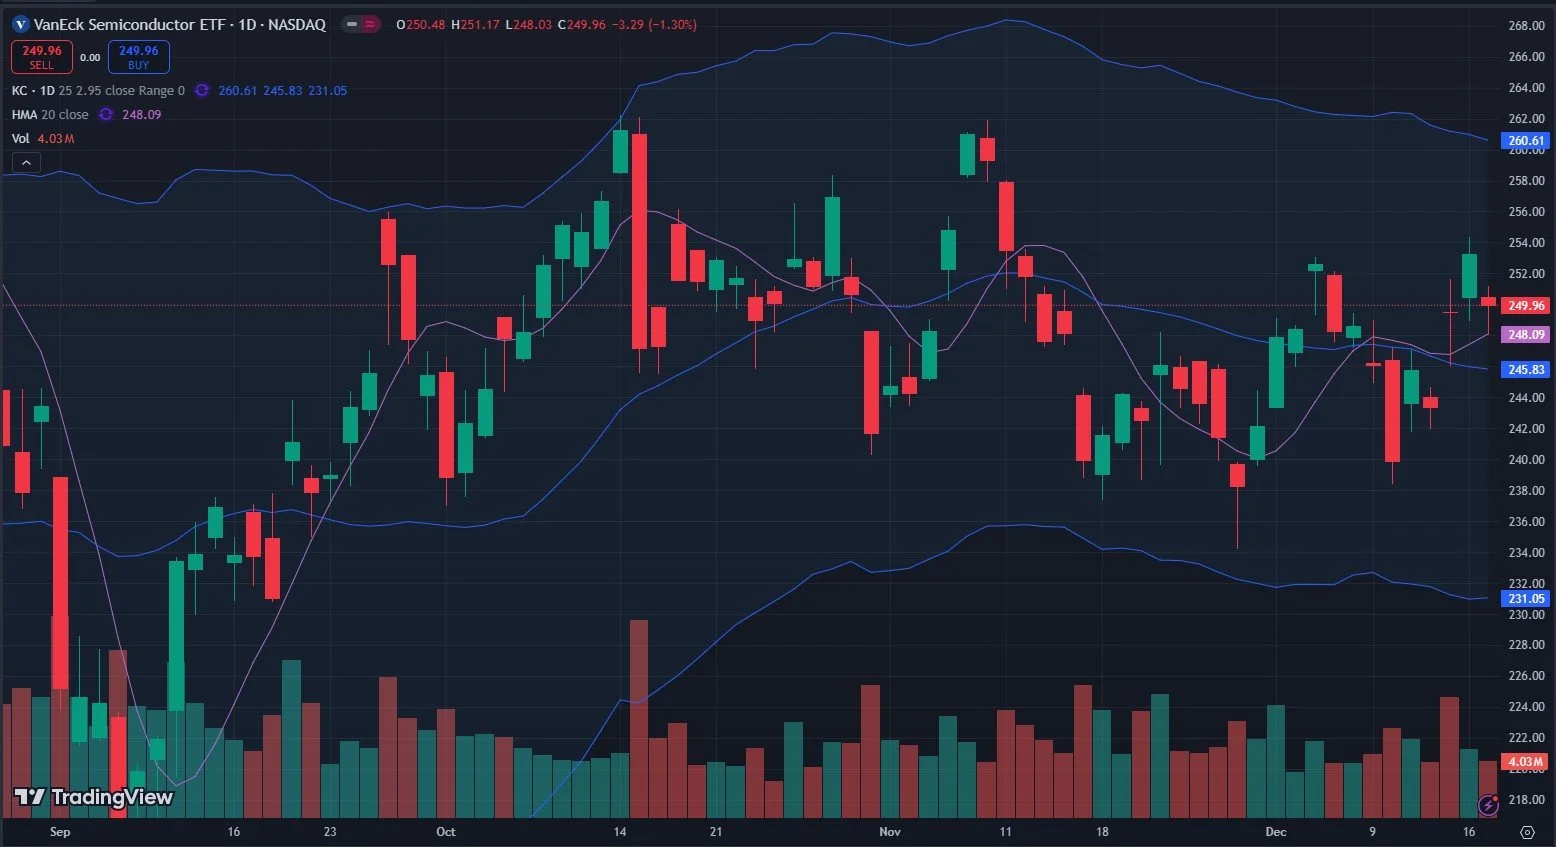
Check out the volume at 255 and 260 today, and 260 also shows a meaningful positive GEX cluster.

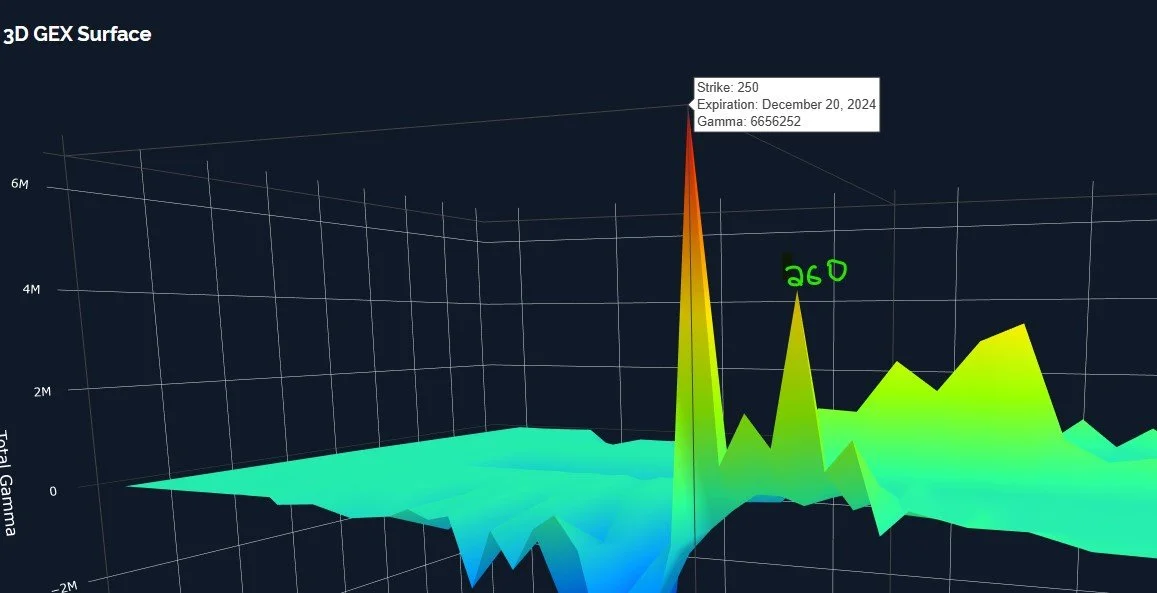
I also see our 3D graph showing 250 and 260 to be the largest GEX clusters expiring this Friday. Remember (for the sake of reference and congruity) that 260 is also the upper Keltner channel.
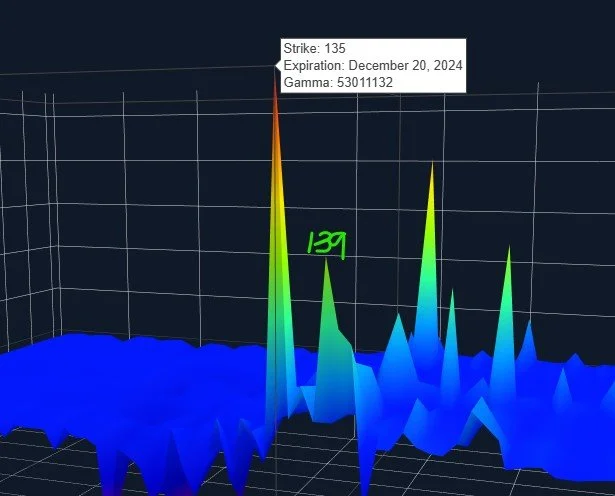
If SMH looks somewhat promising, there’s likely a good shot that its largest component at 23% of assets (NVDA) will participate. NVDA has large GEX clusters at 135 and 139 for Friday.
In summary, I can’t bring myself to go long QQQ at these levels, even though there’s a good shot (based on GEX and certain chart indicators) to see 544 reached, but we can find enough interesting rebound opportunities to not have to fixate on QQQ. SMH, DIA, and IWM all have certain reasons to appreciate the upside risks from here and SPX suggests 6100-6150 are high probability targets. Tread carefully and join us in Discord as we discuss what we see intraday as new developments emerge. We hope to see you there!
If you’re interested in accessing our tools and analytics, be sure to check out our website. We’re on the verge of rolling out several hundred new tickers and speed enhancements in coming days!
If you’re interested in learning more about our strategy and approach, we address all of these topics in our Geek University course which is included in all memberships.
We recently posted a YouTube video, and we have many other short videos, so give our channel a look if you’re curious about recent market commentary and ideas as well as gamma (GEX) concepts explained.
Thanks for being part of our community and know that we invite your feedback!
The information provided by Geeks of Finance LLC is for educational purposes only and is not intended to be, nor should be construed as, an offer, recommendation or solicitation to buy or sell any security or instrument or to participate in any transaction or activity. Please view our Investment Adviser Disclaimer and Risk Disclosure.