
On The Brink
SPX has been providing the most consistent and transparent “messaging,” with yesterday’s previously noted rejection of the Hull Moving Average overhead translating into downside follow through today. While we might see more downside in the near-term, we still have the context of the last mile of the marathon into year end and a chart that looks very bullish. We posted a YouTube video tonight discussing SPX, with a more in-depth look at different aspects not covered here, and also BTC, PLTR, FDX, CVX, and more.
GEX has continued to give us usable indications of bias early in the day, which we’ve been sharing in Discord. The simple reality of positive 0 DTE GEX on SPX yesterday and negative 0 DTE GEX today kept several subscribers out of trouble, even though the downside move was quite slow.
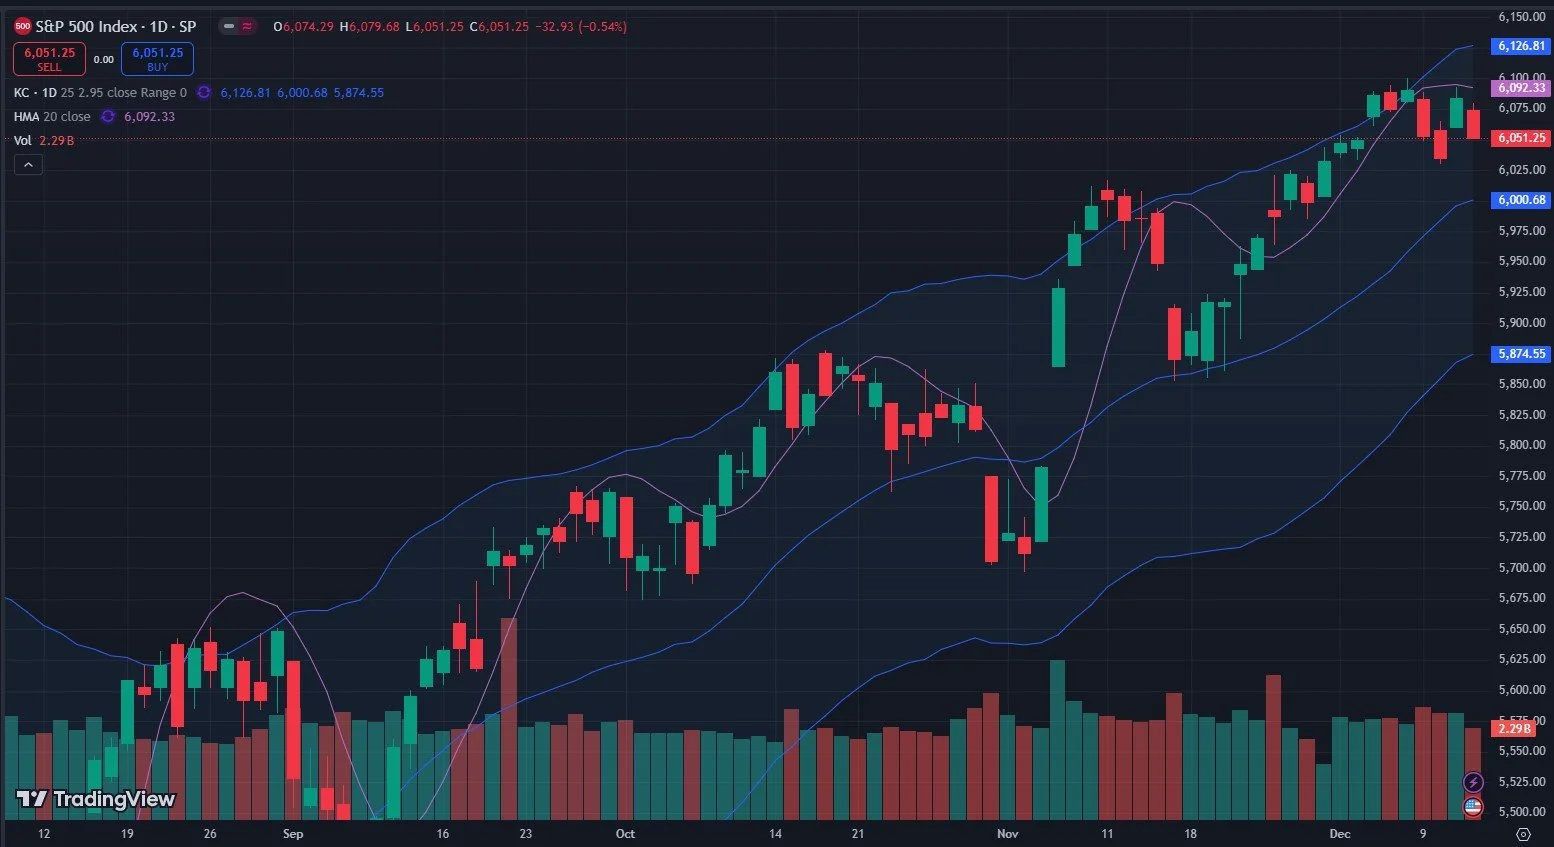
Looking at the chart above, SPX holding below 6092 opens the door to 6000 initially, then 5875 if that doesn’t hold. The Keltners continue moving higher, which is bullish, though I prefer to see price above the Hull as my own trigger to go long. Nothing is easy, and QQQ in particular has really been whipsawing traders with moves like yesterday followed by what we saw today.
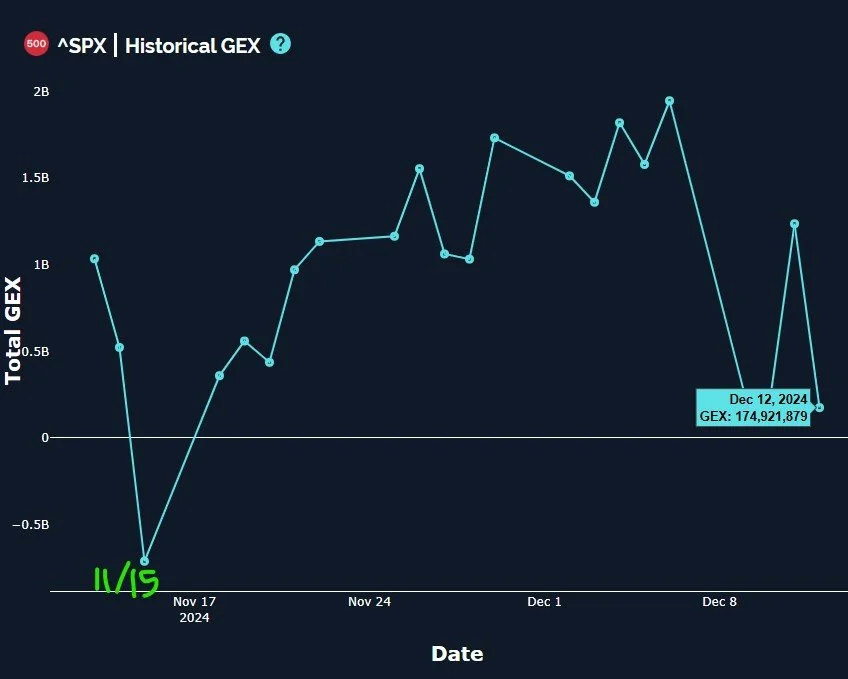
Glancing at the SPX GEX picture below, GEX dropped all the way back to neutral, and concerningly the lowest GEX reading since 11/15. 11/15 was the low price for SPX recently, so this must be the low, right? Not so fast. It’s possible, but we are making GEX lows while SPX’s price has barely dropped from all-time highs, so it’s also possible (I think more likely) that we are preparing for a deeper pullback than what we’ve experienced this week.
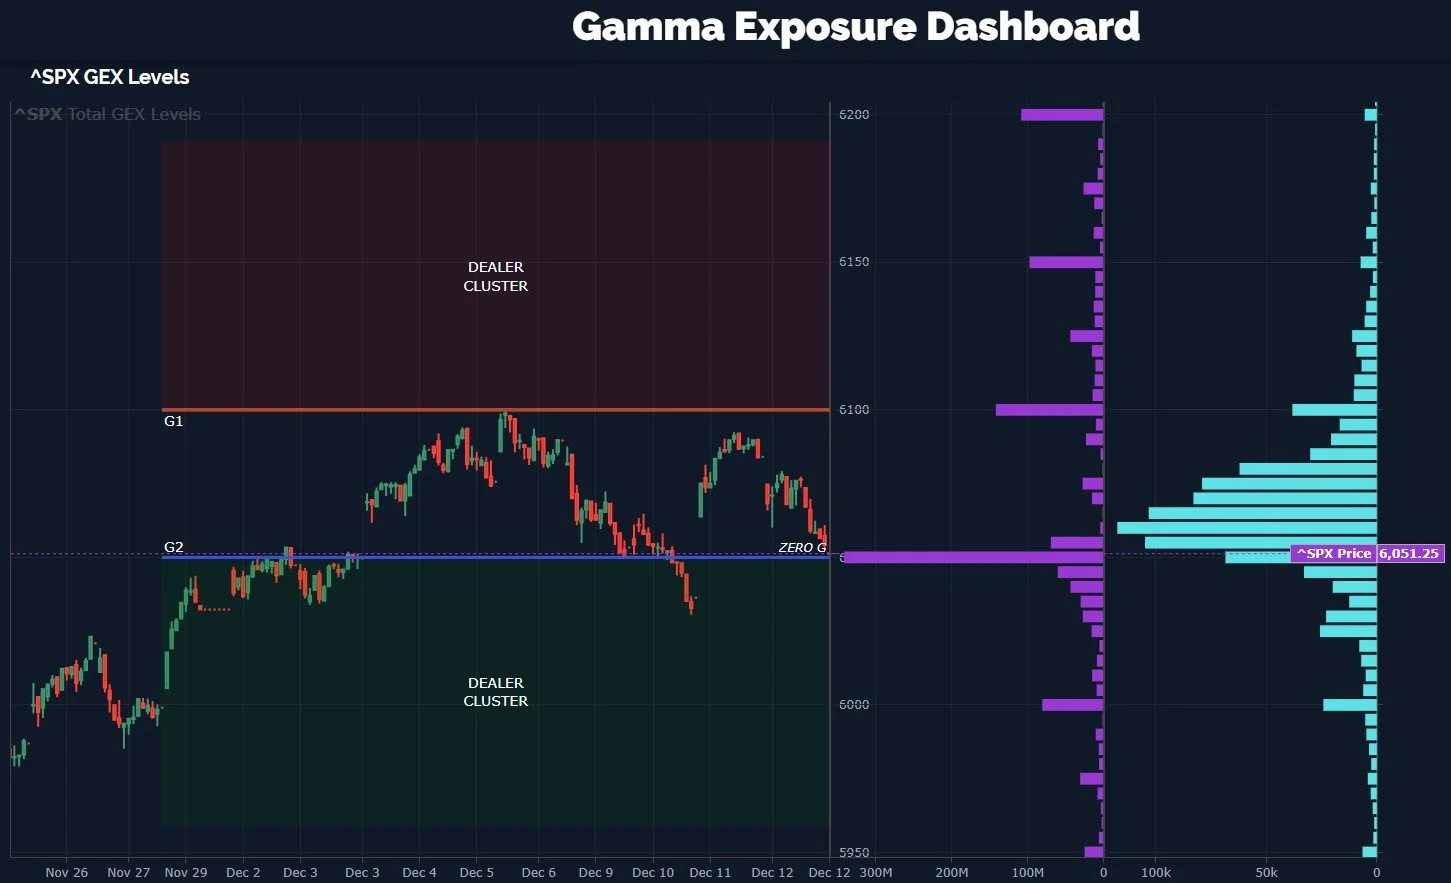
The G1 and G2 Dealer Cluster zones are pretty wide, stretching down to 5960 for the G2 zone where dealers might become buyers, and we closed at the zero GEX line. I can’t draw any conclusions from the chart, but other factors considered, I still see 6100 as resistance and a deeper dive into the green box as perhaps a more likely initial move.
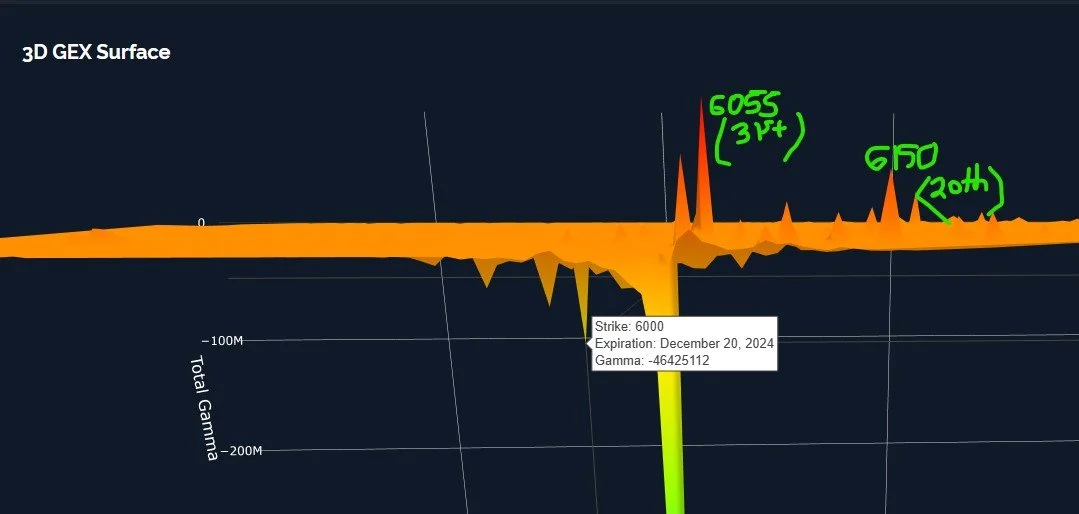
We’ve had slightly negative shifts on the 3D picture, with 6200 gone (again) from 12/20 and a new negative GEX cluster at 6000 appearing.
Let’s shift gears to QQQ to see if it appears to agree with SPX’s less positive look as of late. We had the tricky big green candle Wednesday, but even then, we pointed out that the close above the upper Keltner was not likely sustainable. The rest is history..And we closed below the Hull again today. The target for a continued downside move using these indicators appears to be between 497-513. The Keltners continue moving higher, so the chart looks bullish, so a pullback can still represent a refueling opportunity for bulls to then push even higher. Does that happen in December, or in January? Or at all? I will watch closely for shifts in the positive GEX strikes as the pattern takes shape in coming days.

GEX is back to neutral for QQQ as well, which leaves open a number of possibilities in coming days.

QQQ still has meaningful GEX at 530, 535, and 540, and we’ve already visited the 530 area. The lower G2 zone begins at 505, which is a solid -5% from here, if we do begin a deeper pullback.

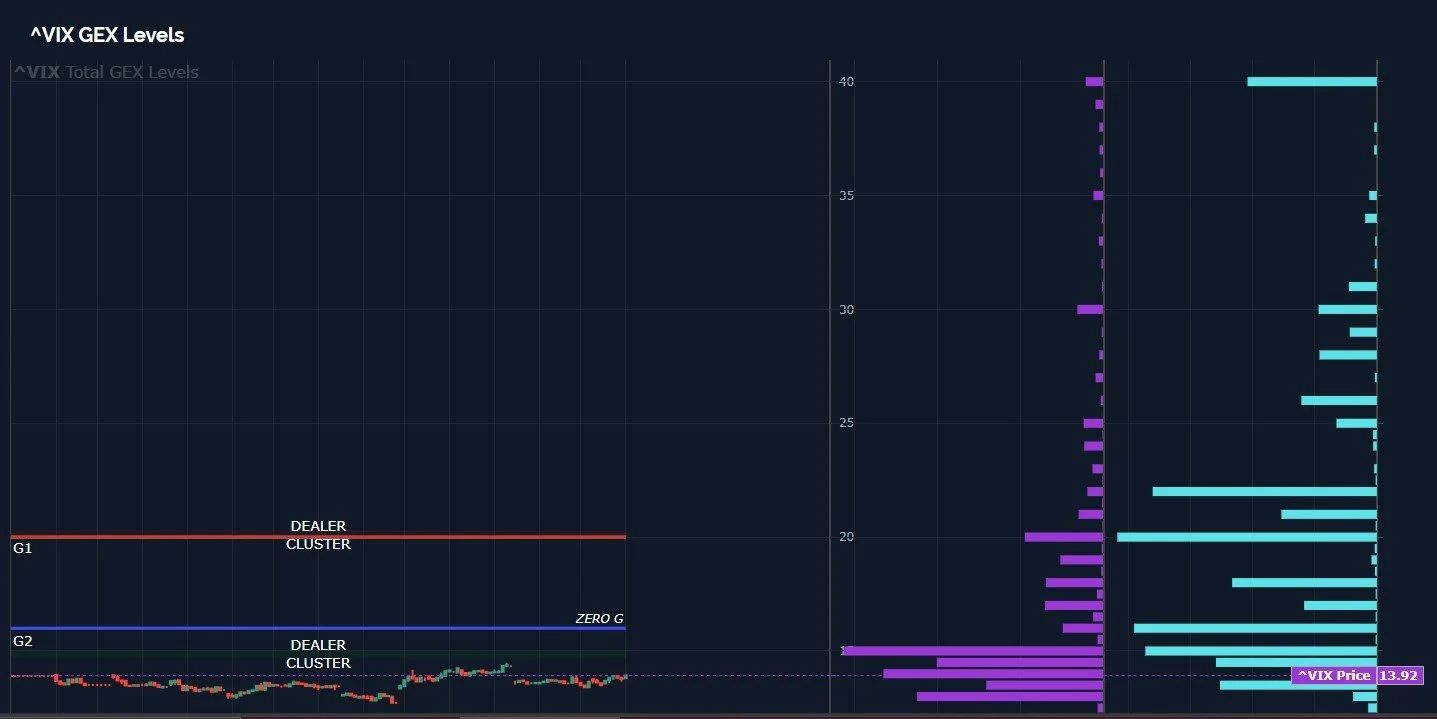
Lastly, the VIX once again saw option volume at the 40 strike, and the highest volume of the day is at 20. Lots of activity on the VIX at higher strikes, and VIX/VVIX were both positive today. Between the VIX option activity, the negatively correlated days between VIX and VVIX recently, and my indicators on SPX, I think bulls need to be cautious for the time being.
Tread carefully and join us in Discord as we discuss what we see intraday as new developments emerge. We hope to see you there!
If you’re interested in accessing our tools and analytics, be sure to check out our website.
If you’re interested in learning more about our strategy and approach, we address all of these topics in our Geek University course which is included in all memberships.
We recently posted a YouTube video, and we have many other short videos, so give our channel a look if you’re curious about recent market commentary and ideas as well as gamma (GEX) concepts explained.
Thanks for being part of our community and know that we invite your feedback!
The information provided by Geeks of Finance LLC is for educational purposes only and is not intended to be, nor should be construed as, an offer, recommendation or solicitation to buy or sell any security or instrument or to participate in any transaction or activity. Please view our Investment Adviser Disclaimer and Risk Disclosure.