
Warning Signs Emerge
What a day! The market seemingly celebrated the CPI report, or at least the lack of any major negative surprises in the CPI report. However, we see QQQ appearing stretched after destroying all remaining resistance levels to the upside, SPX with room overhead yet closing below the Hull Moving Average, and IWM actually red, in addition to VIX divergences. We posted a YouTube video tonight discussing related (yet different) aspects of SPX, TSLA, GOOGL, DE, and more. Even approaching a “danger zone,” we still find individual opportunities.
We have PPI and jobless claims premarket Thursday, and given that we moved up a lot today, tomorrow’s news has the potential to serve as a catalyst for volatility. Regardless of the news (I stopped looking for fundamental reasons for moves a long time ago), QQQ is quite far above the upper Keltner channel and diverging from the semis (ticker:SMH), so I suspect SPX and possibly even IWM may be the “catch-up” plays in this round of musical chairs, similar to what we said about QQQ in mid-November. I have low conviction regarding a prediction for tomorrow, but I do think we have a good shot at seeing tomorrow move opposite of what we might see Friday. Our early- to mid-morning gamma (GEX) indications have continued to deliver trade opportunities most days, and our subscribers are capitalizing, so hop into Discord to check it out.

www.geeksoffinance.com
Looking at the chart above, the VIX has been consolidating at the lower side of a resistance-turned-support trendline we can draw back to early 2023. Interestingly, look at that big light blue bar next to the 40 strike..The largest volume of the day. This doesn’t mean the VIX goes to 40 tomorrow, but maybe our old friend “50 Cent” vol trader is buying some cheap hedges at a minimum. Reasons are purely speculative, but the volume happened. We see the upper Dealer Cluster zone at the 20 level, a target I’m much more comfortable considering as realistic in the intermediate term.
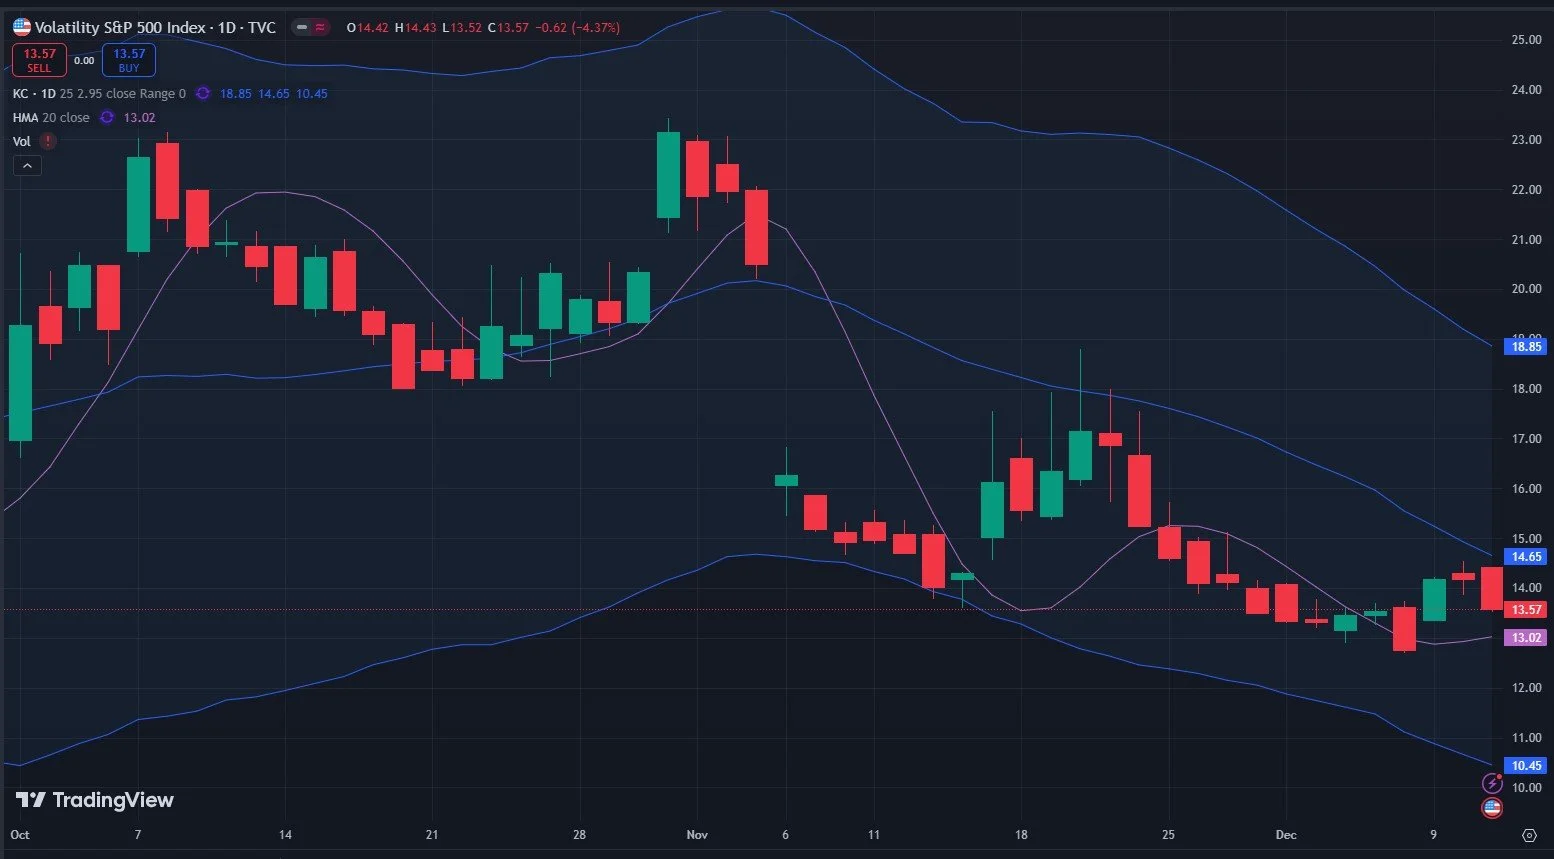
Now let’s deal with one of my favorite volatility spike indicators, the VIX:VVIX negative correlation. While imprecise in terms of exact timeframe or magnitude of spike, several days over a period of 1-2 weeks of negative correlation between VIX and VVIX corresponds strongly with future VIX spikes. We were 2-3 days early in November using the same data, which I consider to be “close enough.” We saw a big divergence today, with VVIX (the index measuring the future expected volatility of the VIX) up almost 4 points while the VIX was red.
The VIX is above the Hull, and it can decline to just above 13 and still be above that indicator, and VVIX is also above the line. Holding above the Hull is an indication to go long volatility in my personal methodology.

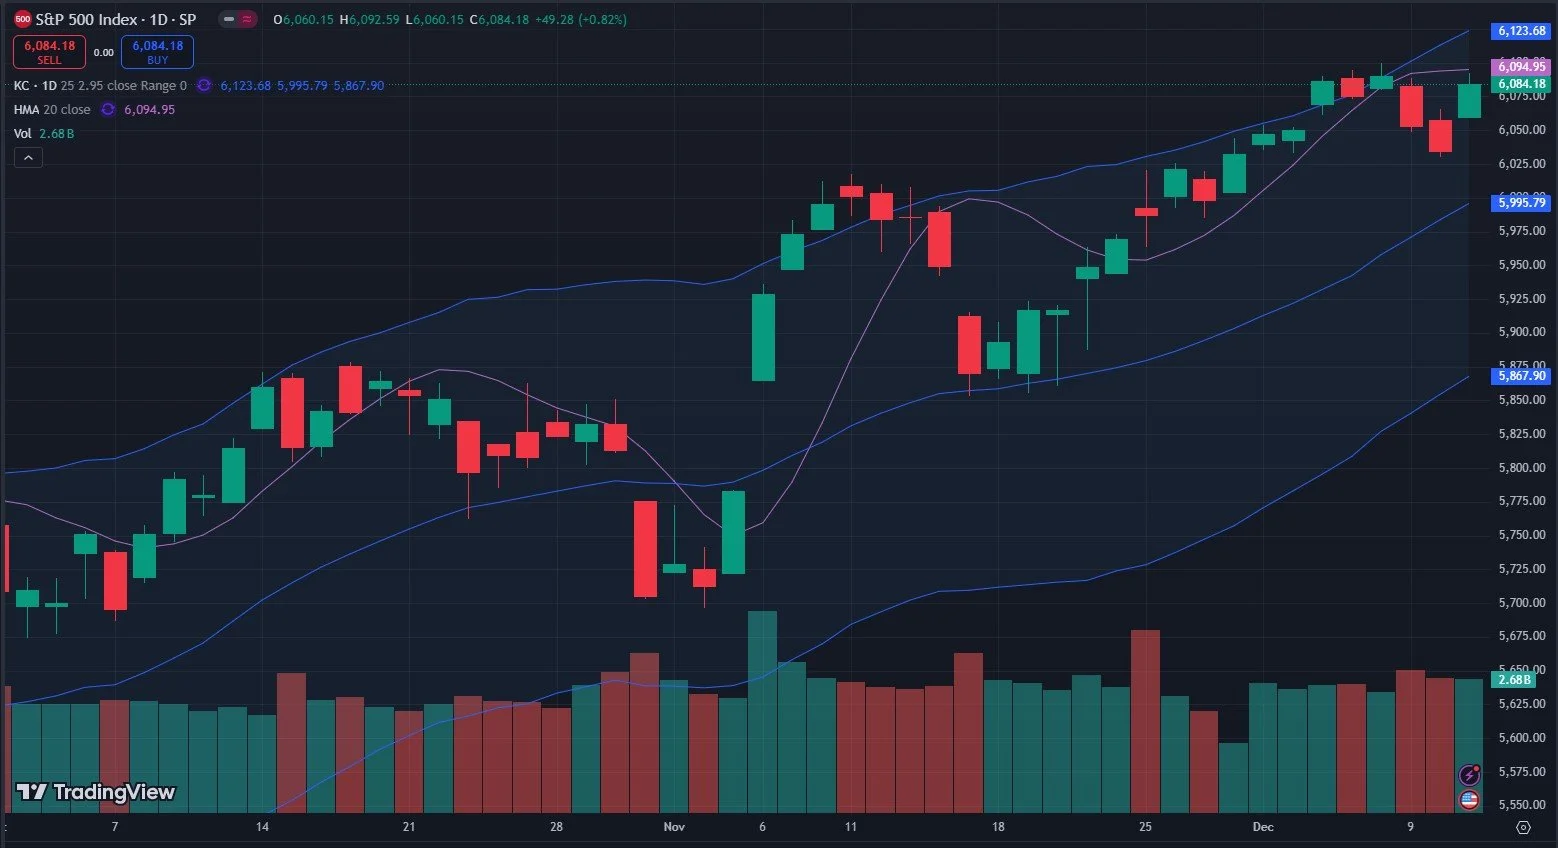
We also have SPX almost perfectly testing the Hull from below, which we can view as prior support turned resistance, though the Keltners keep chugging upward, with 6123.68 now representing the upper band. I wouldn’t be surprised if we gap above the line and head toward that 6123, in fact we might head toward the 6150 GEX cluster if we make it that far. The other possibility is continuation toward 6000.
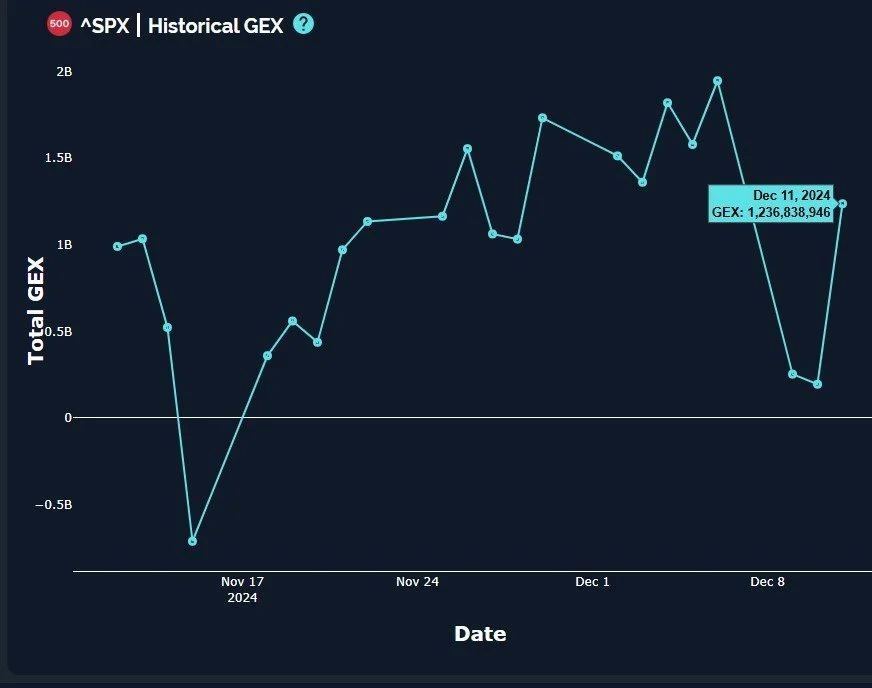
SPX briefly almost made it to the zero GEX line as of Tuesday, but Wednesday brought net GEX back up to a bullish 1.2B.
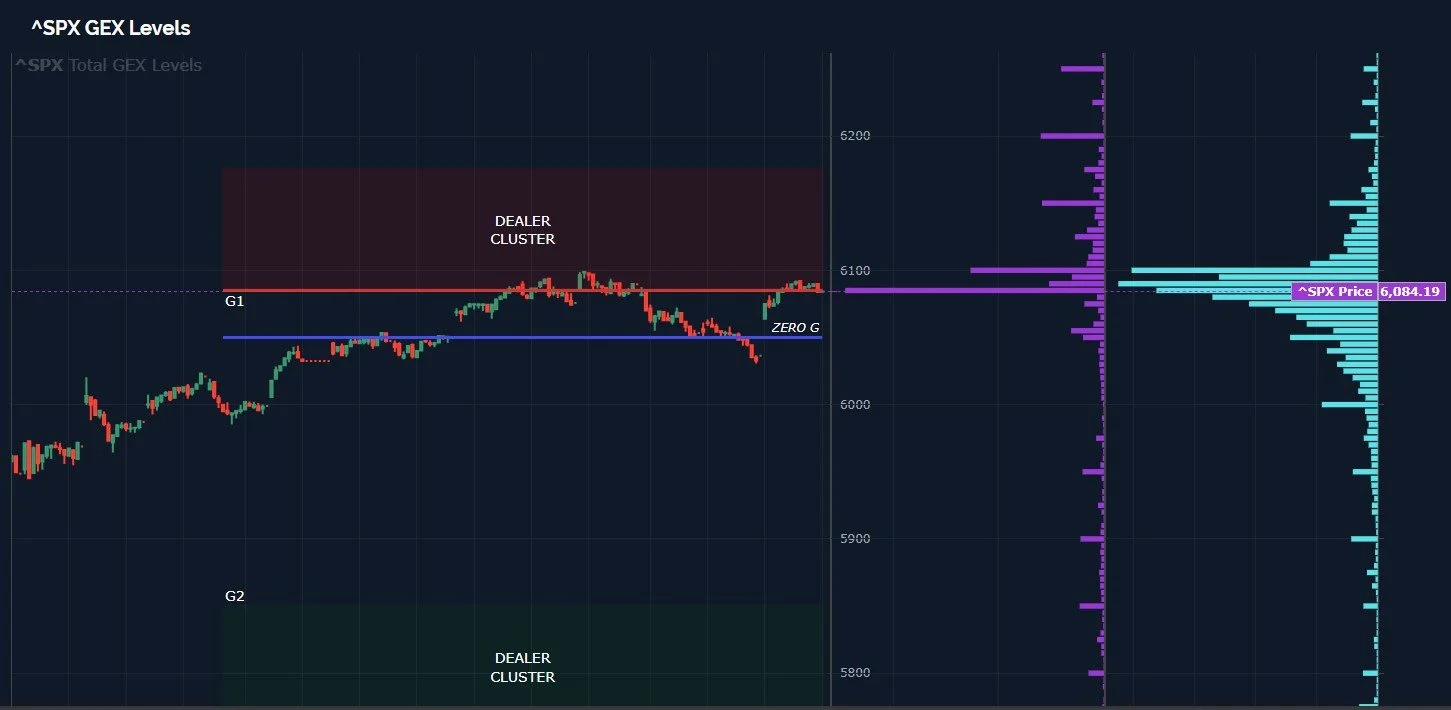
While we’re relying upon the 0 DTE GEX readings for our daily prognosis, it’s important to keep the broader context in mind, which is that SPX (and QQQ) are still in a G1 Dealer Cluster that stretches to almost 6200 for SPX. We have sizable GEX clusters at those levels, though 6200 in particular has been “squirrely” in terms of showing up and then disappearing as a meaningful cluster on any one particular date. For now, 6100 and 6150 seem to be worth watching as initial targets for bulls. But the upper Dealer Cluster zone is where we would expect dealers to potentially sell, though sometimes the stalling in this zone looks more like sideways consolidation. If this is the case, we’d expect GEX to grow at higher strikes, shifting the G1 and G2 zones higher as well. We’re talking about potential further upside (assuming the current GEX picture) of roughly 2%, but as you can see, downside could be anywhere from -3% to -5%, at least initially. Most of the option volume today (in light blue) was at 6100 or lower.
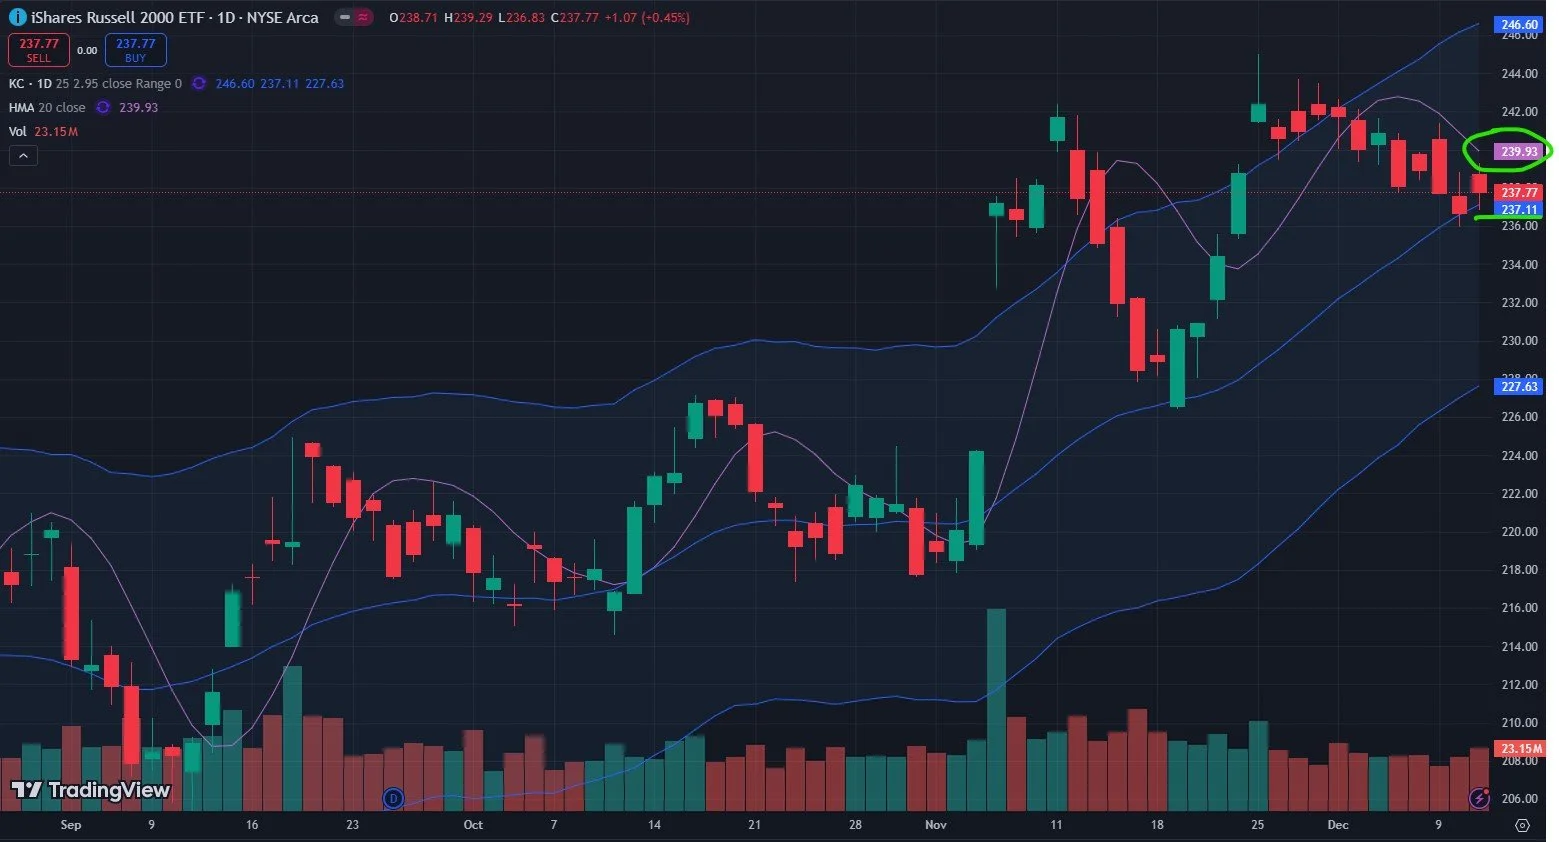
Let’s briefly look at the ugliest duckling today, IWM. This little duck seems to have a problem with plucking its own feathers, but it may also be the biggest upside mover if the broader market is going to drag this one up. Furthermore, it’s getting pinched between the rising middle Keltner and the declining Hull, so IWM appears poised to break out of this consolidation pretty soon. While we see a lot of red candles since late November, I can pretend to be color blind and I see a bull flag building. 246.60 would be the upper Keltner target currently. A move down to the lower Keltner would invalidate the exact setup mentioned previously, but I will be revisiting the GEX picture if that happens in anticipation of potentially buying that dip as well.
IWM’s total net GEX picture doesn’t add much predictive power at the moment, but we can note that it’s sticking to the zero GEX area for now. This indecisiveness is not necessarily bearish, it simply means we need to look elsewhere for clues.

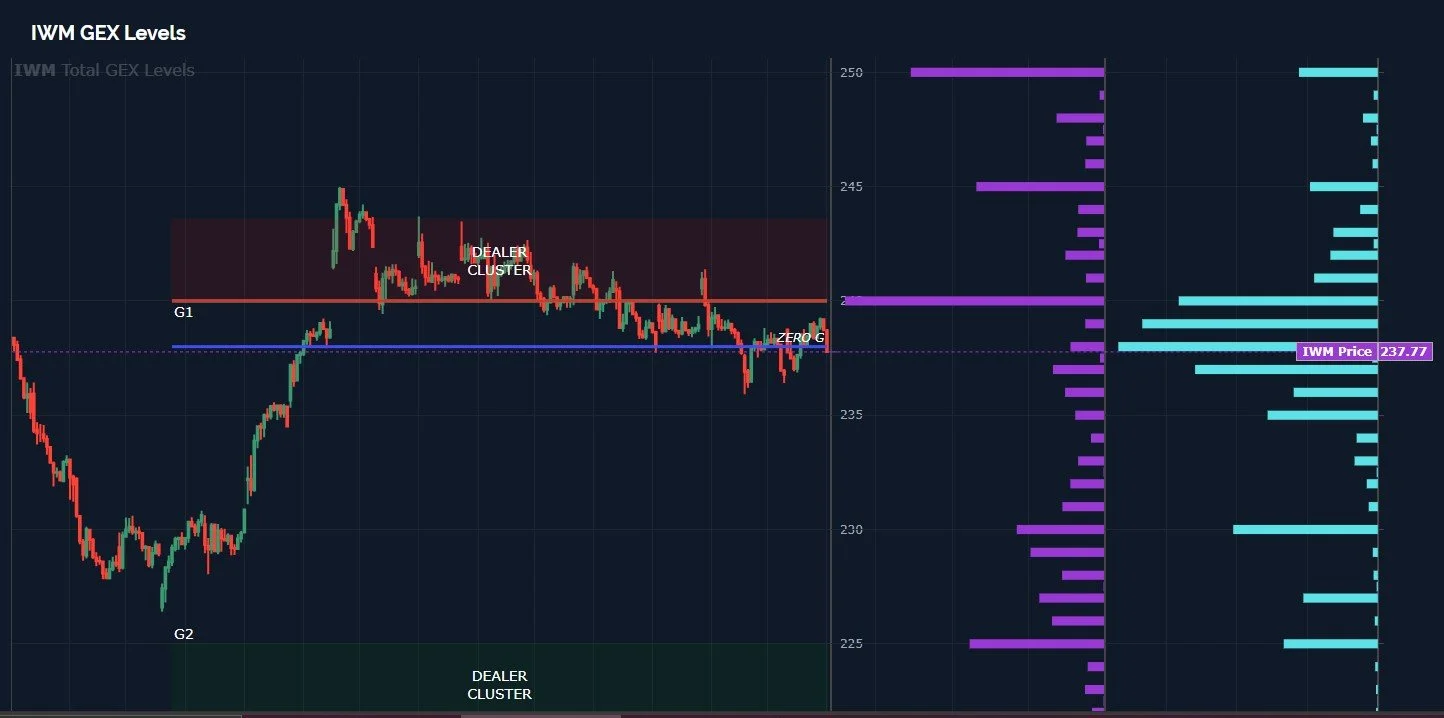
IWM’s current GEX levels look less bullish, with volume active at lower strikes (down to that 225 area) and price just below the upper G1 Dealer Cluster. IWM can be quite volatile at times, so even with the picture below, keep in mind we can see IWM reach above the upper edges of the red box and tag the upper Keltner channel that coincides with the outer limits, and that’s within the realm of realistic possibilities.
Tread carefully and join us in Discord as we discuss what we see intraday as new developments emerge. We hope to see you there!
If you’re interested in accessing our tools and analytics, be sure to check out our website.
If you’re interested in learning more about our strategy and approach, we address all of these topics in our Geek University course which is included in all memberships.
We recently posted a YouTube video, and we have many other short videos, so give our channel a look if you’re curious about recent market commentary and ideas as well as gamma (GEX) concepts explained.
Thanks for being part of our community and know that we invite your feedback!
The information provided by Geeks of Finance LLC is for educational purposes only and is not intended to be, nor should be construed as, an offer, recommendation or solicitation to buy or sell any security or instrument or to participate in any transaction or activity. Please view our Investment Adviser Disclaimer and Risk Disclosure.