
SPX: A Warning, Or Opportunity?
Or neither? In today’s newsletter, we’ll look at the noticeably underperforming SP500 relative to QQQ, as well as continued interesting activity on the VIX as we approach Wednesday morning’s monthly VIX expiration. We posted a YouTube video this afternoon covering different yet related points regarding SPY and SPX as well as analysis of BTC and a few big tech names, so give it a quick watch.
Even as we go over some speculative possibilities of what might happen in comings days/weeks/months, keep in mind we are active intraday in Discord, where we engage with subscribers (and our free community participants as well) as we share real-time gamma (GEX) updates when and if the intraday picture shifts. Friday was a great example of this as we shared analysis of QQQ in the morning that played out well, and then SPX cooperated in our favor, too.
The VIX sees its monthly option expiration during OpEx week sometimes (such as December’s OpEx this year), and other times it falls on the week after. GEX has helped us with some parameters that proved to be fairly accurate in hindsight over the last few months, particularly since the VIX has been so lopsided toward negative GEX lately. Before we look at the GEX setup, let’s look at the chart below, which actually carries bullish potential for volatility: We’re at a longer term theoretical support area for the VIX, we’ve seen volatility subtly moving higher since the VIX regained the Hull 6 trading sessions ago, and we see signs of weakness from some indices. Seasonality would be an argument against the VIX, but will the market get droned this holiday season? We certainly see plenty of atypical things happening around the world.

As we look at bullish and bearish contrasting cases for volatility, I also note the whacky wick down to 10.62 that you can see circled on the Tradingview chart back in July. That candle (if real) seems very out of place, but it almost matches up with the lower Keltner channel now at 10.45. I know traders who follow strategies based on ghost candles seen on SPY after hours, they have some interesting stats and theories behind those candles…Sorry to get off track, that’s for another day. Could a final “stick it to the bears” rally take the VIX back to sub-11 before January? Why not! It’s hard to say that’s the base case, but it’s possible. We could also see the VIX rise with the market into year-end..Interesting times indeed.

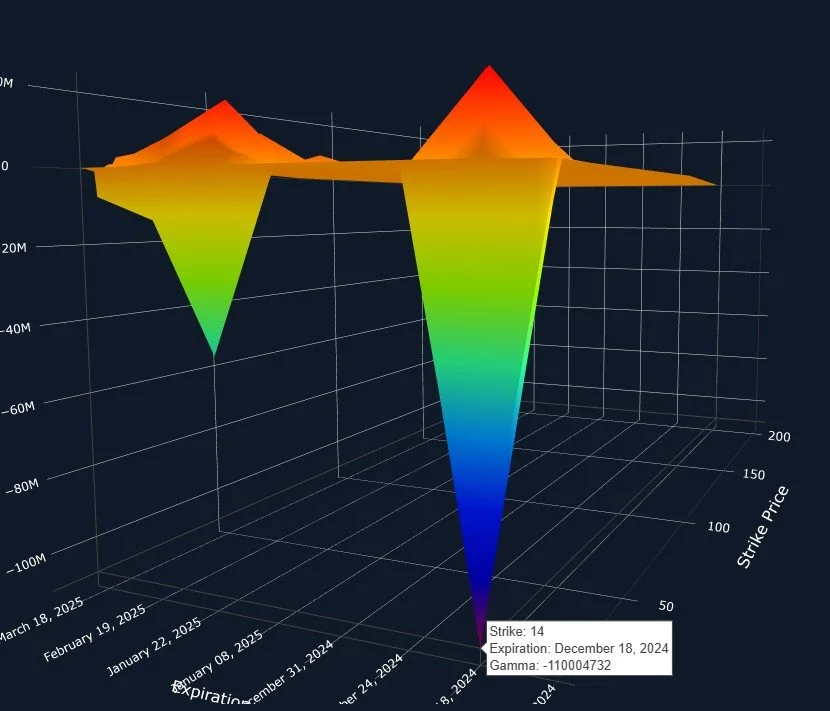
Our GEX levels chart above shows our flatlined friend still hanging out just below the Dealer Cluster “buy” zone, with GEX concentrated at levels between 13-15 on the negative side, and 20 as the largest cluster on the positive side. But daily volume (light blue bars) continues to be quite interesting. Lots of options being traded at really high “save me from the black swan!” strikes, including 35, 40, and even 70.
The 3D graph below shows the 14 strike as the largest strike set to expire Wednesday, but we also see 13 as a large negative cluster (not highlighted on this particular screenshot). Zero GEX is 16. Will all of the put holders at 13 and 14 get rich by Wednesday, or are we more likely to see the VIX creep a bit higher toward 15-16? If you recall the TradingView chart earlier, the middle Keltner is 14.5, and we’re above the Hull Moving Average. This means my technical bias is higher, with a breach of 14.5 potentially causing a VIX spike toward 18. This is in contrast to a clearly negative GEX picture, so I am not drawing conclusions so much as raising questions for your aspiring active brain to sort out. I do recall the saying that periods of low volatility precede periods of high volatility, as self-evident as that may seem.
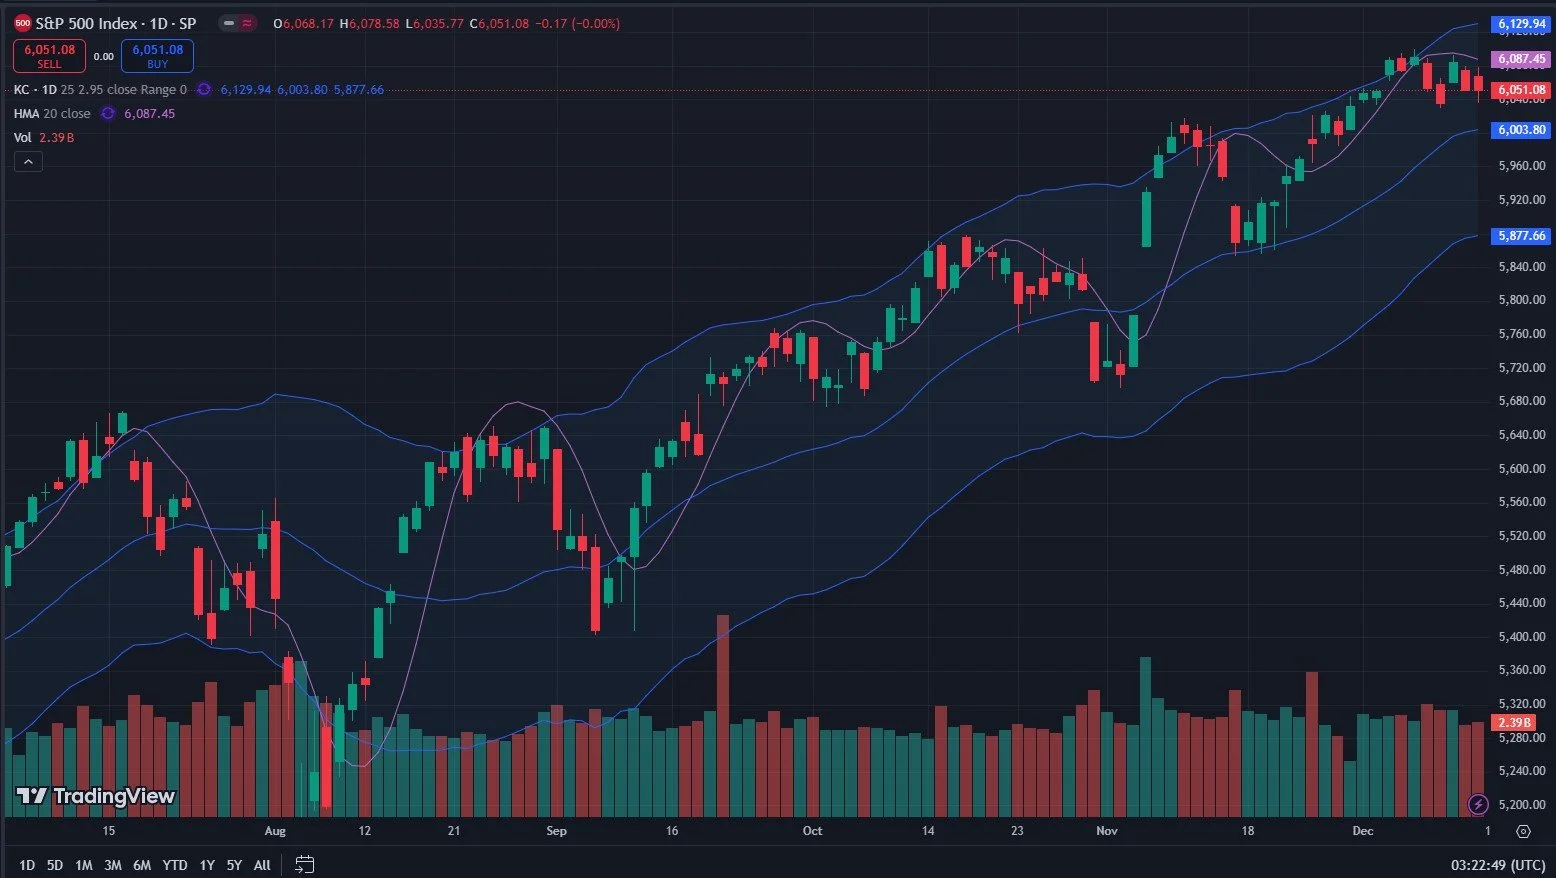
SPX continues to remain in a “gentle” downward consolidation, stuck below the Hull while the Keltners (still bullish) are easing off of the hyper-ascending upward trajectory. This chart appears to be noticeably more bearish than QQQ’s chart, at least strictly in terms of where price has been over the last few days. Is this an opportunity for SPX, with its more negative chart AND GEX picture, to catch up to QQQ on the upside, revisiting 6100-6130? Or is it a warning that QQQ bulls need to step back and take a deep breath?
Despite the negativity, SPX is in the G2 Dealer Cluster where we may see an attempt to reverse the downward move, with 6100 as the primary initial target. We do see good volume at the 6100 strike Friday, as you see below.
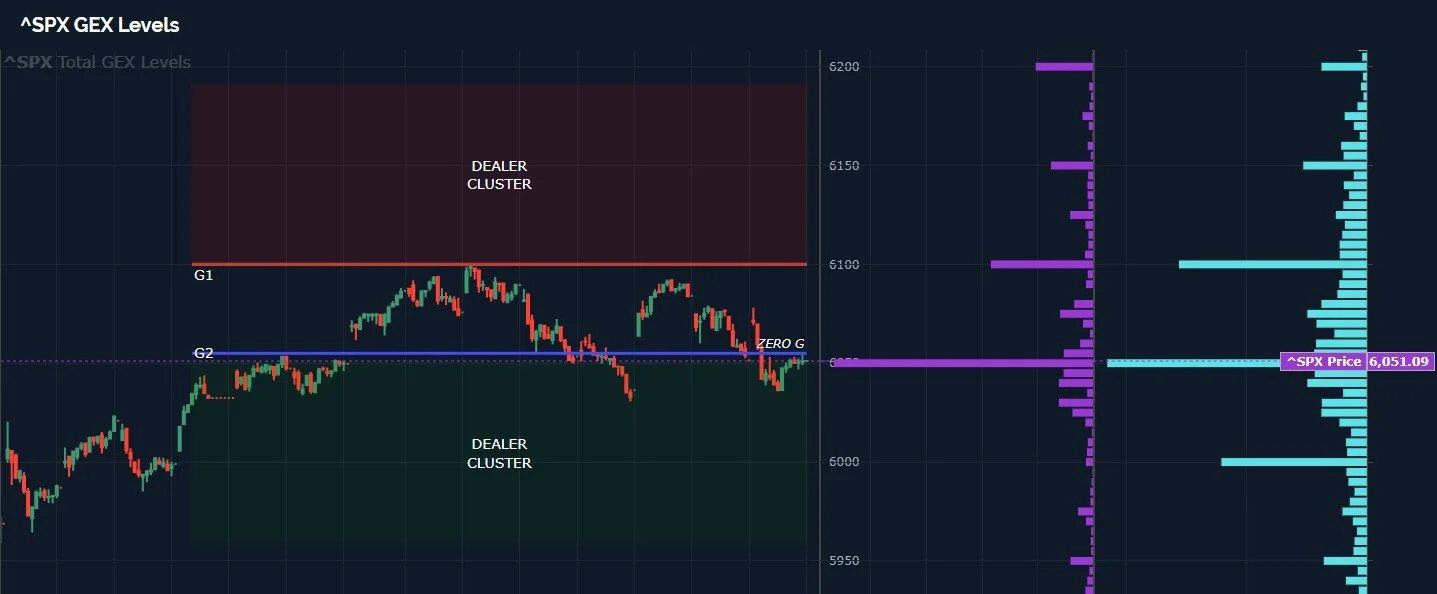
SPX GEX is staying down though, still neutral, but at the lowest level in at least a month. In fact, we don’t see 6200 as a significant cluster anymore, at least not in December.

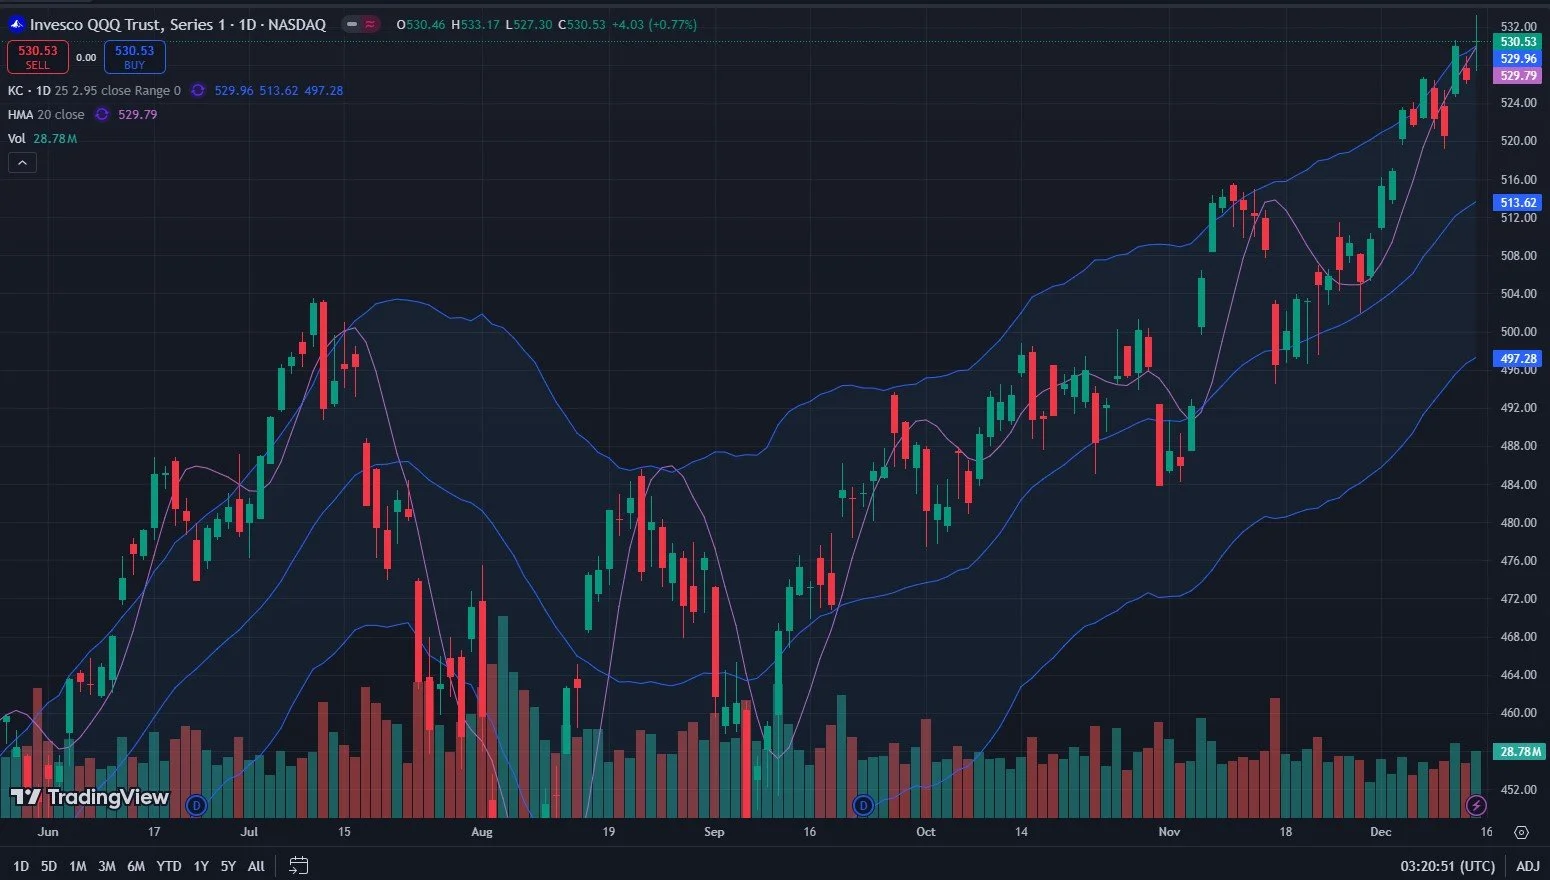
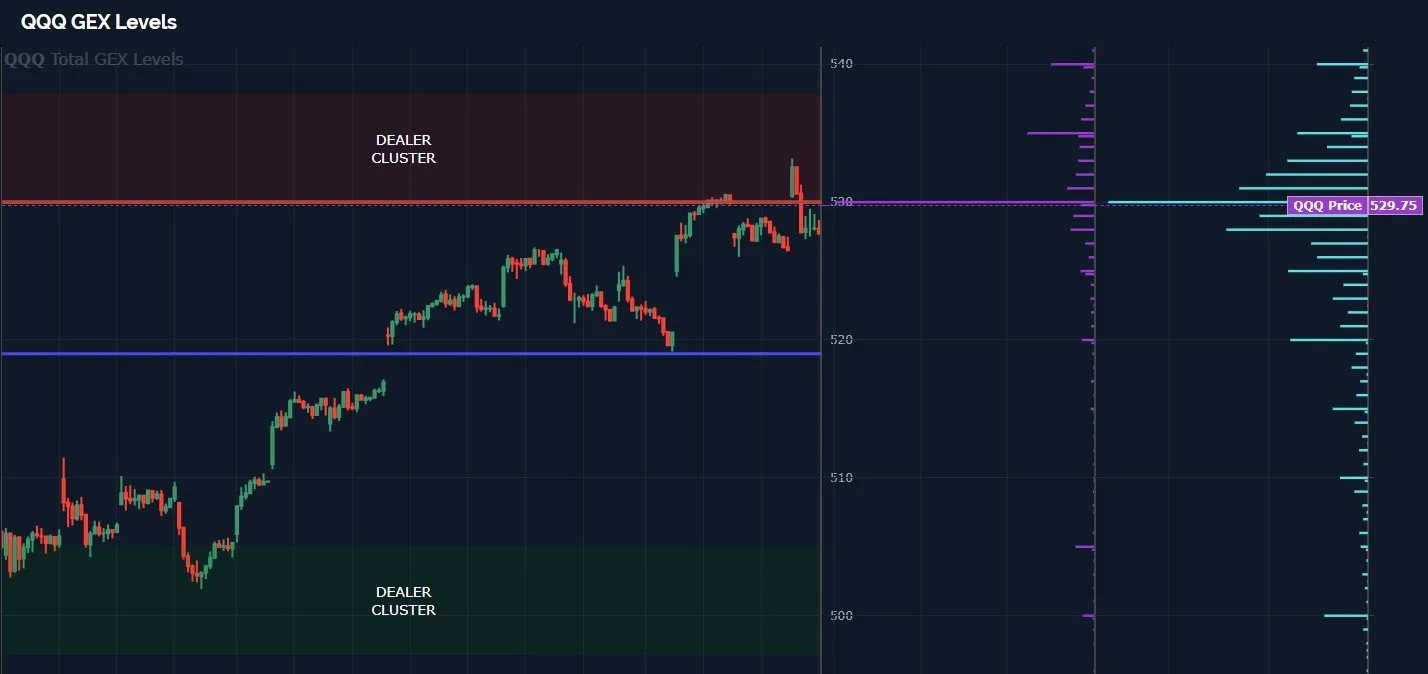
QQQ, in contrast to SPX, made a new all-time high Friday, what a spectacular showing. I will continue to point out that the extreme position above the upper Keltner, with the Hull beginning to overtake QQQ’s price, will be a headwind for QQQ and intraday fades like we saw Friday will not surprise me at all. I would prefer to see 500-513 revisited and then see what the total picture looks like. Friday’s potential reversal candle may also be a red flag. Or wait, a green flag..A green red flag. Yes, that’s it.
QQQ GEX levels aren’t helping the bulls right now. We’re in a G1 Dealer Cluster, where dealers may end up becoming hate sellers, and so far, the box shows rejection (though no follow-through, obviously). We can always climb deeper into the box, but combined with technical factors, I don’t have a lot of confidence in that scenario, at least not without a pullback.
QQQ high GEX readings have corresponded with highs recently, and we’re back at almost 1B positive, while SPX is at a GEX low point. Who’s right?

Tread carefully and join us in Discord as we discuss what we see intraday as new developments emerge. We hope to see you there!
If you’re interested in accessing our tools and analytics, be sure to check out our website.
If you’re interested in learning more about our strategy and approach, we address all of these topics in our Geek University course which is included in all memberships.
We recently posted a YouTube video, and we have many other short videos, so give our channel a look if you’re curious about recent market commentary and ideas as well as gamma (GEX) concepts explained.
Thanks for being part of our community and know that we invite your feedback!
The information provided by Geeks of Finance LLC is for educational purposes only and is not intended to be, nor should be construed as, an offer, recommendation or solicitation to buy or sell any security or instrument or to participate in any transaction or activity. Please view our Investment Adviser Disclaimer and Risk Disclosure.