
Momentum Versus Seasonality: Who Wins?
Thursday, we mentioned AAPL and AMZN as possible long plays, which did fairly well Friday while still leaving potential room overhead to achieve the respective 235 and 190 targets that we highlighted using gamma (GEX) data. As the cash session started Friday, we analyzed opening targets as interpreted from our 0 DTE GEX data for SPY/SPX and QQQ as well, which wasn’t extremely compelling for SPY and SPX as far as a “slam dunk” directional move, but QQQ gave us the 487 target as a solid upside target, which we shared in our free Discord channel late Friday morning with plenty of meat left on the bone. Friday’s close was 487.32.
Today, we look ahead to one of only a few weeks before the 2024 election. We don’t have a ton of economic data early in the week, but we still might see a brief pullback before another attempt higher. We’re watching SPY 560 on the downside, 575-580 on the upside. These shorter-term market moves- even when we discuss upside- are still within the context of a VIX that looks like it’s gearing up for a move and markets generally pulling back from extremely bullish GEX readings. We address the S&P, NVDA, a possible short on NKE, and more in our latest YouTube video we just posted, which you can watch by clicking here.

Looking to the QQQ chart just above, notice how accurate the Hull Moving Average was in marking Friday’s resistance for QQQ, showing the importance of the indicator. Technically, I lean short below the Hull, which means I’ve had a short bias since the day after the recent top, and upside is somewhat limited above the Hull due to the upper Keltner channel, despite our comments in YouTube and in this newsletter about the possibility for some continuation higher. Long versus short is all a matter of time frame, right? A reasonable upside target above 488 would be 496, with 474 QQQ below, which represents the middle Keltner.
We mentioned Friday’s announcement of the 487 level, which we identified using our GEX data graph and you can also see how we identify significant GEX levels using our 3D chart below.
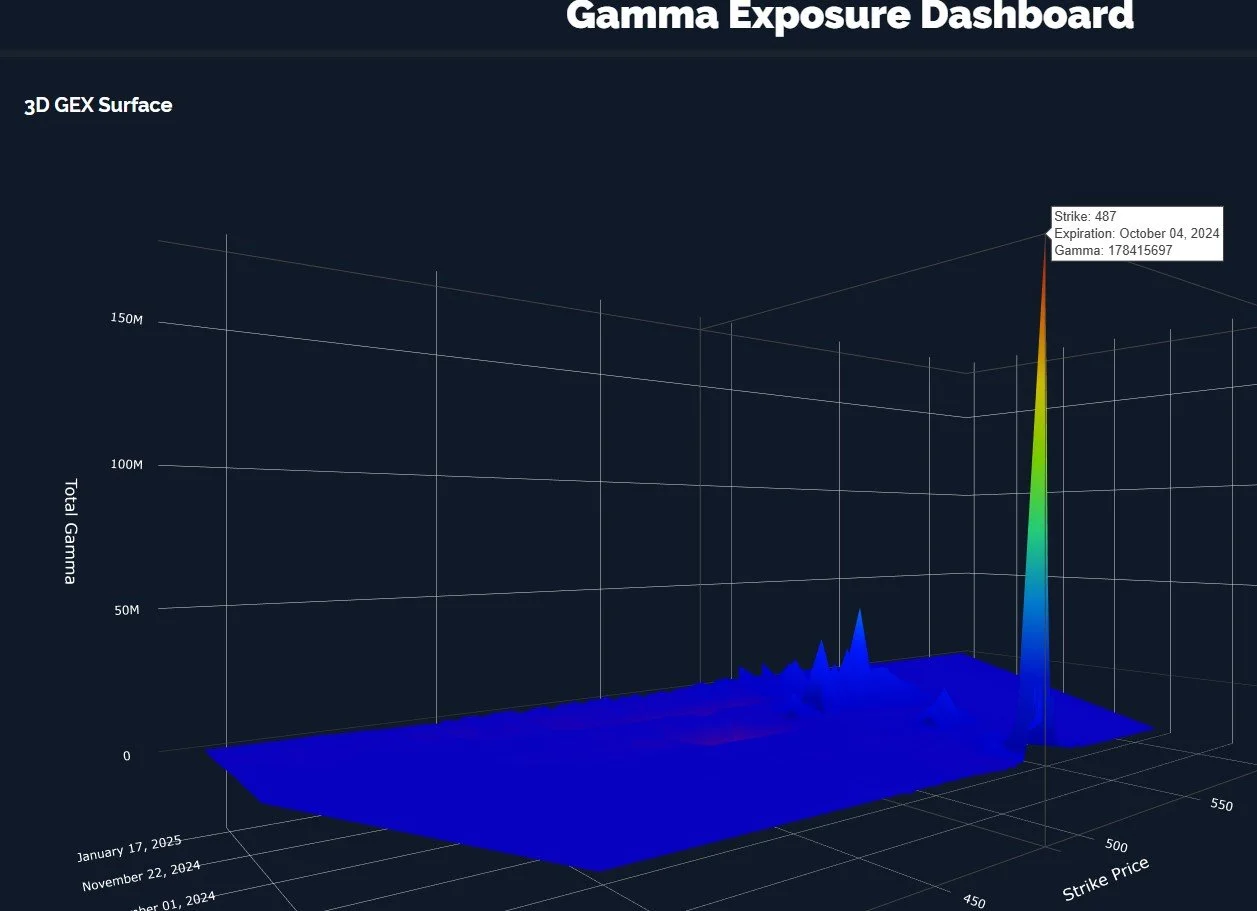
QQQ GEX 3D: www.geeksoffinance.com
Looking at the chart below, you can see that we are in the red Dealer Cluster Zone for QQQ, though that red box does extend upward toward the 495 area, fitting with our upper target. 460-480 may represent support areas below, and we very well may see an early-week pullback after Friday’s move higher off the lows.

QQQ GEX Levels: www.geeksoffinance.com
Another potential canary in the coal mine is NVDA, which you can see on our GEX Levels chart below. NVDA has come off of the lows we highlighted some weeks ago as a potential buying zone (100-108 area) quite strongly, and now 130 seems like a solid target. Volume (daily option volume in light blue) has been higher at those higher strikes as well. Presumably, if NVDA reaches 130, QQQ may find the fuel it needs to reach its higher targets as well.

NVDA GEX Levels: www.geeksoffinance.com
In our YouTube video, we mention NKE as a possible short idea. In addition to the negative total GEX, look at how attempts to move over the middle Keltner channel have failed, and the candle wicks indicate potentially eager sellers above the middle Keltner.

GEX is negative as mentioned, and the graph below shows a noticeable and contrasting amount of GEX at lower strikes.
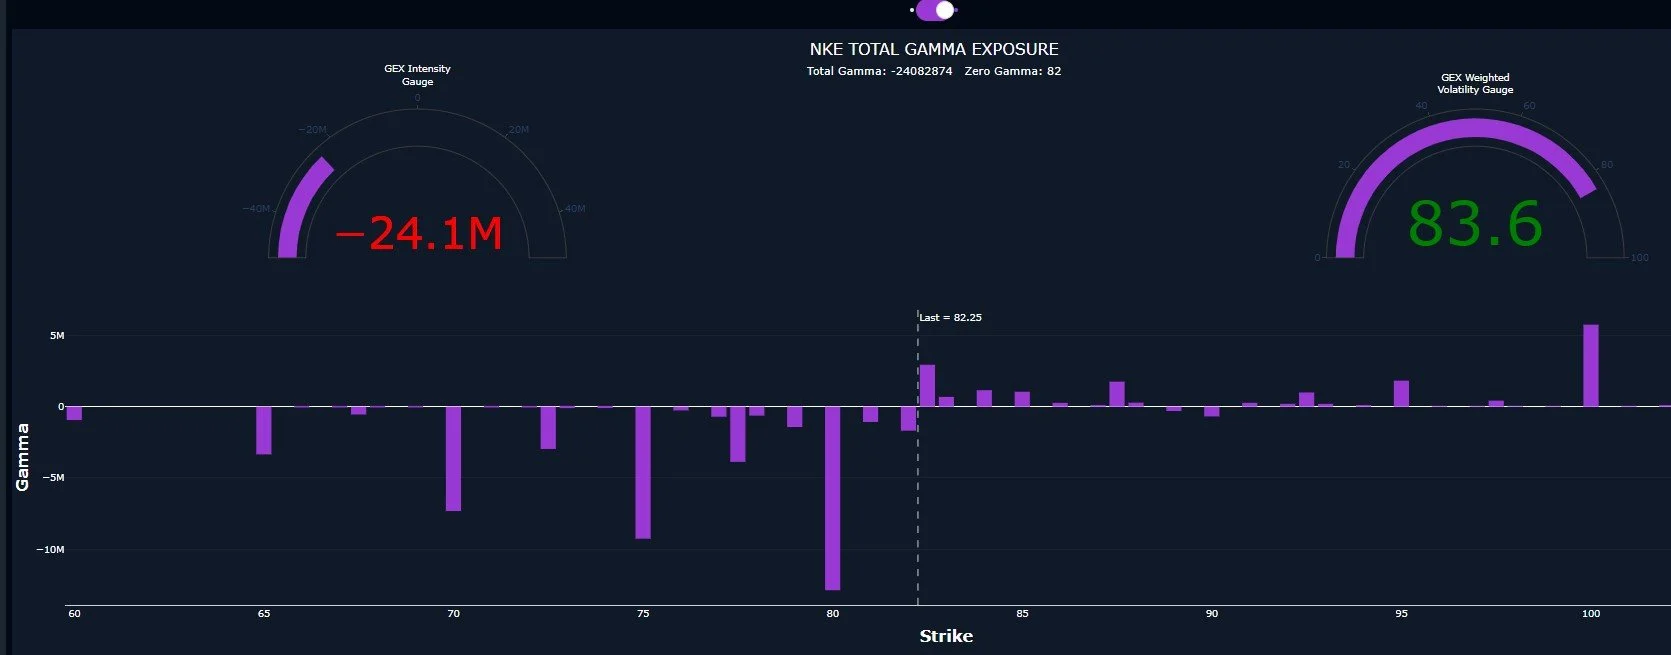
NKE GEX Graph: www.geeksoffinance.com
Our GEX Levels chart below does indicate 80 as a potential support and bounce area, which isn’t far below, but we are likely looking to short whatever bounce may materialize.

NKE GEX Levels: www.geeksoffinance.com
Lastly, to end on a fuzzy, cuddly bearish note (more of a baby panda bear than a full-grown grizzly bear), the VIX appears to mean business, with sharply rising 2-hour Keltners and price holding above the Hull Moving Average. While we believe the market is likely to go higher, we have bearish seasonality generally over the next couple of weeks, and any market pop (and VIX drop) might be reversed in short order. Stay on your toes, trade what’s in front of you, but be mindful of the risks that are just beyond your line of sight.

AMZN GEX Graph: www.geeksoffinance.com
We’ve continued to land big victories intraday using 0 DTE GEX, and we have some great subscribers sharing their success daily, so we hope you’ll join us in Discord. Thanks for reading!
If you’re interested in learning more about our strategy approach, we address all of these topics in our Geek University course which is included in all memberships.
If you’re interested in accessing our tools and analytics, be sure to check out our website!
Thanks for being part of our community and know that we invite your feedback!
We recently posted a YouTube video and we have many short videos for you to review where we cover a variety of predictions and educational topics.
The information provided by Geeks of Finance LLC is for educational purposes only and is not intended to be, nor should be construed as, an offer, recommendation or solicitation to buy or sell any security or instrument or to participate in any transaction or activity. Please view our Investment Adviser Disclaimer and Risk Disclosure.