
Today A Drop Tomorrow A Pop?
To start, we just posted a YouTube video where we discuss SPY, the VIX, and a few stocks we won’t spend time discussing in the newsletter, including JNJ, AMD, CMG, and META. You can give it a quick view by clicking here.
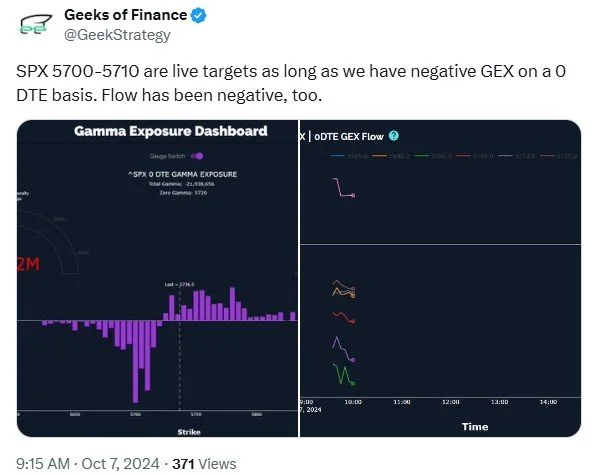
Let’s briefly review what happened in Discord this morning. While QQQ gave us a clear signal Friday to 487, today it was SPX’s turn, with QQQ and SPY not giving quite as clear of a trade, in my subjective view based on gamma (GEX). SPX was staring at us with a 5700-5710 target since this morning, even when SPX was at 5740. In addition to sharing this observation in Discord, and noticing the growing negative GEX all throughout the morning, we also posted it on X:
Looking more big picture, We’re still stuck below the Hull Moving Average, and 567 is an important spot for SPY. To reach that 580 target, we need to hold above the declining Hull line at 572, and 560-562 sits below as an important pivot as well. The Keltner channels are still in an uptrend, though not a steep one.

SPY GEX is back in the dumpster, almost down to -2B. While clearly negative, often times we see SPY act almost as a contrarian signal when GEX gets extreme. Even within a negative trend, we may be close to a temporary rebound. Later on in this newsletter, you’ll see the economic calendar for this week, which is fairly light on data (though we have significant CPI and PPI reports), but apparently all of the banksters at the Fed decided to get their jabber on at the microphone. 7 on Wednesday along with FOMC minutes! Exhausting.
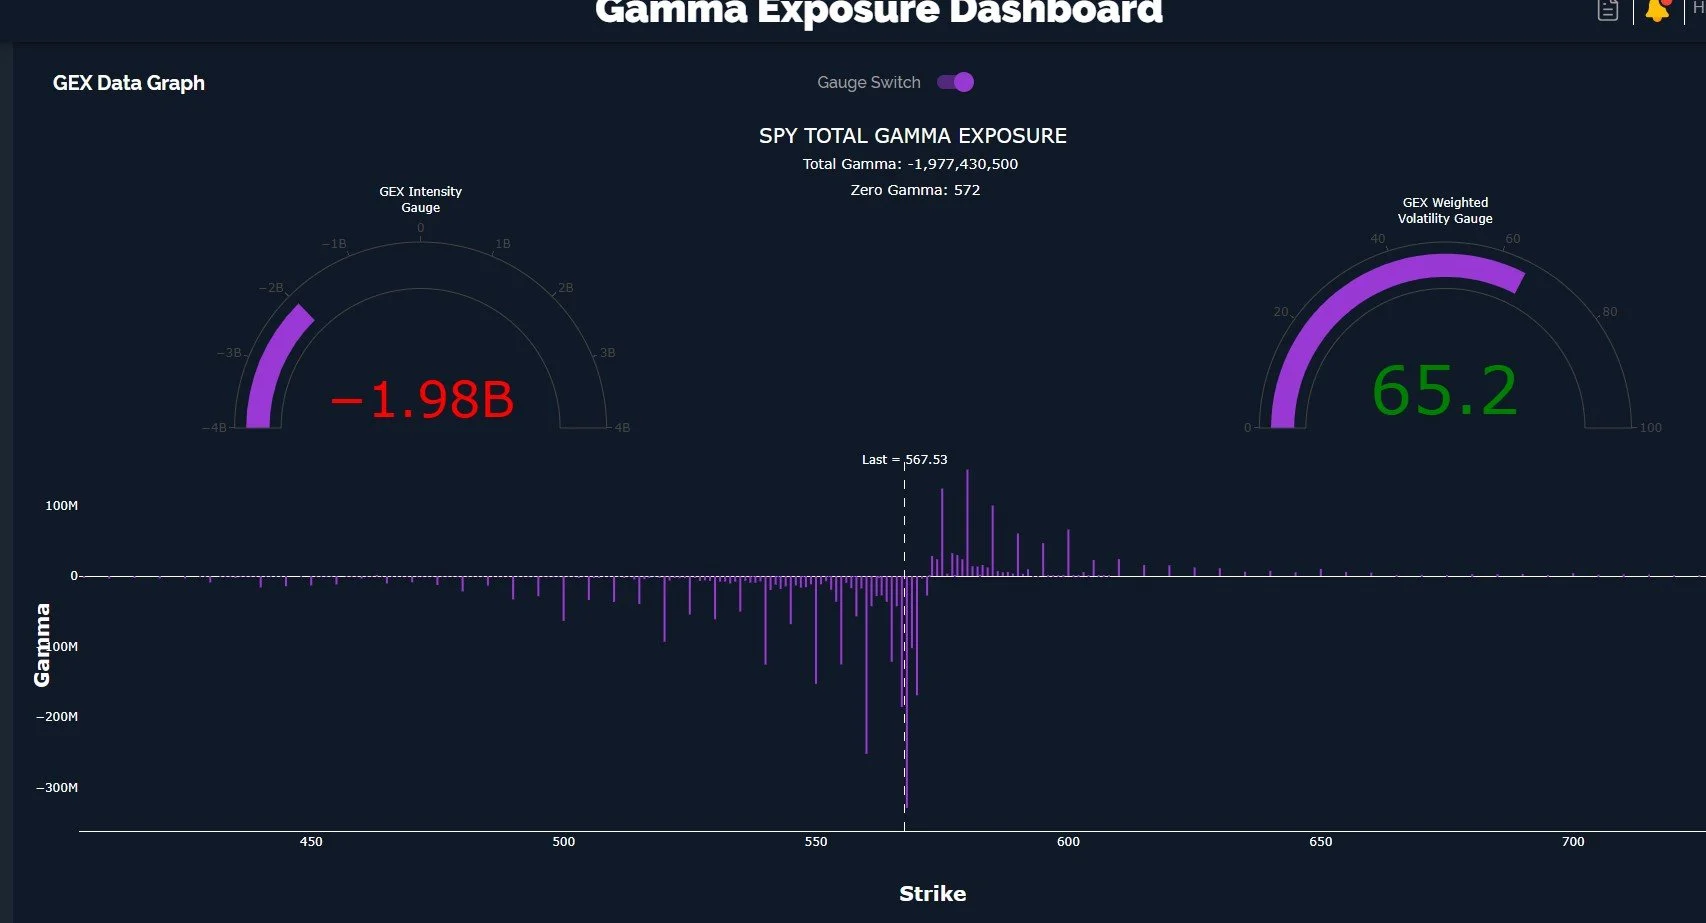
SPY GEX Graph: www.geeksoffinance.com
Looking at the GEX Levels chart below, SPY is now in a Dealer Cluster Zone, with 560 not far away, also within the confines of the green box. Holding this area may see a rebound attempt, assuming GEX doesn’t shift dramatically negative.

SPY GEX Levels: www.geeksoffinance.com
SPY reaching -1.88B GEX represents the most negative reading over the last month, and the GEX Intensity Gauge shown earlier indicates it’s possible it might get more negative before it’s at a 52-week extreme.
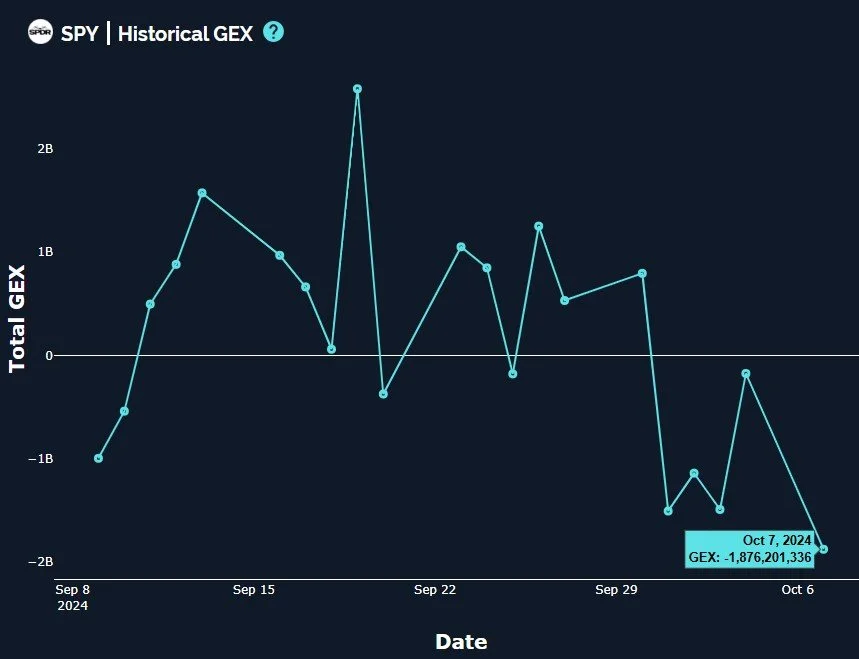
SPY Historical GEX: www.geeksoffinance.com
While SPY and SPX prices follow similar pathways, GEX can be vastly different. Look at the chart below, showing SPX total GEX barely back to the zero line after today, a far less dramatic move back to neutral despite the considerable reduction in positive GEX. Is SPY the canary in the coal mine, or is SPX telling us things really aren’t “that bad?”

SPX Historical GEX: www.geeksoffinance.com
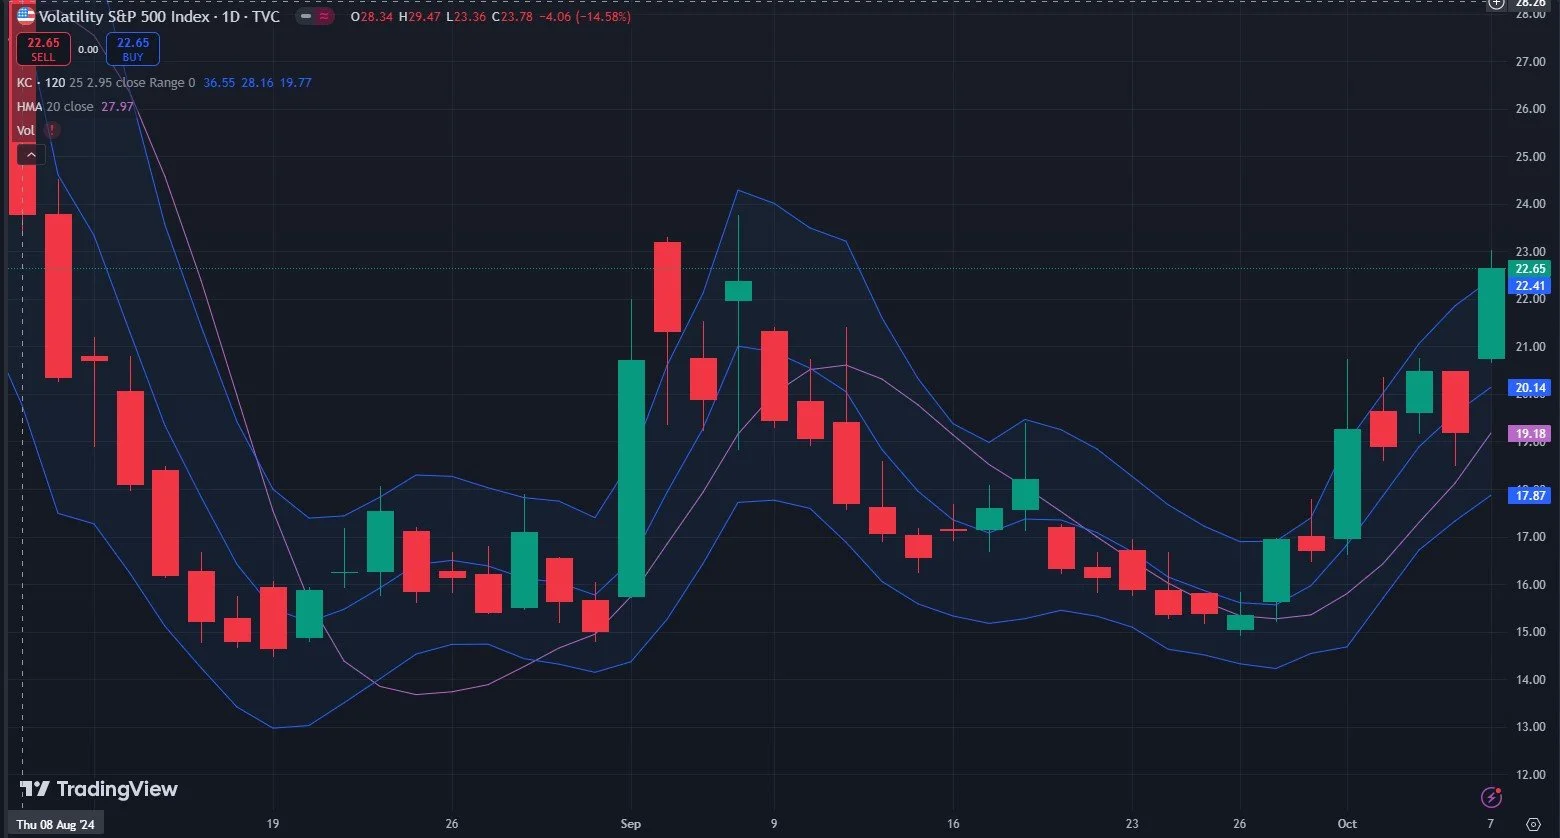
The VIX remains concerning for bulls, with the 2-hour Keltners in a steep uptrend and the VIX holding above the Hull since September 26. That said, being at the top of the channel is usually not a sustainable condition, so you see the wicks back down after touching it or sometimes a pullback in volatility for a day or two after. So at a minimum, barring a mega spike similar to August, we should see 19-20 at a minimum, which may imply a day or two of market relief as well (a bounce higher for stocks). We shall see.
Here’s the economic calendar with a few bond auctions and CPI/PPI later in the week, as well as consumer sentiment. The Fed speakers are really busy this week, as mentioned earlier. From a market perspective, this presents possible headline risk at any given moment during their speeches, which is impossible to predict. We will continue focusing on GEX targets as indicated by our GEX tools on the website, and discussing these observations with our colleagues in Discord. We hope you’ll join us!
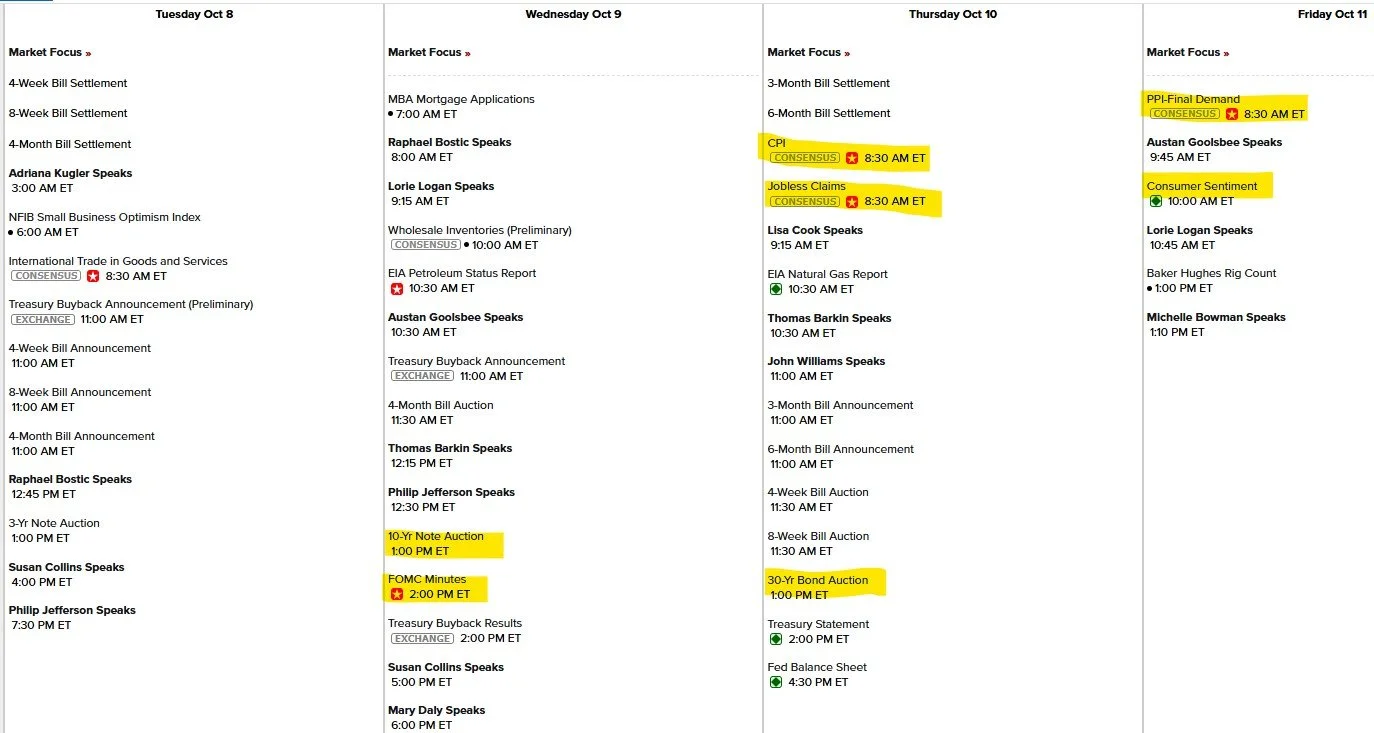
Econoday.com
If you’re interested in learning more about our strategy approach, we address all of these topics in our Geek University course which is included in all memberships.
If you’re interested in accessing our tools and analytics, be sure to check out our website!
Thanks for being part of our community and know that we invite your feedback!
We recently posted a YouTube video and we have many short videos for you to review where we cover a variety of predictions and educational topics.
The information provided by Geeks of Finance LLC is for educational purposes only and is not intended to be, nor should be construed as, an offer, recommendation or solicitation to buy or sell any security or instrument or to participate in any transaction or activity. Please view our Investment Adviser Disclaimer and Risk Disclosure.