
Foolish Hedging Or A Sign Of Impending Doom?
End Of Summer Subscription Discount! Enter code SEPTEMBER2024 at checkout to receive a big $300 discount on our annual Portfolio Manager-tier subscription! Get access to ALL of our tickers, engage in our chat group with experienced traders, get access to our 5-hour educational course, and also our Trade Ideas channel for our Educational Portfolio! End Q3 with a pledge to give yourself a gamma edge heading into the New Year with the best GEX platform on the market! Promo Ends Friday.
The VIX rose to a high of 20.75 today, 0.02 higher than Tuesday’s high. The 2-hour Keltner channels are in a sharp ascending formation…Yikes! Bulls should take note that sometimes the VIX can precede market pullbacks in its move higher. We will watch for gamma (GEX) to show some repositioning to higher targets, if the VIX is going to obey historical election year seasonality with a spike in volatility in October. We address the VIX and most of the tickers touched on here in our latest YouTube video we just posted, which you can watch by clicking here.

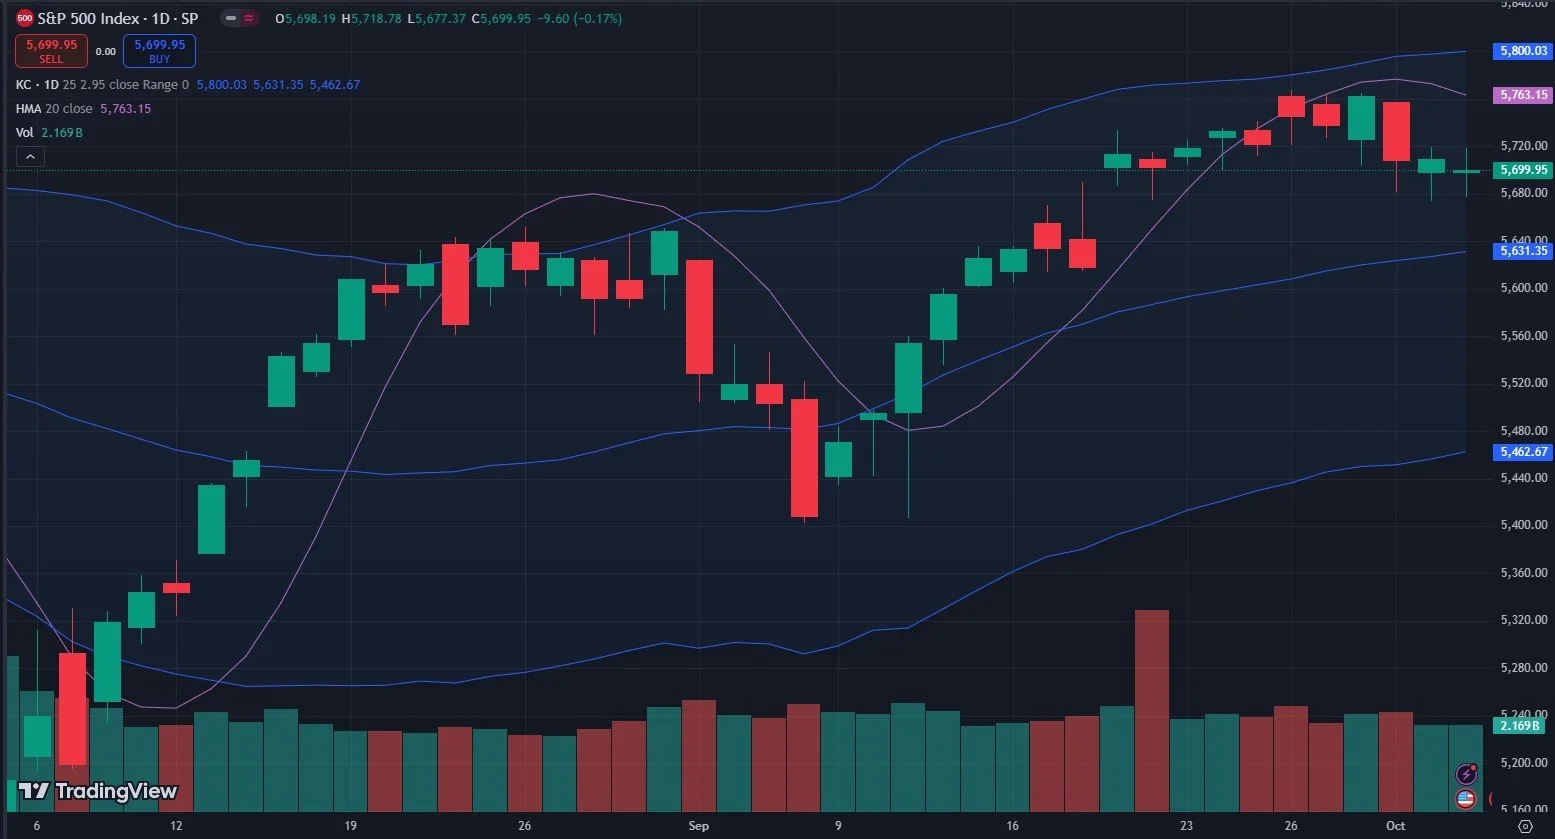
Does SPX give us any sort of signal to act upon at the moment? The chart is in a slight uptrend, but recent price action has been corrective, and we are still below the Hull Moving Average, which I consider to be bearish. Given that it’s the first week of the month, and tomorrow is Friday, I’d prefer to see some attempt higher, even if we close lower. 5763 would be a good retest of support turned resistance. If this one of several scenarios plays out, perhaps the VIX will have another corrective pullback in its newly established uptrend. I find it noteworthy that the VIX is stair-stepping higher without a major spike yet. I would expect a larger spike to occur before the correction is truly “done.”
Our SPX GEX Levels chart actually shifted a little higher, now showing that we are in a G2 cluster zone with 5800 as the G1 zone where we expect resistance and potentially selling.
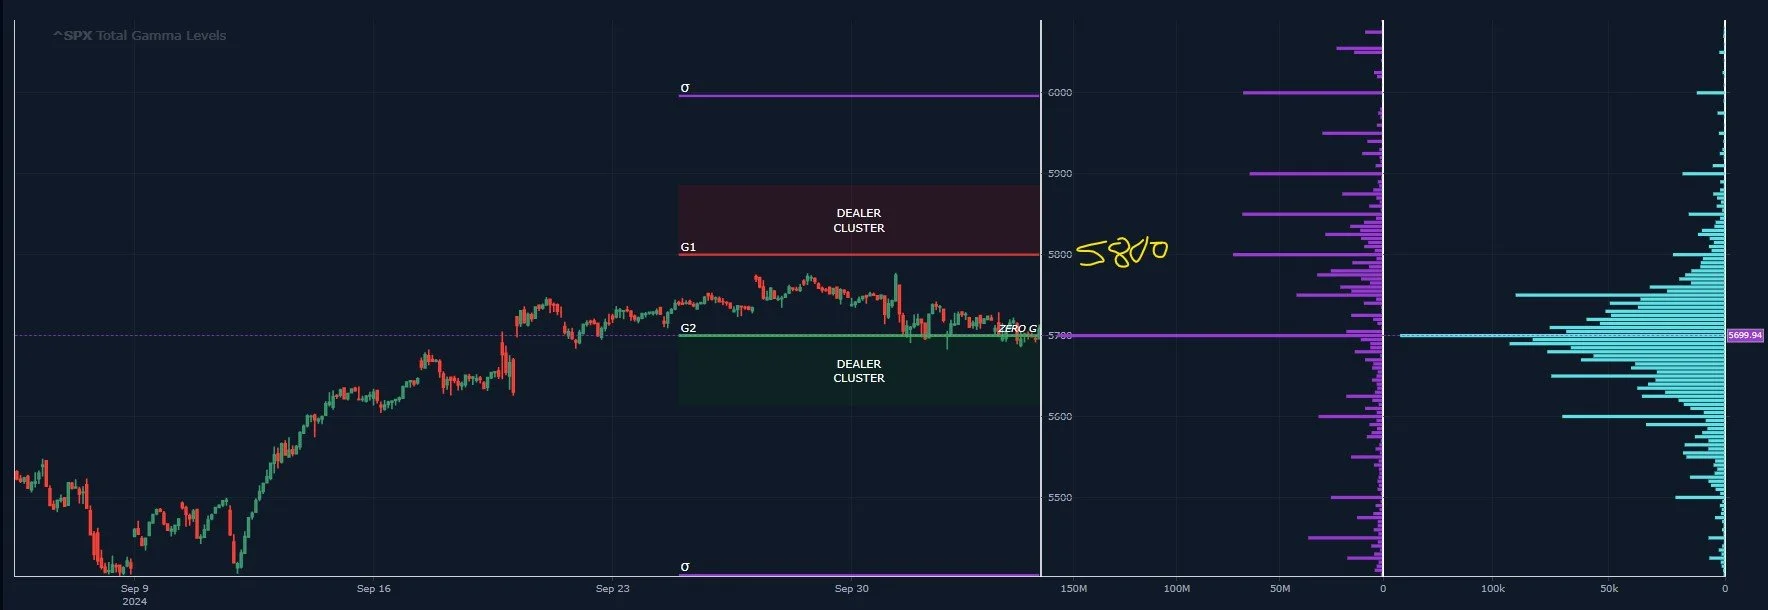
SPX GEX Levels: www.geeksoffinance.com
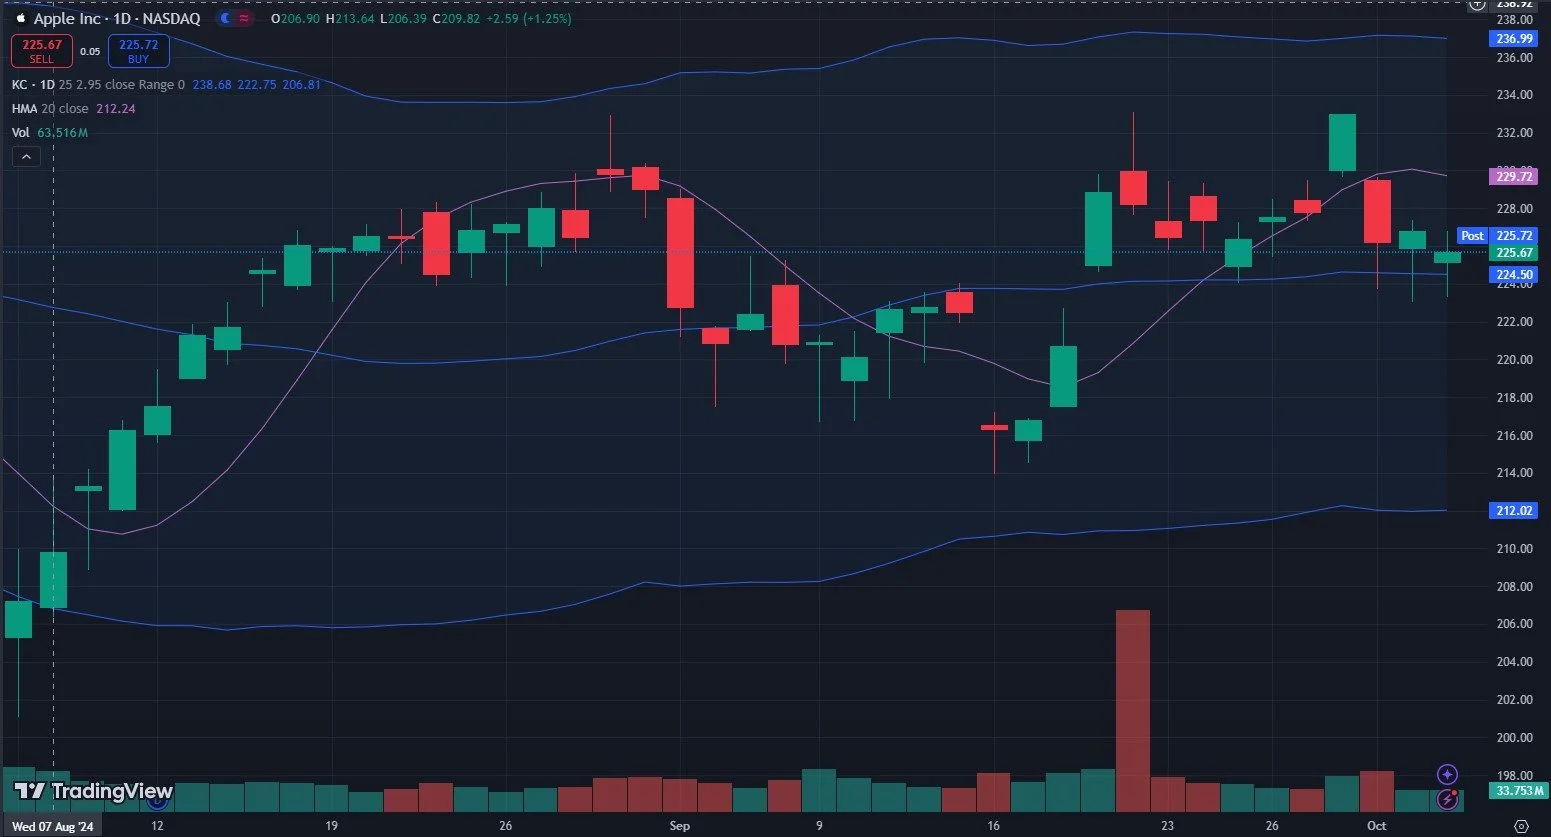
With 80% overlap of the top holdings in both the S&P and QQQ, we looked at the Magnificent Seven to see which of those top holdings might be the best candidates for a bounce higher, which led to AAPL and AMZN. Looking at AAPL’s chart, price is holding the middle Keltner channel despite being below the Hull. 237 seems possible if AAPL can get past 230. The alternative is a drop down to 212.
AAPL’s GEX picture backs a more positive short-term view, with positive total GEX, price almost in a Dealer Cluster Zone, and large GEX clusters at 230-240.
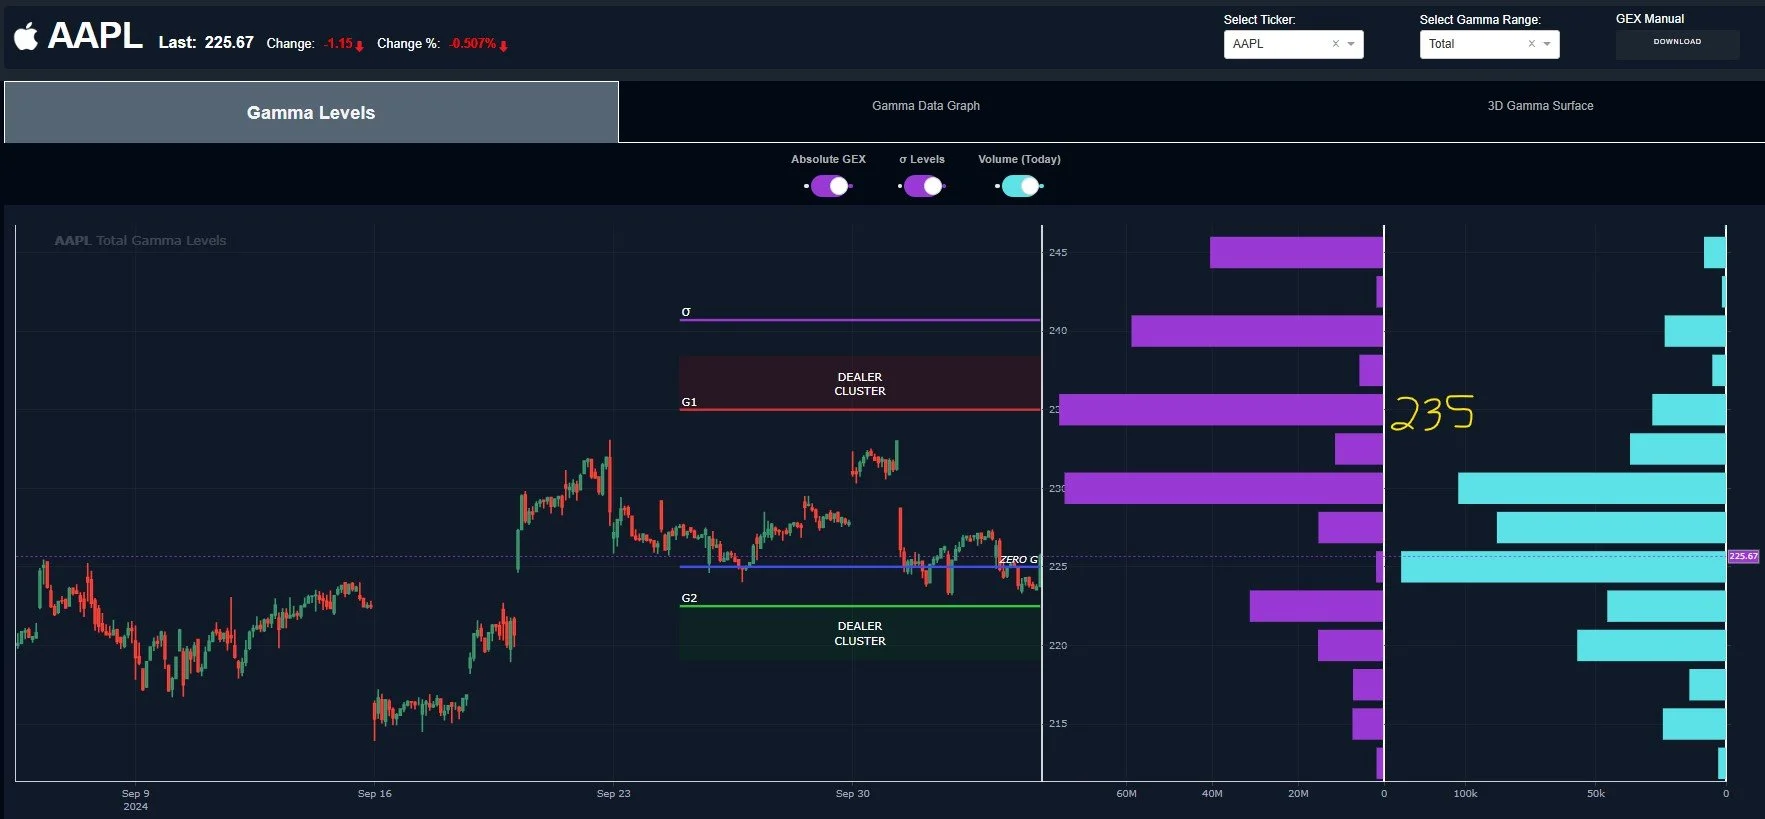
AAPL GEX Levels: www.geeksoffinance.com
With positive GEX, very little interest in lower levels, and several large untapped GEX clusters overhead, seems like AAPL might be a name that assists in holding up the indices a bit longer.
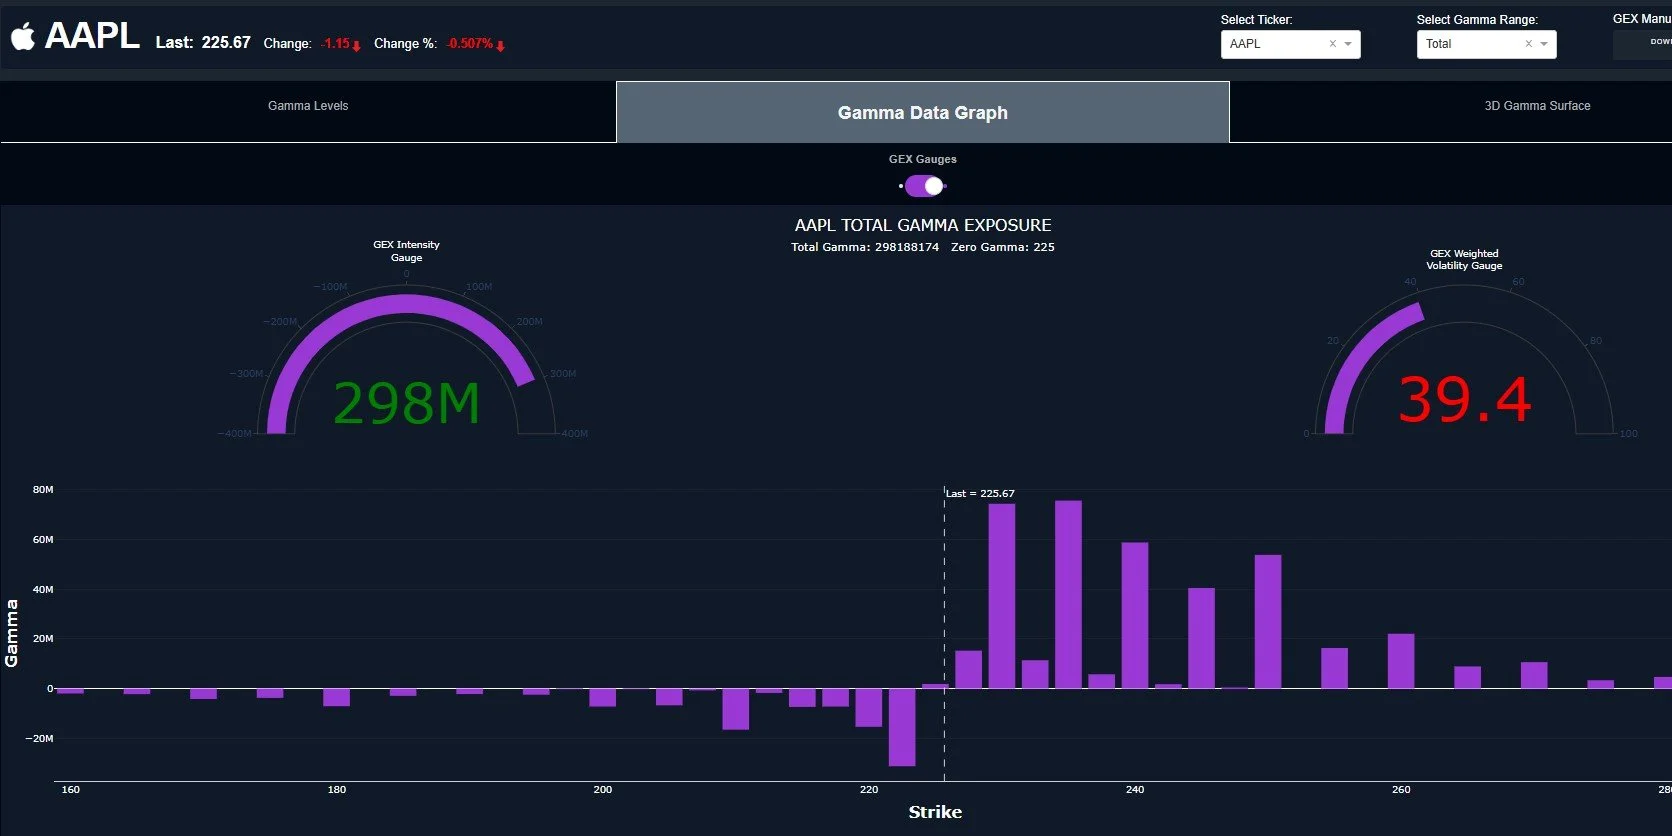
AAPL GEX Graph: www.geeksoffinance.com
AMZN’s chart looks more bullish than AAPL’s, with an ascending Keltner channel and a stairstep drop down to just below the middle Keltner.

AMZN shows total GEX being positive, with room to get more positive, in contrast to the negative price movement lately. As long as total GEX is positive, we err toward more bullish probabilities.
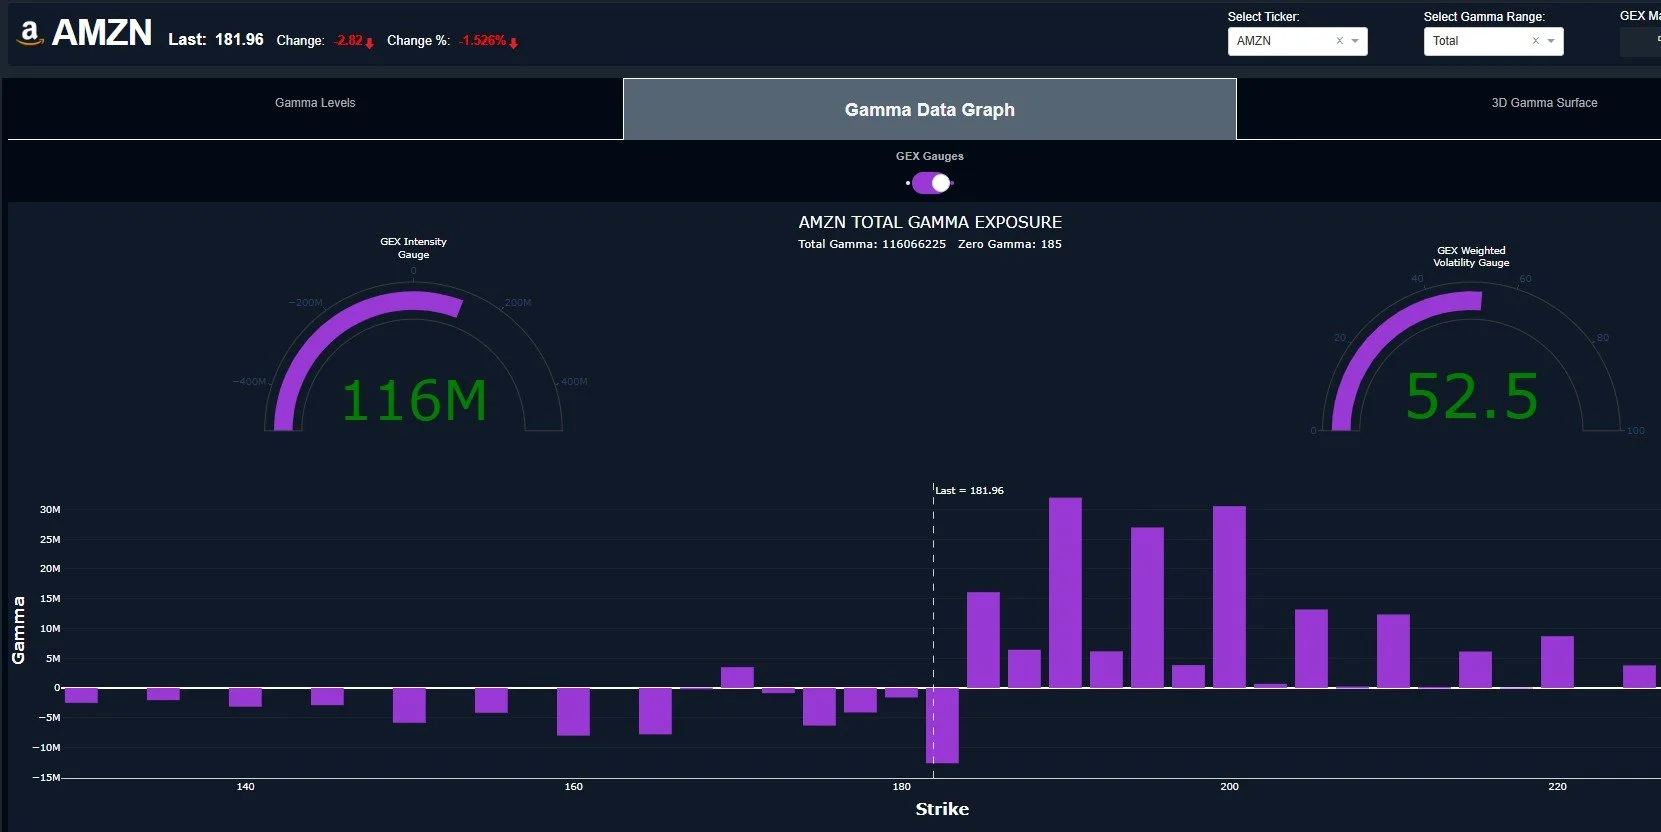
AMZN GEX Graph: www.geeksoffinance.com
AMZN has dropped right into a Dealer Cluster Zone, with volume at higher strikes and significant GEX at 190-200. I wouldn’t want to short this chart or GEX setup, as bearish as I feel in my lower back and neck. Wait, maybe that’s just me getting older anyway..
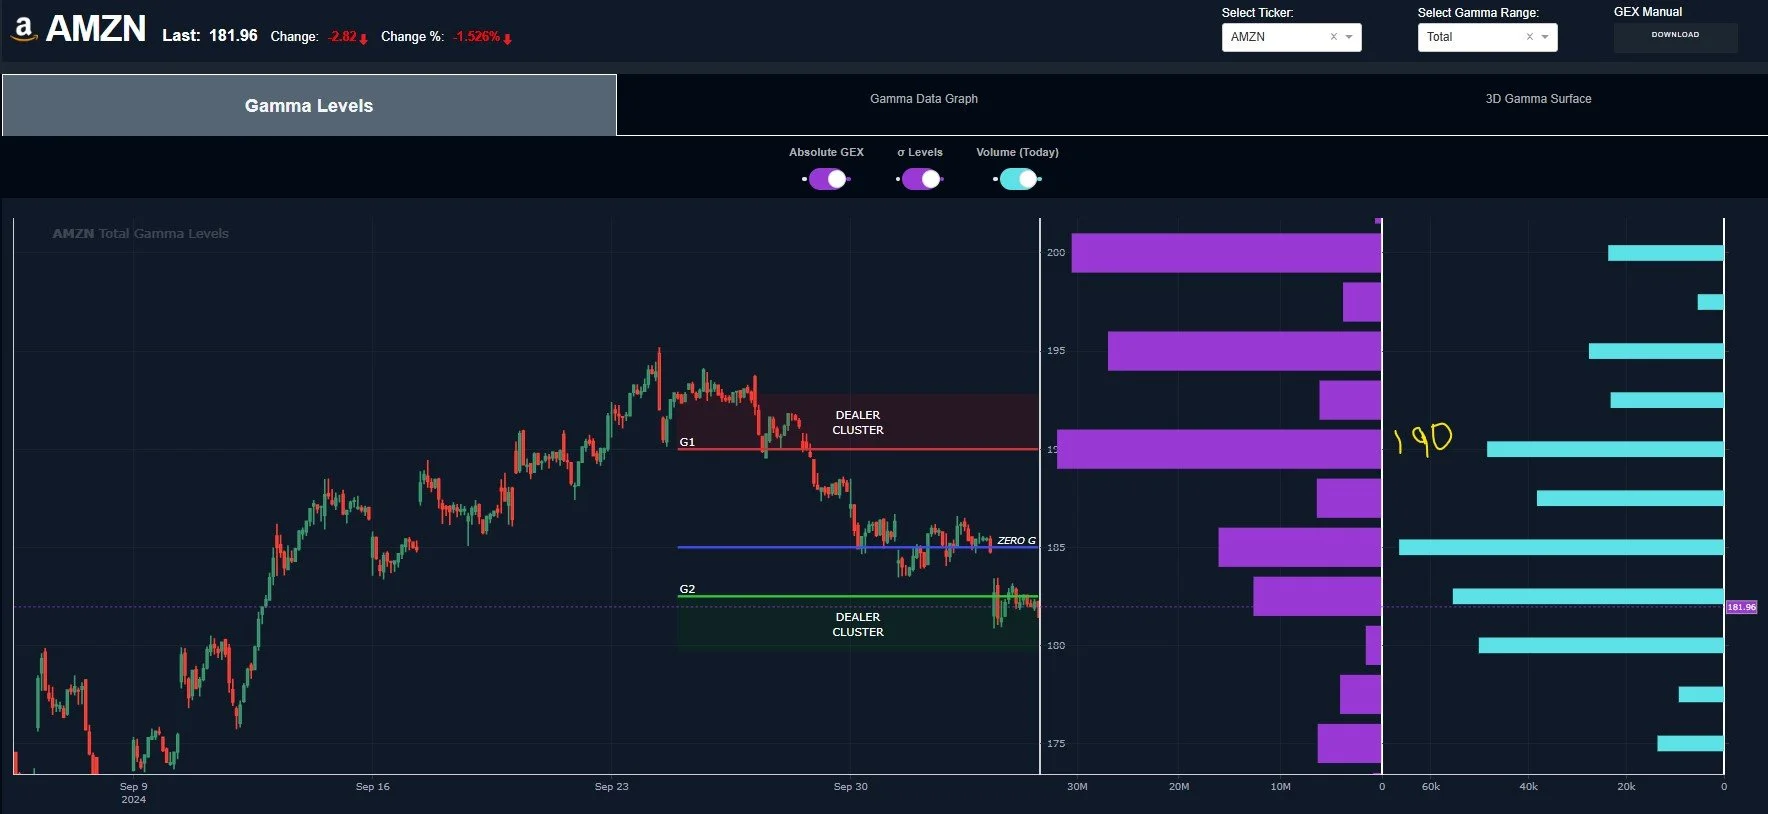
AMZN GEX Levels: www.geeksoffinance.com
AMZN’s 3D chart shows the largest negative GEX cluster expiring tomorrow, which should be interesting in terms of how AMZN’s GEX shifts next week. As it currently stands, tomorrow’s expiry will leave a lot of positive clusters between those upper levels shown on the GEX level charts above.
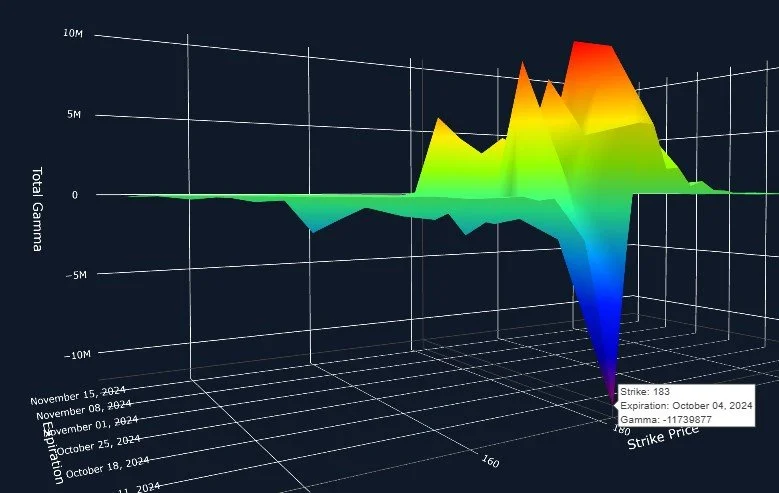
AMZN 3D GEX Graph: www.geeksoffinance.com
All things considered, we have bearish seasonality for the next few weeks, a rising VIX, a market recently declining, and potential inflationary pressures looming. But we have identified at least a number of counterpoints including AMZN and AAPL as examples of possible reasons even a seasonal decline may not be as straight forward and easy as a momentum trader would prefer.
With asymmetric positioning of your trades, there’s no reason you can’t have bullish AND bearish positions and ensure that your winner does better than the losing side. Or maybe you’re really a genius and you’ll make money on both (it happens sometimes). We’ve continued to land big victories intraday using 0 DTE GEX, as demonstrated by today’s 5680 call as early as 9:30 this morning, so we hope you’ll join us in Discord where we share what we’re seeing. Thanks for reading!
If you’re interested in learning more about our strategy approach, we address all of these topics in our Geek University course which is included in all memberships.
If you’re interested in accessing our tools and analytics, be sure to check out our website!
Thanks for being part of our community and know that we invite your feedback!
We recently posted a YouTube video and we have many short videos for you to review where we cover a variety of predictions and educational topics.
The information provided by Geeks of Finance LLC is for educational purposes only and is not intended to be, nor should be construed as, an offer, recommendation or solicitation to buy or sell any security or instrument or to participate in any transaction or activity. Please view our Investment Adviser Disclaimer and Risk Disclosure.