
Here’s The Bounce
End Of Summer Subscription Discount! Enter code SEPTEMBER2024 at checkout to receive a big $300 discount on our annual Portfolio Manager-tier subscription! Get access to ALL of our tickers, engage in our chat group with experienced traders, get access to our 5-hour educational course, and also our Trade Ideas channel for our Educational Portfolio! End Q3 with a pledge to give yourself a gamma edge heading into the New Year with the best GEX platform on the market! Promo Ends Friday.
I wouldn’t call today’s rebound attempt one to write home about, but nonetheless, we got what we were looking for: Early weakness that materialized into a bounce, with the VIX dropping further and indices bouncing. Smells a little bit like victory.
We can really see the market go either way here, though with Friday approaching, my contrarian tendencies would prefer a bigger bounce tomorrow, then perhaps weakness next week. No need to take a trade based on guessing, we’ve had ample opportunities to line up our horses in the morning after seeing what GEX indicates as the highest probability pathway, one day at a time.
SPX can rise as high as the Hull Moving Average and I will still be looking on the short side, though we have to acknowledge the Keltners remain in a bullish channel, creating higher lows and higher highs as far as the Keltner boundaries are concerned.

SPX GEX is still positive, though technically within the neutral range, despite SPY being firmly negative at -1.1B. I tend to give SPX more credit, until proven wrong with the way such a difference unfolds going forward.
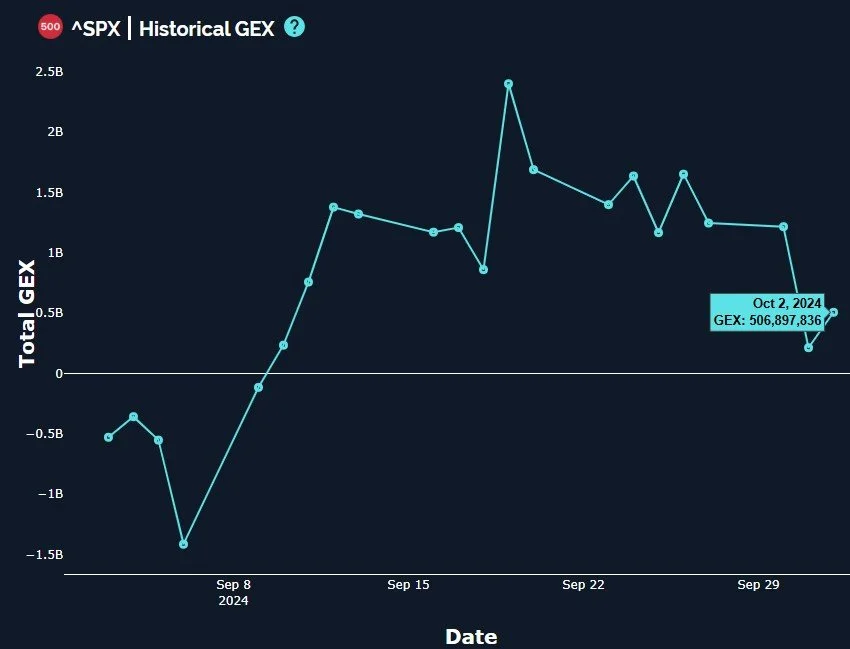
SPX Historical GEX: www.geeksoffinance.com
Our SPX GEX Levels chart shows that SPX is in a Dealer Cluster Zone, though we can stretch all the way up to 5800 and still be within the expected boundaries. 5400 sits on the downside and we saw unusual volume at 5000, though I wouldn’t personally draw any actionable conclusions from that.
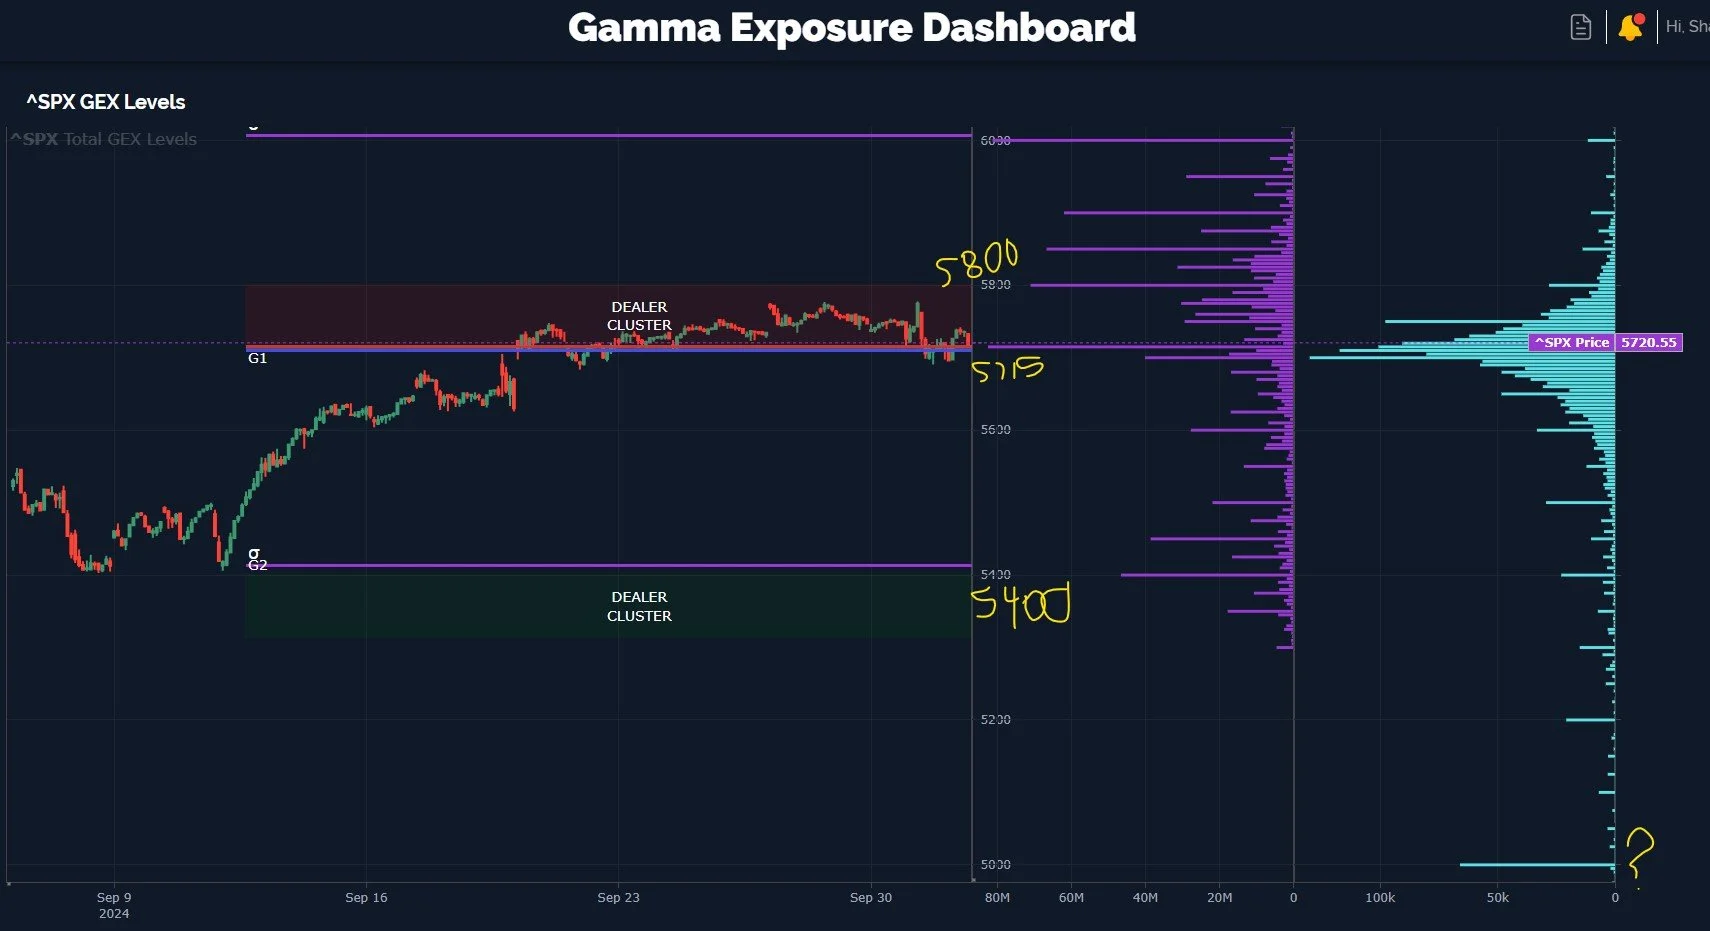
SPX GEX Levels: www.geeksoffinance.com
We’re going to end tonight’s newsletter with a sort of “lightning round” look at two tickers: TSLA and SMH. Let’s start with TSLA:
Sizable gap down on delivery news this morning
Keltners look bullish, though we didn’t quite reach the middle channel, so we’re sort of in “no man’s land” as far as the Keltners go
Below the Hull, so we are biased short, though cross-currents exist due to positive GEX and big GEX at 260 and even 300.

We see a big GEX cluster at 260 for Oct. 11, which would be my target for a long trade. This would mean I’m not counting on breaking above the Hull, I am simply looking for a move back up to retest that area, whether we see it reject or not after that attempt.
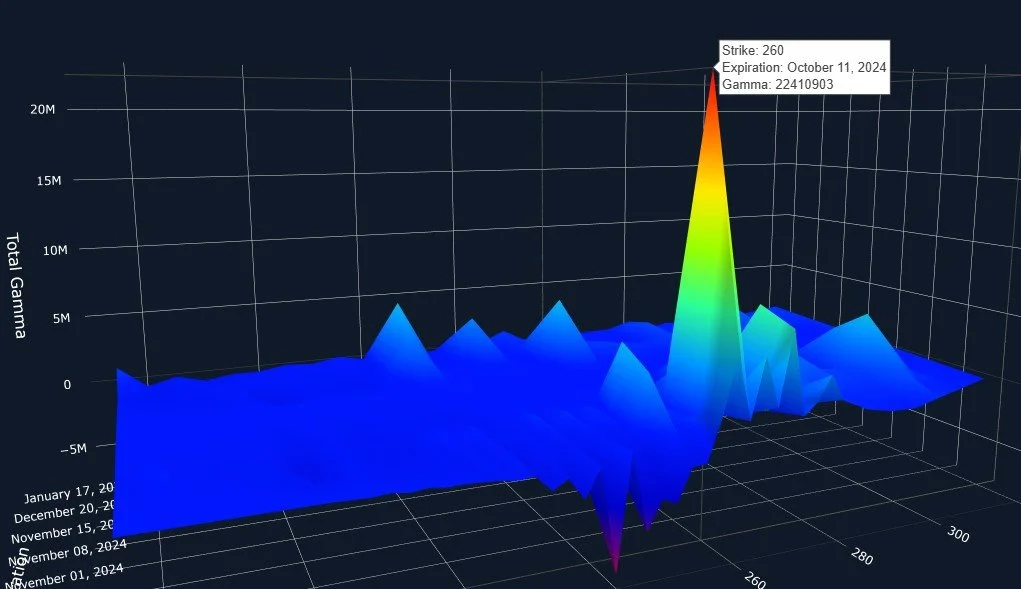
TSLA 3D GEX Graph: www.geeksoffinance.com
SMH: The chart looks neutral overall, we are consolidating in a wide range since August. We currently sit below the Hull but above the middle Keltner, though my speculative interpretation is that odds are good for a push higher.

Our 3D GEX graph shows 255 as a fairly significant GEX cluster for Oct. 18 (the largest one for this Friday is at 243). 255 also coincides with the upper Keltner channel, a logical target if we start moving higher.
We’re watching several other tickers, so check in with us in Discord to see how we decide to play certain trade ideas for our Educational Portfolio. Thanks for reading!
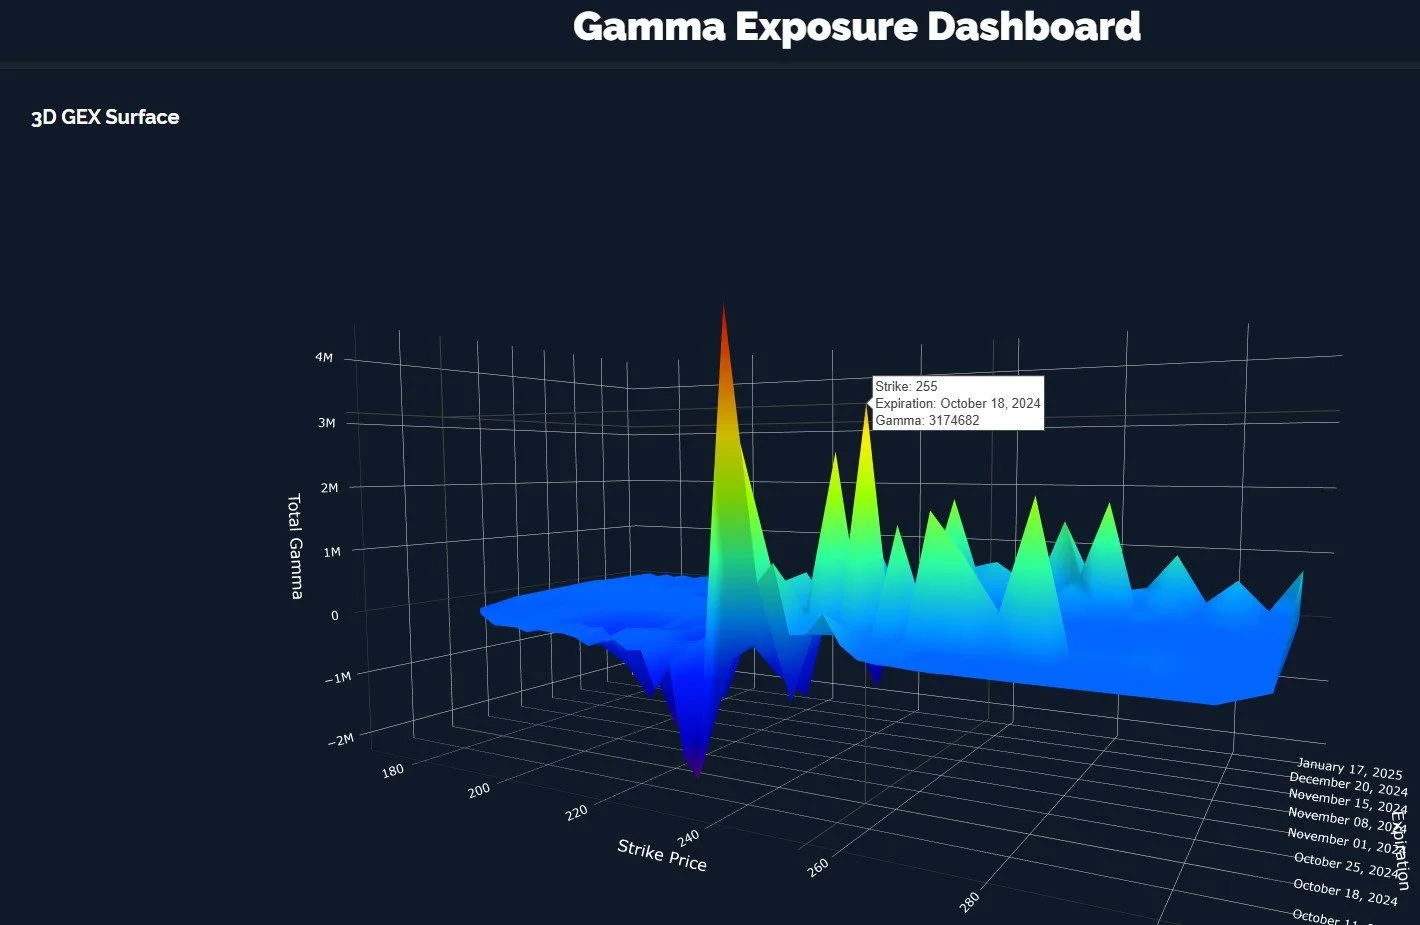
SMH 3D GEX graph: www.geeksoffinance.com
If you’re interested in learning more about our strategy approach, we address all of these topics in our Geek University course which is included in all memberships.
If you’re interested in accessing our tools and analytics, be sure to check out our website!
Thanks for being part of our community and know that we invite your feedback!
We recently posted a YouTube video and we have many short videos for you to review where we cover a variety of predictions and educational topics.
The information provided by Geeks of Finance LLC is for educational purposes only and is not intended to be, nor should be construed as, an offer, recommendation or solicitation to buy or sell any security or instrument or to participate in any transaction or activity. Please view our Investment Adviser Disclaimer and Risk Disclosure.