
Cracks Emerge…Pre-Earnings?
We identified the bearish signal generated by a close below the Hull Moving Average a few days ago, then pointed to SPX 5760+/- as a likely first destination, as long as the Hull continued holding as resistance. Now that we reached the potential bounce area, we’re dealing with a number of possibilities that the market may choose as we look ahead. I thought today’s rebound was weaker than I’d like to see, which leaves plenty of questions as to whether or not this sell off is ultimately done or not. we discuss the market as well as some defensive and precious metals ideas in a new video we just posted on YouTube, which you can view here.
Looking at QQQ, we see a candle with a long tail due to the late day rally, but I notice the price wasn’t able to retake yesterday’s high, and we are basically sandwiched between the middle Keltner channel and the Hull above. The Keltner channel itself looks bullish, but every other aspect of the chart is either indecisive or tilts slightly bearish. With the range between the Keltner and the Hull being barely over 1%, I would rather see which side breaks, with a long bias over 495 and a short bias below 489. Everything in between looks like trying to play catch in the middle of a busy highway.

5900 SPX has been annoyingly elusive for bulls, and price continues meandering along the red G1 Dealer Cluster Zone.

SPX GEX Levels: www.geeksoffinance.com
SPX GEX briefly went negative at yesterday’s close, but then today we closed in the positive again. The “big picture” from our view is that anything between +1B and -1B is neutral, which is yet another factor adding to the sense of indecision permeating the air. sniffs intently- wait, is that bear musk I smell?

SPX GEX Graph: www.geeksoffinance.com
Since mid-last week, we noted the relatively large 5900 GEX cluster concentrated at 10/25. This correctly gave us pause in expecting 5900 last Friday (thank you GEX), but our data gave us the impression 5900 was more likely by this Friday, at least in comparison. Well say hello the S&P Houdini, 5900 is gone. Poof! 5850 is now the biggest positive strike I see on 10/25 expiry. GEX clusters have moved lower despite today’s positive total GEX reading, and some of the higher strikes are much further out, as in late November and December. Clear the bullish deck for the election, I guess? I won’t jump to any conclusions.
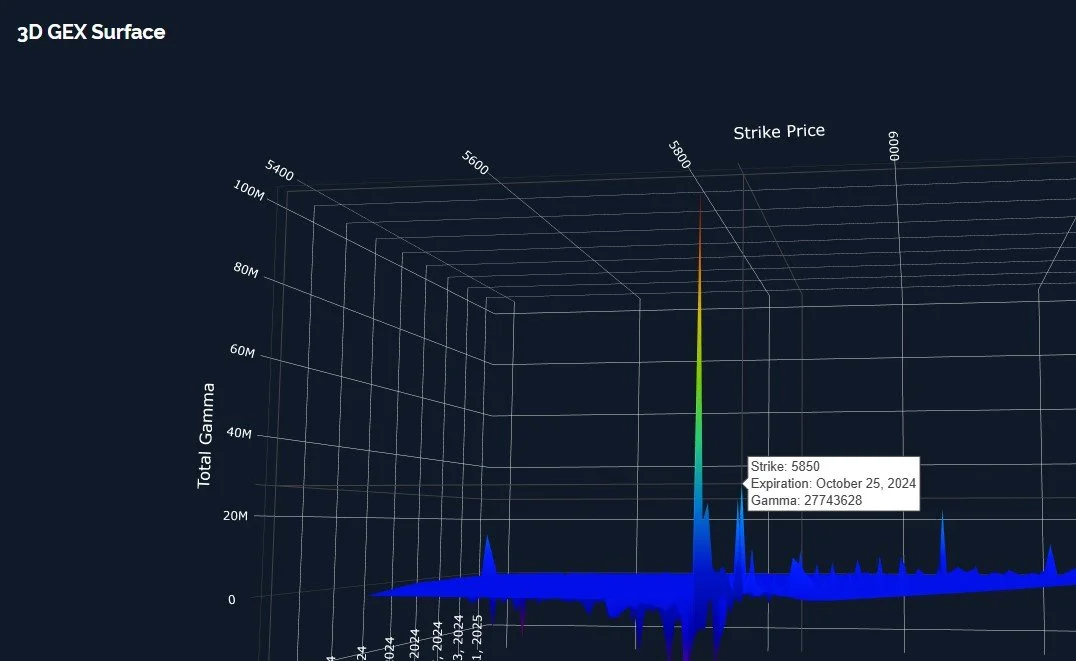
SPX 3D GEX: www.geeksoffinance.com
Briefly revisiting IWM, I didn’t even recreate the trendline I drew on my chart yesterday, I just pulled the chart back up again. Look at that new candle from today respecting the line! What a beaut. IWM is stuck below the middle Keltner, so just like with SPX and QQQ, we need to see if we can get a gap or intraday move either a little closer to that lower line at 211 (below 219 would be my personal signal to look short) or above the middle Keltner at 220, opening up 224 and then 230, potentially. Hopefully this becomes more clear in tomorrow’s cash session.

IWM GEX Levels: www.geeksoffinance.com
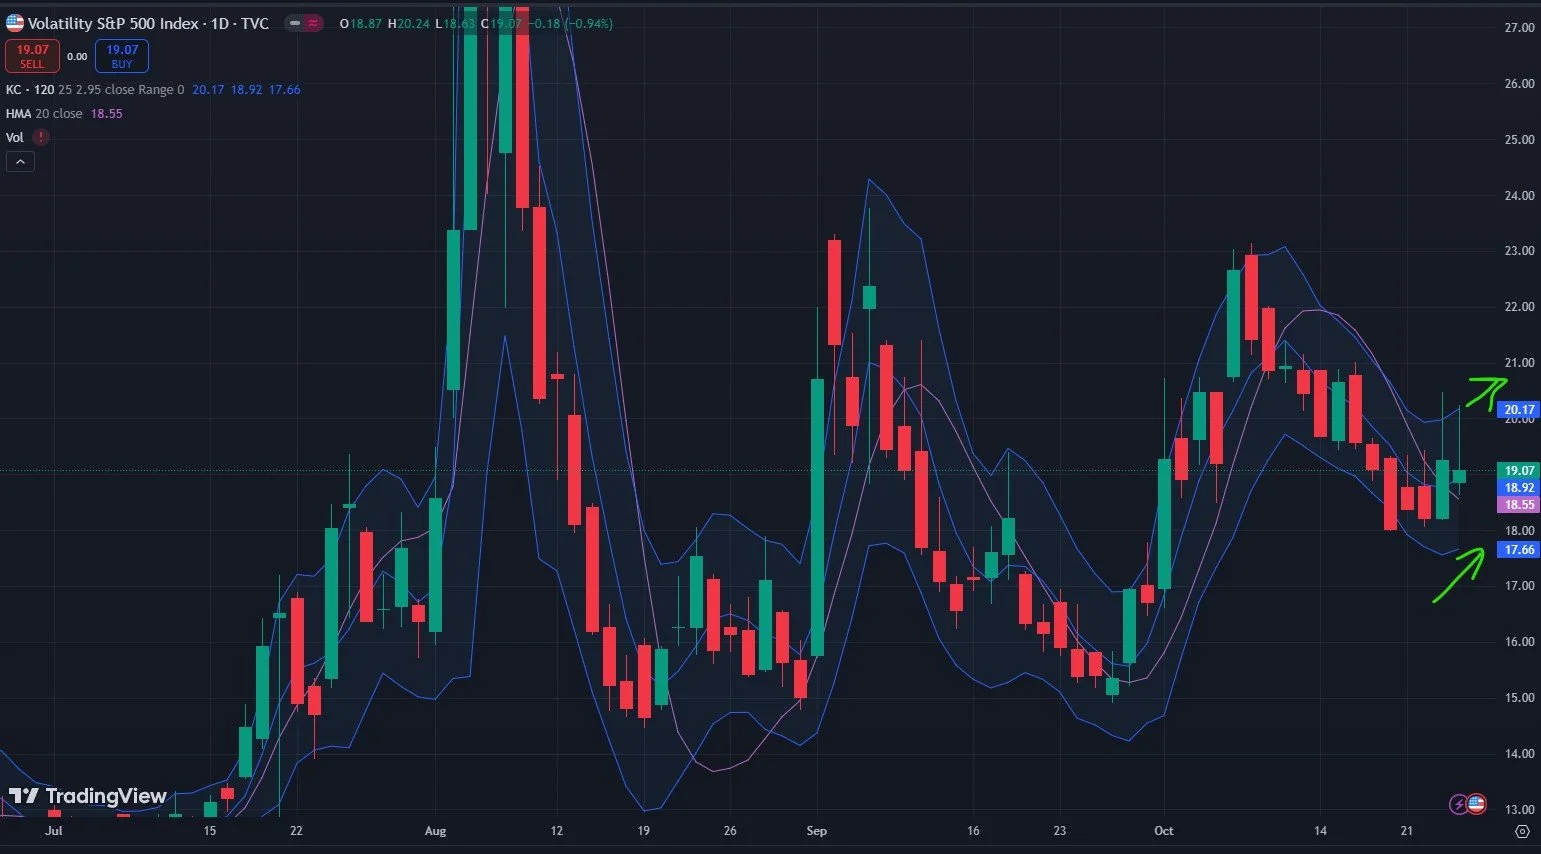
The VIX had its second day of a “mini-spike,” and the close above the Hull yesterday and today as well as the middle Keltner channel is a big red flag for bulls for the time being. On the daily chart, a move to 24+ is possible as long as we hold 18.55.

Looking at the 2-hour Keltner settings, we see the channel turning up in a bullish fashion (emphasized by my green arrows), so while the spike rejected the top of the 2-hour channel, the channel moving higher indicates room for the VIX to move up, and large VIX spikes don’t always respect theoretical lines on a chart. Caution is warranted.
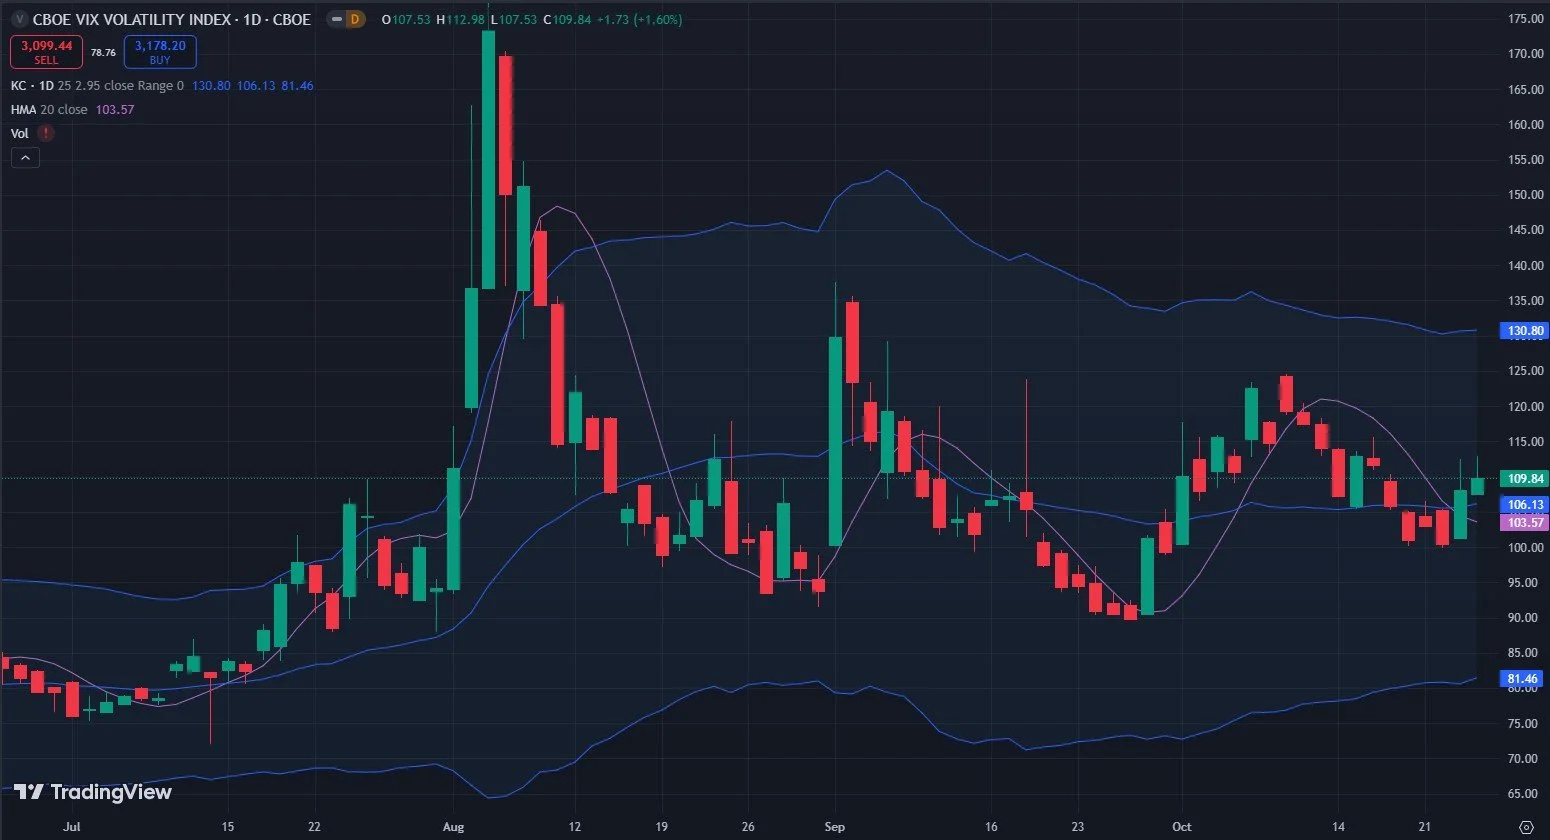
Furthermore, one of my favorite VIX indicators is the correlation between the VIX and the index measuring the future expected volatility of the VIX, VVIX (the movie “Inception” comes to mind). When we see a series of days where the VIX and VVIX are negatively correlated, the odds of a larger VIX spike over the next few weeks increase. While both were positive yesterday, today saw VIX close below yesterday’s close (don’t be fooled by the green candle, which shows what happened after the cash session opened) while VVIX was positive, so that’s one negative correlation for the record. A few more of these strung together and we have a high probability VIX spike, though imprecisely predicted as far as the exact day.
Next week, we have most of the big hitters in the tech world reporting earnings, so I am always skeptical when the market declines into earnings. Perhaps earnings won’t matter, and maybe companies won’t be willing to give forecasts yet (or perhaps soft forecasts will be given), but watching the market decline before a report makes me nervous about the chances of too much negativity already being priced in (see TSLA recently?). This is a general statement, but before taking any action, I still prefer to check the GEX picture for specific data on whether or not an opportunity exists.
join us in Discord tomorrow, we just added a new 0 DTE channel and we have some new features and bug fixes we’ll be rolling out soon. We’ll be sure to point them out first to our active Discord members. Thanks for reading!
If you’re interested in learning more about our strategy approach, we address all of these topics in our Geek University course which is included in all memberships.
If you’re interested in accessing our tools and analytics, be sure to check out our website!
Thanks for being part of our community and know that we invite your feedback!
We recently posted a YouTube video and we have many short videos for you to review where we cover a variety of predictions and educational topics.
The information provided by Geeks of Finance LLC is for educational purposes only and is not intended to be, nor should be construed as, an offer, recommendation or solicitation to buy or sell any security or instrument or to participate in any transaction or activity. Please view our Investment Adviser Disclaimer and Risk Disclosure.