
Lower We Go! How Long, How Far?
We always try to highlight objective factors that may challenge our bias, and we’ve certainly seen conflicting signals lately. But one thing we stuck to as a high probability event was reaching the middle Keltner channel in the 5750-60 range as long as price remained below the Hull Moving Average. We hit that channel today, bouncing perfectly where we want to see a bounce.
Things get tricky from here though, because we have gamma (GEX) which has moved more negatively, with those negative strikes exceeding the size of the GEX cluster at 5900 for Friday, yet we have some G2 Dealer Cluster Zones being reached as well. The VIX also happens to have tested the red G1 Dealer Cluster Zone and rejected, with volume showing up at VIX 15. we discuss much more than this in a short video we just posted on YouTube, which you can view here.

SPX and SPY have reached the G2 Dealer Cluster Zone, where we are looking for some sort of bounce, absent a big shift in GEX. Based on the chart above though, my bias is to sell rips below the Hull at 5871, with a close above 5871 potentially signaling a resumption of the upward move. GEX is swinging wildly from positive to negative and back again, which is a volatile scenario reminiscent of 2022, though the market is obviously at opposite extremes.

SPX GEX Levels: www.geeksoffinance.com
We can see that total GEX for SPX has flipped negative, but not dramatically so. SPY, on the other hand, went all the way to -1.6B, a dramatic move. I prefer to defer to SPX in terms of deriving meaning from the total GEX picture in this particular instance. It’s still important to know the risk, and one aspect of GEX we’d like to emphasize is that losing the large GEX clusters to the downside in a negative GEX environment can mean even more volatility to the downside, even if it doesn’t last for long. We don’t see a waterfall decline at this moment as a high probability event, but it’s possible.
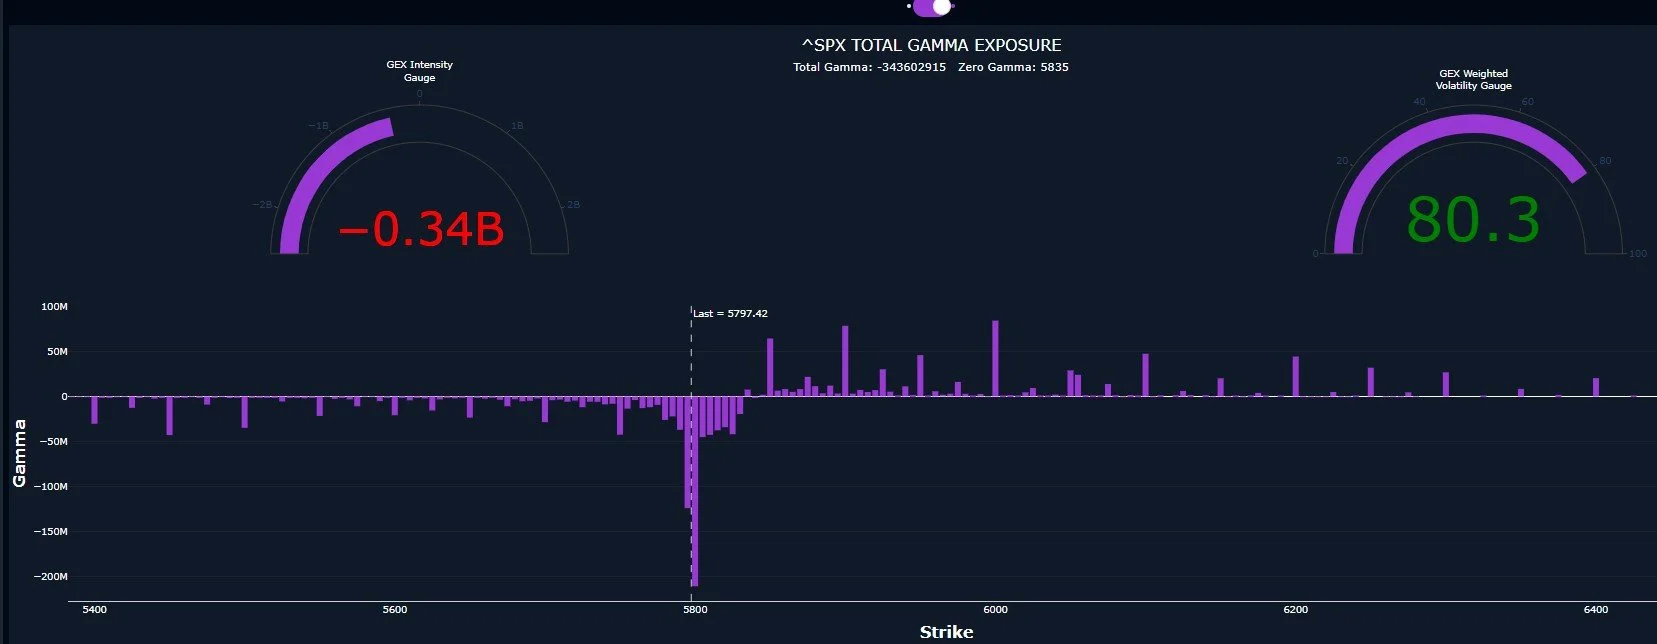
SPX GEX Graph: www.geeksoffinance.com
Let’s look at IWM, which (if you’ll grant me artistic freedom with the trendline) shows that we’ve declined into a spot where it would make sense for IWM to rebound again, though rebounding is obviously not a requirement for a market that can do anything.

Complementing the chart, IWM is also in a Dealer Cluster area where we potentially might expect a larger effort to rebound.
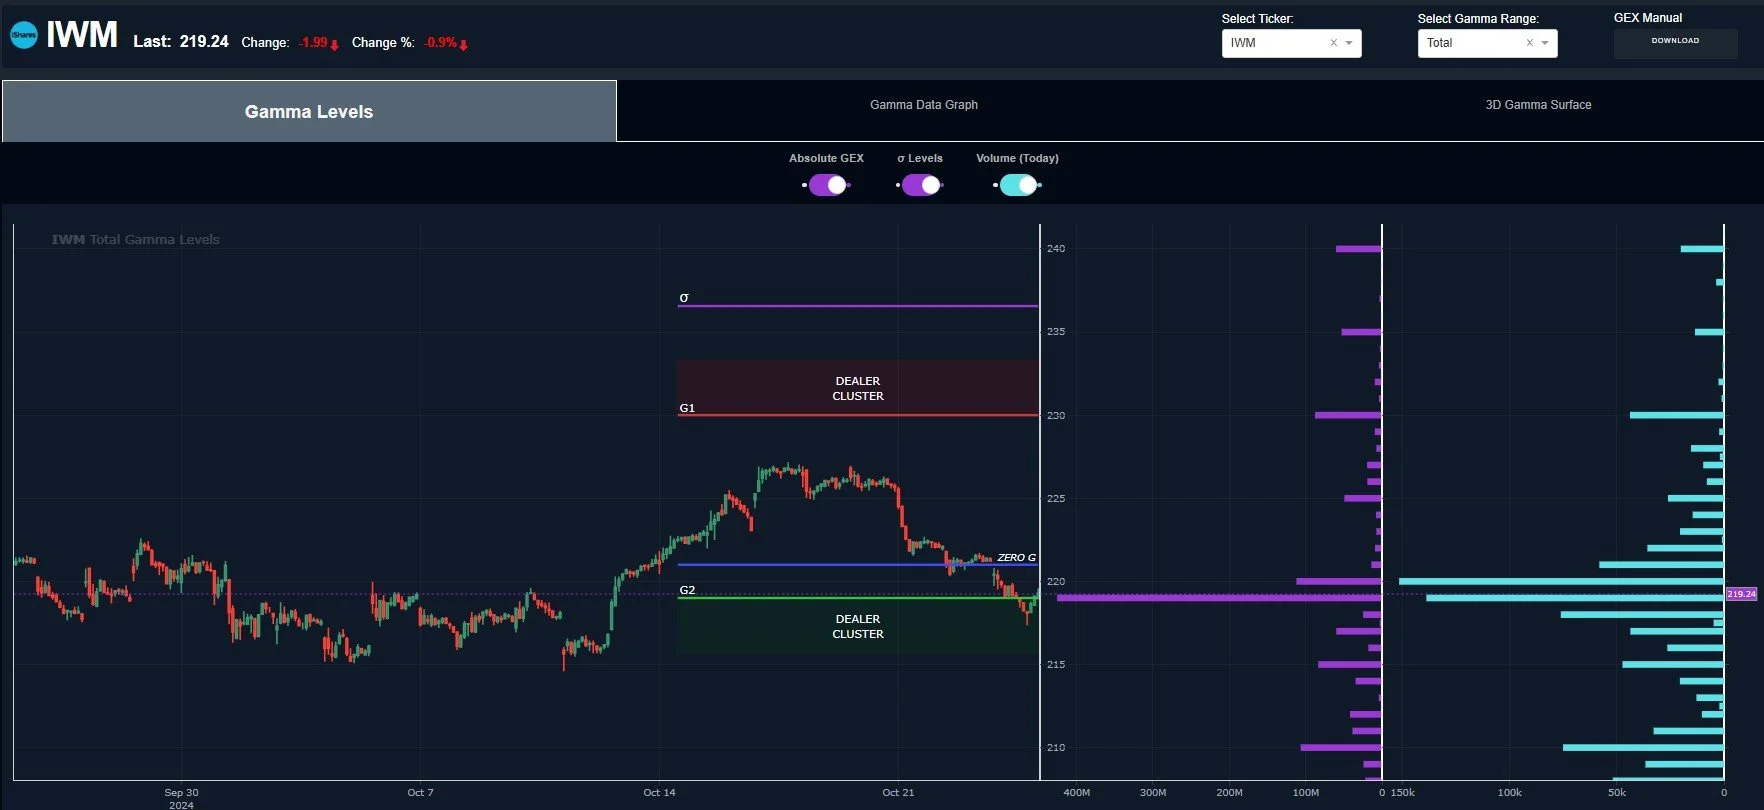
IWM GEX Levels: www.geeksoffinance.com
Another data point lending credence to the potential for a market rebound is the VIX, which reached right into the G1 Dealer Cluster where we expect possible selling of volatility again. We also see big volume at the 15 strike today. We identified the 15 strike last week as a possible target based on how the VIX shifted, though it’s noteworthy that the G2 zone has shifted upward to 17 at this moment, and when the VIX spikes, it tends to be a wild and emotional ride without obvious boundaries being respected in the very short term. So take this information in proper context.

VIX GEX Levels: www.Geeksoffinance.com
We cover a number of ideas in the YouTube video, but we’ll only briefly touch on one of those this evening, TLT. To qualify TLT as an idea, GEX is negative to an extreme, and the chart clearly shows a negative trend in motion, so this idea is strictly an oversold rebound play without a guess or implication toward our longer term view of rates or bond prices. What I don’t like is how steep the downtrend has been with the Keltners. But there’s a glimmer of hope as we see the first green candle in several days today.

GEX data also shows that TLT has declined right into a dealer cluster, with the upside overhead being between 96-97.5.
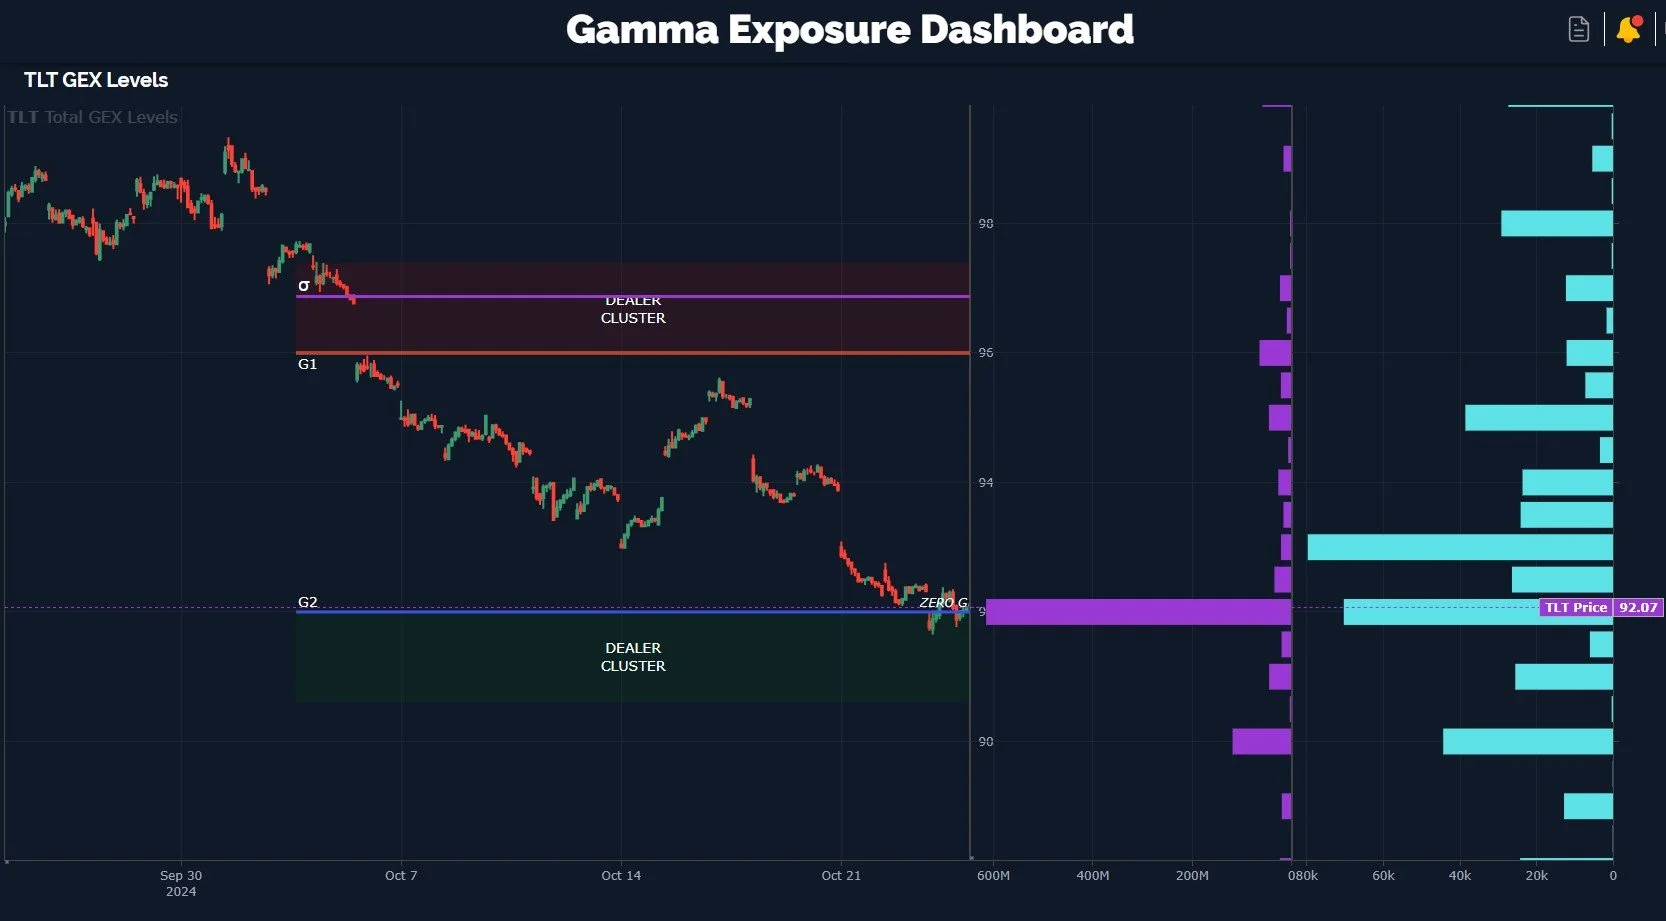
TLT GEX Levels: www.geeksoffinance.com
Given the large negative GEX cluster at 92, and the next largest cluster at 90, I like the potential for a rebound from here, with 90 as my stop price (completely subjective, but that’s my personal risk tolerance). The extreme negative GEX intensity shows TLT hasn’t had this negative of a GEX setup over the last year, which is a potential contrarian signal. Since TLT dropped with the rate cut, does a resurgence in inflation imply TLT rises? I have no clue, but I know I’m looking at a potential rebound opportunity given the current setup.
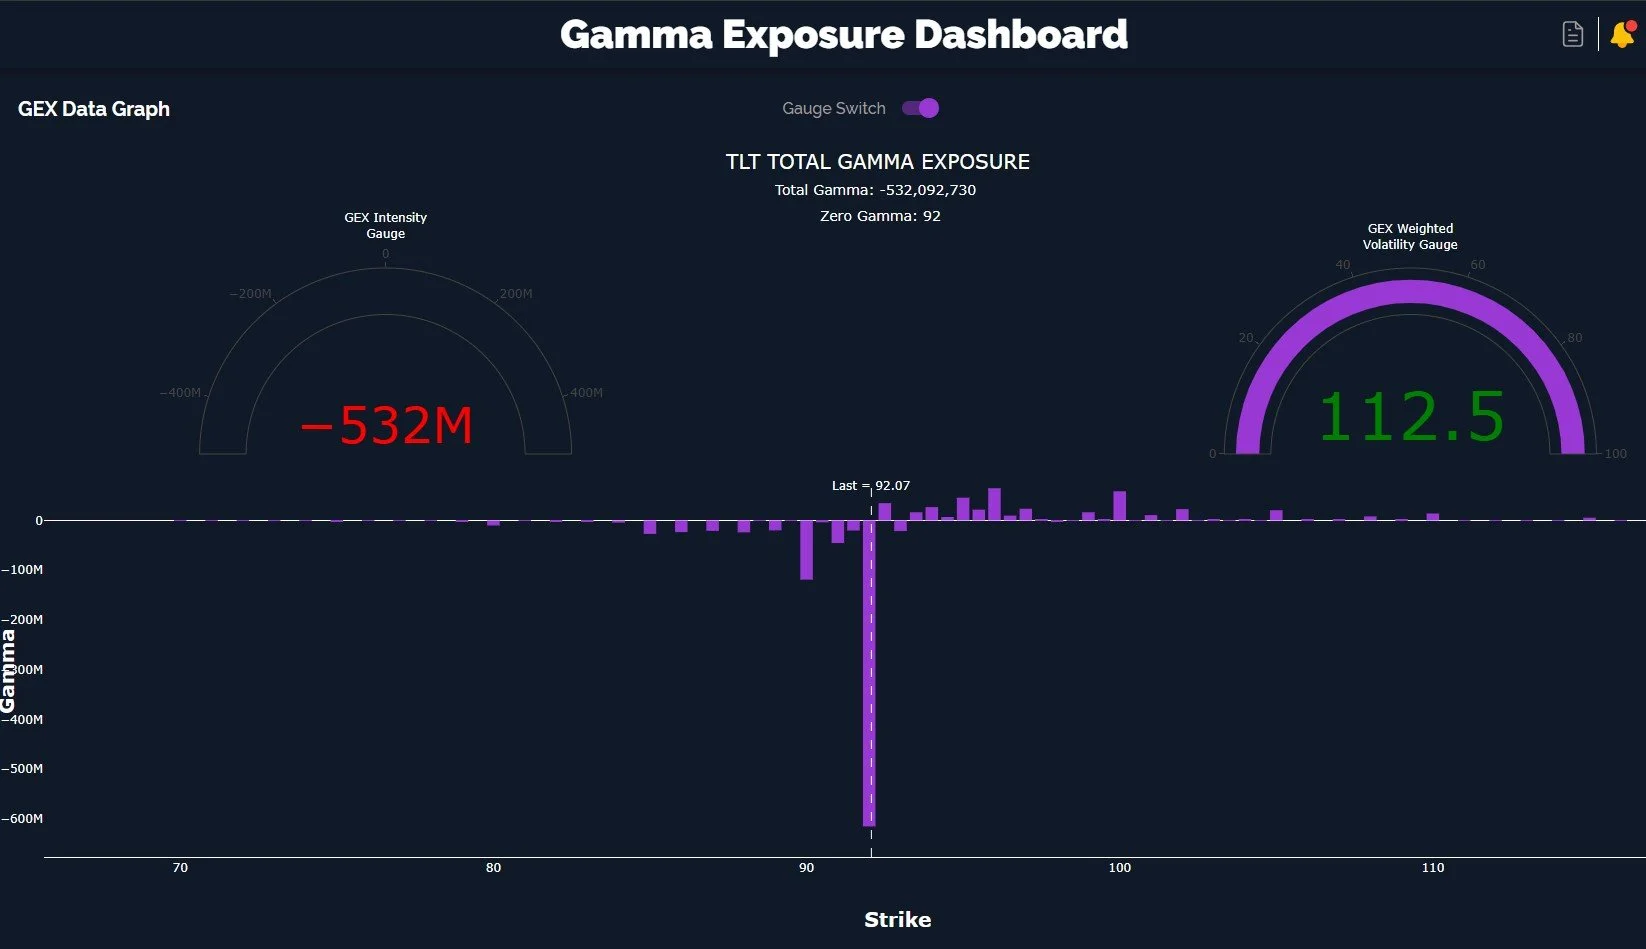
TLT GEX Data Graph: www.geeksoffinance.com
join us in Discord tomorrow, we just added a new 0 DTE channel and we have some new features and bug fixes we’ll be rolling out soon. We’ll be sure to point them out first to our active Discord members. Thanks for reading!
If you’re interested in learning more about our strategy approach, we address all of these topics in our Geek University course which is included in all memberships.
If you’re interested in accessing our tools and analytics, be sure to check out our website!
Thanks for being part of our community and know that we invite your feedback!
We recently posted a YouTube video and we have many short videos for you to review where we cover a variety of predictions and educational topics.
The information provided by Geeks of Finance LLC is for educational purposes only and is not intended to be, nor should be construed as, an offer, recommendation or solicitation to buy or sell any security or instrument or to participate in any transaction or activity. Please view our Investment Adviser Disclaimer and Risk Disclosure.