
Divergences & Potential Opportunities
2024 Election Subscription Discount: You may be stressed about your preferred candidates’ prospects for winning the upcoming election in the USA, but don’t let that stress expand to your trading resources..Take advantage of our temporary $300 discount on our annual Portfolio Manager-tier subscription! Enter code ELECTION2024 at checkout to receive the $300 discount! Get access to ALL of our tickers, engage in our chat group with experienced traders, get access to our 5-hour educational course, and also our Trade Ideas channel for our Educational Portfolio! 5 SPOTS AVAILABLE
Hello everyone! Hopefully you had a great weekend. We posted a YouTube video tonight (you can view it here) where we discuss some significant nuances (is that oxymoronic? I invoke the great baseball player and holder of wisdom, Yogi Berra) between SPX and SPY, upcoming events, and a quick analysis of major tech names. We will complement the video with a separate discussion in tonight’s newsletter of some other important observations from late last week.
The most glaringly obvious peculiarity about Friday is that the Nasdaq gapped up nicely, finally touched the gamma (GEX) target of 500 we’ve been waiting on for some time, and then faded, still holding important technical levels (and fairly solid positive GEX) in the process. Meanwhile, the S&P, which shares roughly 80% overlap amongst its top 10 holdings, basically fell apart and closed very red, violating key support. WTF (What the Friday)?
Several good arguments exist as to the “why,” and perhaps two that resonate with your beloved author include:
1) Big tech earnings are coming up, so until we get through those reports, tech will remain more resilient than the S&P, even if the underlying rotation shows broader weakness and worst breadth. The divergence is possibly even an early warning that the market as a whole will indeed drop more significantly after the “Magnificent Seven” report. QQQ hit 500, the upper Dealer Cluster Zone. That’s all, folks, even if QQQ moves sideways or attempts to retest 500 until we get beyond this week.
2) Another possibility is that this is just another trap for bears, because hey, the HFT crowd in Connecticut and the bulls in Chicago and New York love bear meat, and to eat well, we have to get the bears to come out on the limb. The S&P will catch back up to reflect tech strength and all will be fine. Market participants are positioned bullish into year-end, so any dip is just a gift for buyers.
Let’s take a quick break and look at the heat map to see just how concentrated Friday’s performance was in the largest tech names:
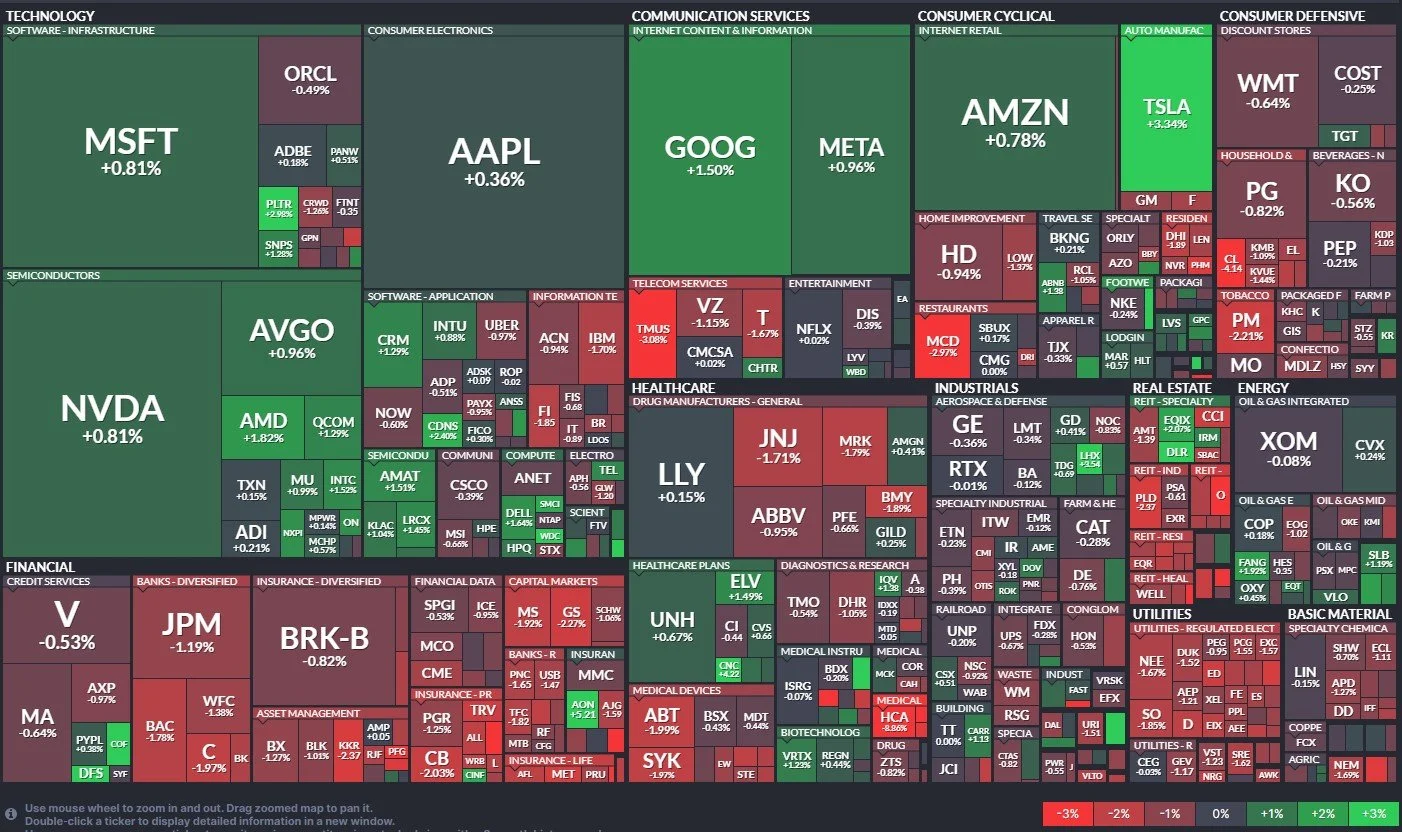
Finviz.com heatmap
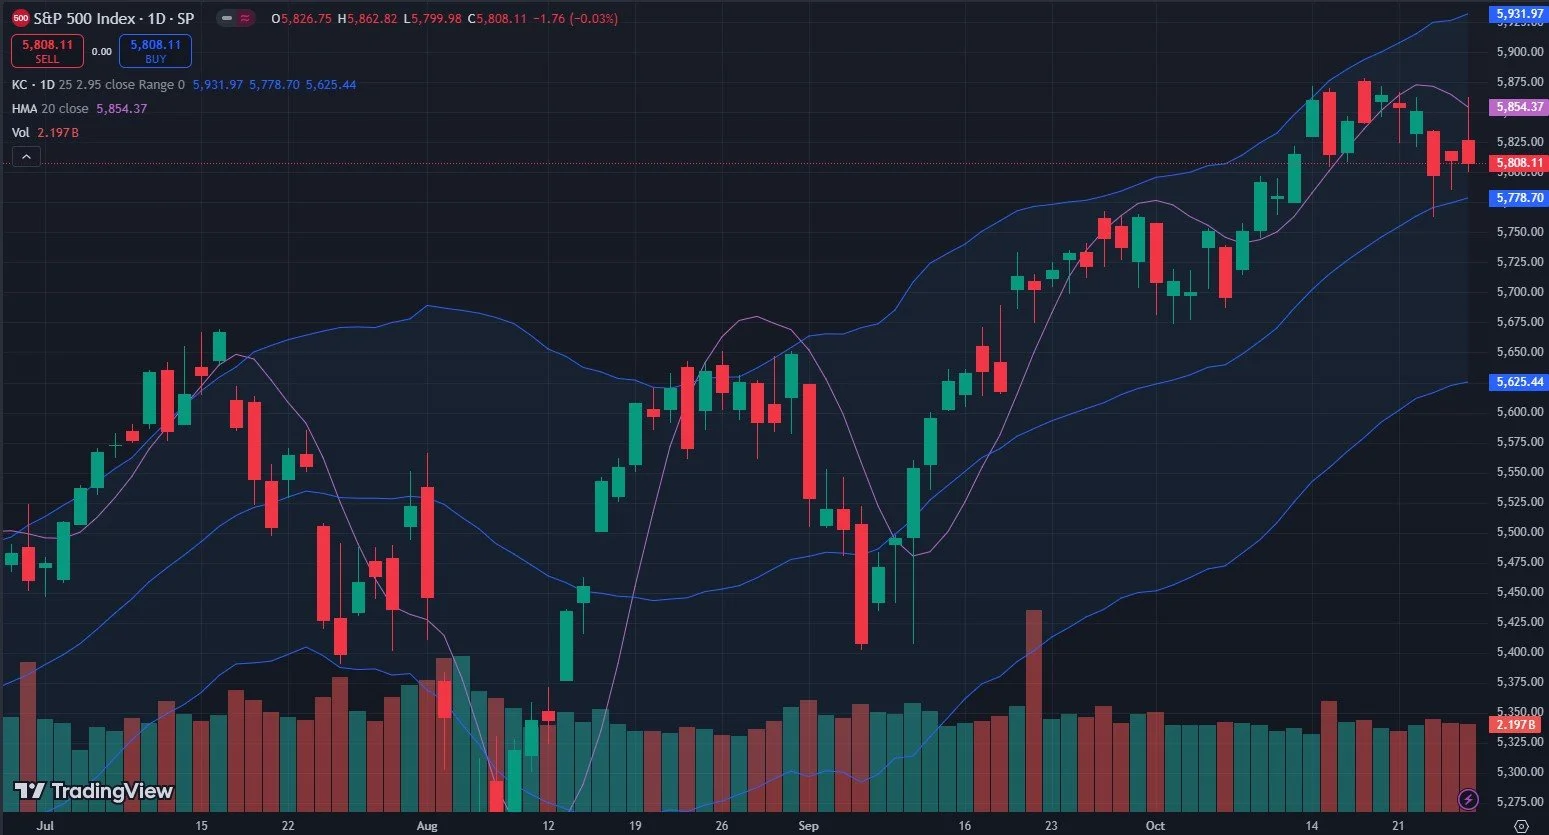
To further illustrate what we see on the heat map, look at the SPX chart below, which shows a harsh rejection from a near-perfect test of the Hull Moving Average, and once again, another great example of GEX working for us. If you read Thursday’s newsletter, we highlighted that 5900 was greatly reduced (essentially gone) from Friday’s GEX expiry, and that 5850 was the largest GEX cluster. What was Friday’s high? 5854. We now see SPX about 30 points away from testing the middle Keltner channel again at 5778.70, which is a potential support area. We will want to keep an eye on SPX GEX developments early this week for clues regarding the next moves and targets.
QQQ’s candle Friday doesn’t exactly look bullish, but the decline from the intraday highs stopped at the Hull, so we believe the odds favor upside unless we decisively break 494.

QQQ maintains solid positive GEX since the V-shaped GEX move from October 23. While GEX is roughly in-line with where it has been since the beginning of October, it has taken an adventurous course due to the short-term nature of this markets’ focus.

QQQ Historical GEX: www.geeksoffinance.com
One concerning aspect of QQQ is the lack of significantly higher GEX targets at the current moment. As mentioned in the YouTube video, we do see bullish positioning into year-end for SPY, but such positioning does not mean that the market cannot decline between now and then. So until we see QQQ GEX shift to reflect higher probability targets at higher strikes, we should stay on our toes regarding the possibility of rips getting sold similar to what we saw on Friday.

QQQ GEX Levels: www.geeksoffinance.com
Back to the S&P: Our active member px (as he calls himself in Discord) mentioned JPM. You see the red sections of the heat map filled with financial companies, which is not a bad contrarian place to start looking for possible ideas. JPM’s chart is in a solid uptrend. and while inconclusive by itself, we see JPM hasn’t yet reached the top Keltner, which keeps rising in bullish fashion. Price itself has been building out a flag since the mid-October rally. Can JPM give us a quick boost to 227? Let’s see what GEX says.

JPM has overall positive GEX (though not shown on the selected chart and noticeable GEX targets at 225, 230, and even up to 240. JPM hasn’t hit the G1 Dealer Cluster Zone yet, either. While the G2 zone is quite some distance below, the odds currently favor a trip toward 230-240 before a possible larger drop. Furthermore, JPM rising should mean that the financial sector could rise, presumably lifting the S&P with it.
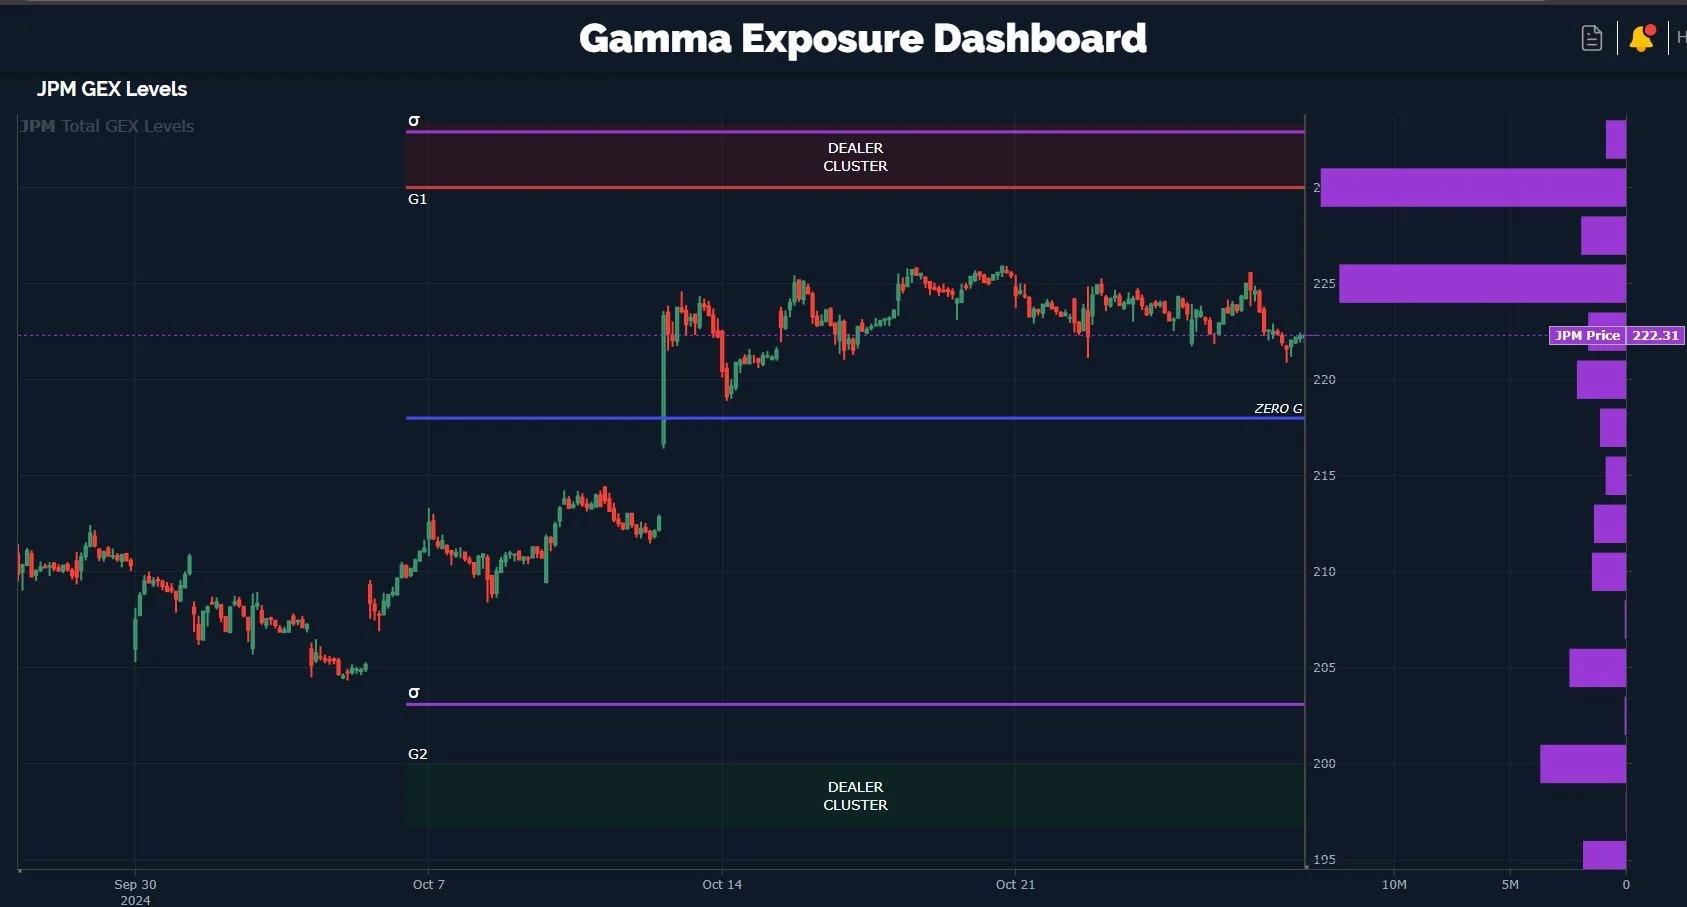
JPM GEX Levels: www.geeksoffinance.com
Let’s look at another S&P darling, Walmart (WMT). While also joining Club Red on Friday, the drop stopped right at the Hull. GEX is positive, the Keltner channel is increasing, and we see price is in a solid uptrend overall since mid-August.

WMT Is also close to a G2 Dealer Cluster Zone, meaning the significant relative GEX at 85-86 is a high probability target and potentially greater upside from here than the downside to get back into the G2 green box.

WMT GEX Levels: www.geeksoffinance.com
In summary, I lean toward a more reserved version of my 2nd possibility, that the dip in the S&P is a buying opportunity, with higher year-end targets in mind. “More reserved” implies that we may see a deeper and scary drop coming soon, particularly in light of seasonality heading into the election. But that drop is likely to resolve higher, given seasonality subsequent to the election and the current GEX positioning. We see individual holdings within SPY/SPX closely approaching G2 Dealer buy zones. Sometimes cycles invert, and sometimes low-probability events still happen (because anything above zero percent chance is logically possible), but we will continue taking our portfolio changes one day at a time as we see the upcoming earnings cycle, election, and accompanying GEX adjustments unfold.

join us in Discord tomorrow, where we often share important updates as we see them reflected on our GEX dashboard. Thanks for reading and consider our promotion to directly access the data on your own timing.
If you’re interested in learning more about our strategy approach, we address all of these topics in our Geek University course which is included in all memberships.
If you’re interested in accessing our tools and analytics, or taking advantage of our promotion (see the top of this newsletter), be sure to check out our website!
Thanks for being part of our community and know that we invite your feedback!
We recently posted a YouTube video and we have many short videos for you to review where we cover a variety of predictions and educational topics.
The information provided by Geeks of Finance LLC is for educational purposes only and is not intended to be, nor should be construed as, an offer, recommendation or solicitation to buy or sell any security or instrument or to participate in any transaction or activity. Please view our Investment Adviser Disclaimer and Risk Disclosure.