GEX DashboardReal-time Gamma Exposure, by strike, for 700+ stocks and ETFs
The market has a map. Most traders never see it.
Gamma exposure reveals the support and resistance levels that dealers are forced to defend, in real-time. Actual positioning data, not a lagging indicator built on past price.
Join 5,000+ traders and investors across 50+ countries · cancel anytime
30,000+ on YouTubeLive GEX analysis every trading dayReal-time GEX + option flows
gex-analysis · replayREPLAY
700+ Stocks & ETFs · Real-Time
GEX Dashboard
Most tools show you what the market did. The GEX Dashboard shows where dealers are forced to hedge, in real-time, all session.
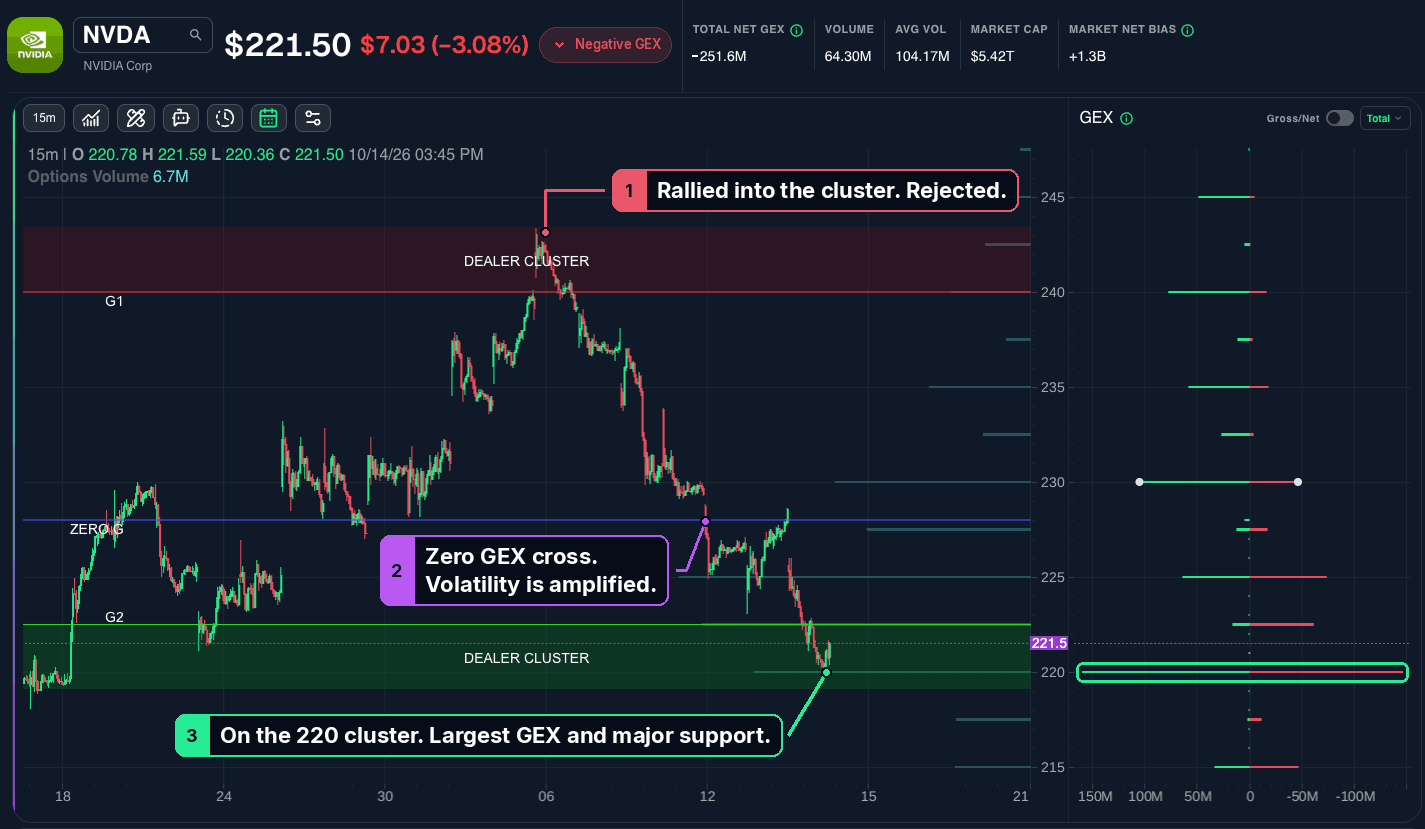
Click to enlargeNVDA · 15m · Oct 14, 2026
01See the levels that matter
Real-time gamma by strike, for indexes and single names. Dealer Clusters are the levels price is drawn to and defended at. The zero-gamma flip is the line between a calm tape and a fast one.
Most traders draw their own support and resistance. GEX shows the levels the market actually has to respect.
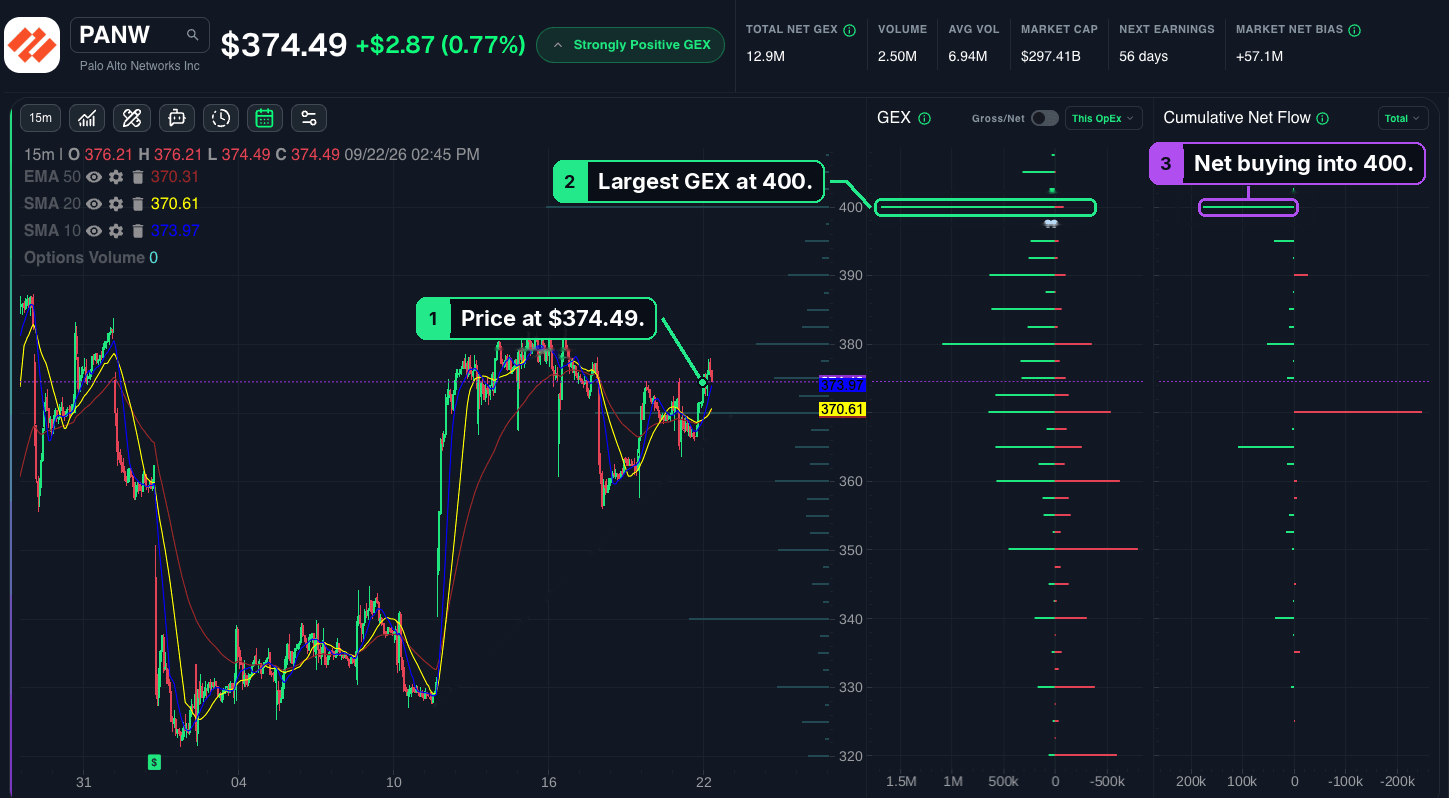
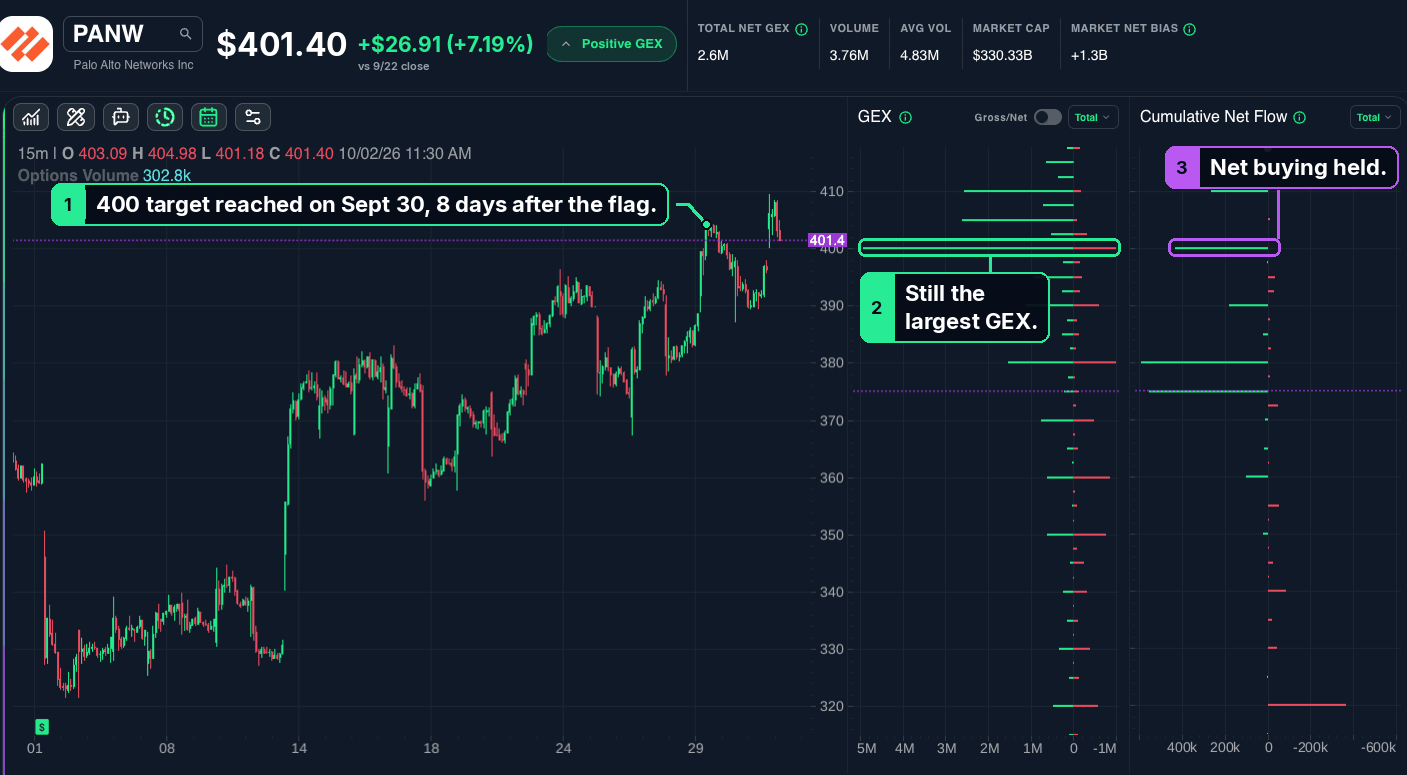
PANW: the level, the flow, and how price responded
FlaggedSept 22
Key level400
Price at flag374.49
Target hitSept 30 · 8 days
Before · Sept 22, 2026Click to enlarge
8 days to target
After · Sept 30, 2026Click to enlarge
On Sept 22 the dashboard showed the largest GEX on PANW sitting at 400 with net buying accumulating. Over the next 8 days price gravitated right into the target.
02Combine GEX & flow to gain enhanced insights
Price is approaching a Dealer Cluster. Is real money buying into it, or selling it? Flow, read alongside GEX, shows whether the level is being reinforced or challenged before price gets there.
A resistance level with real money leaning into it can’t be seen on a price chart. GEX and cumulative net flow illuminate actual positioning in real-time.
Live FlowCumulative FlowReal-Money Impact
03Stay current as the map changes
Rolling expirations reshape the levels over time. Filter by expiration to isolate 0DTE, Weekly, or any combination of expiration dates. Compare today’s GEX to its history, or open the 3D model to see the whole surface.
One net GEX number hides the structure underneath it. Our 3D Model shows which levels carry weight and which are about to roll off.
DTE Filter3D Surface ModelHistorical Comparison
Members
What members say
I am in love with GEX. Geeks of Finance provides that data in realtime. It has been the game changer for me. The amount I paid for the subscription is peanuts compared to the value I am getting.
MaMadhav · via Discord, Nov 2025
First day trading with looking at GEX and following along with the Discord chats. Thank you Geeks for the GEX tools and analysis and education.
MaMacFolk · via Discord, Dec 2024
I’ve been subscribed for a few months as an Analyst, and your product has been the best I’ve tried after 5+ different communities. I love the daily videos and previews.
BrBrie · via Email, Sept 2025
Quotes are from members, lightly trimmed for length. Results vary and past performance does not indicate future results.
Stop trading without a map.
Real-time GEX for 700+ stocks and ETFs, alongside Options Flow, Stock Analytics, and Algorithms. Included with Analyst and Portfolio Manager from $66/mo billed annually; monthly plans available, cancel anytime.
GEX measures how much hedging pressure options dealers carry at each price level. Positive GEX means dealers are forced to hedge against the move, which suppresses volatility; negative GEX means they hedge with it, which amplifies it. The dashboard aggregates it across the market and shows you where dealers are forced to defend.
What does the GEX Dashboard actually show?
Four things, for indexes and single stocks. The gamma environment: positive or negative, so you know whether dealers are hedging against the move or with it. The Dealer Clusters: the strikes with the heaviest gamma, which act as support and resistance. The zero-gamma flip: the level where the environment changes. And options flow around those levels, so you can see whether real money is reinforcing or challenging them. Everything updates in real-time through the session, and a DTE filter, historical data graph, and 3D surface model sit alongside the main view.
What are Dealer Clusters?
The strikes where dealer gamma exposure is most concentrated. Because dealers have to hedge those positions, these levels tend to act as support and resistance: in positive gamma they pull price in like magnets, and in negative gamma they can break fast once price reaches them.
How does options flow fit in?
Live and cumulative options flow shows what real money is doing around the key GEX levels. Read alongside GEX, it tells you whether dealer positioning is being reinforced or challenged, which helps you gauge the strength, sustainability, and potential volatility of a level before price gets there.
Can I filter by expiration?
Yes. Isolate 0DTE, weekly, monthly, or any combination of expiration dates to see which levels are driven by near-term positioning and which are longer-dated. The data graph shows how current GEX compares to its historical ranges, and the 3D model lets you analyze the full surface across strikes and expirations.
Is the data real-time?
Yes. Members see real-time gamma exposure for 700+ stocks and ETFs that updates intraday as open interest builds, expirations roll off, and 0DTE flow reshapes the map. The free demo on the homepage runs on delayed data.
Do I need to be an options expert to use it?
No. The regime read and the Dealer Cluster levels are usable on day one. If you want the full concept, our complete guide to gamma exposure walks through it from the ground up.
The information provided by Geeks of Finance LLC is for educational purposes only and is not intended to be, nor should be construed as, an offer, recommendation or solicitation to buy or sell any security or instrument or to participate in any transaction or activity. Please view our Investment Adviser Disclaimer and Risk Disclosure.



 Click to enlargeNVDA · 15m · Oct 14, 2026
 Click to enlarge
 Click to enlarge