
Has The VIX Bottomed?
End Of Summer/Labor Day Promo: $300 Off The Annual PM Tier Subscription! We have big updates in the works, so jump on this promo while it lasts! Enter code SUMMER300 at checkout! See what comes with the subscription here!
I find it amazing that we can seemingly march higher over time in monotonous fashion, making new high after new high, at least that’s what it looks like if you zoom out. In fact, the chart looks parabolic since those tiny blips on the radar we called the “crash” of 2000-2002 or 2008. But we are also making volatility records within this bizarre, seemingly euphoric environment: August saw the third highest VIX level ever. Does the fact that we reached that point and then crashed back down just as quickly give anyone any degree of comfort? Earthquakes have brief tremors beforehand as well.
No fear mongering here, I’m just pointing out that we want to pretend early August never happened, and we aren’t even done with the month yet..But the VIX is already back to this long term support area that we saw prior to the spike. While we look at the VIX as an index measuring the volatility of the broader market, it’s really based on SPX options, which does have 80% overlap with the top 10 positions of QQQ, so I guess it does have some crossover. At a bare minimum, who in their right mind would be counting on volatility being even further compressed? It might happen, and you might have special information leading you to that conclusion, but you can’t say it’s based on any recent history, that’s for sure!

VIX chart: TradingView
Looking at gamma (GEX) positioning for the VIX, we see that we’re near the lower dealer cluster zone where we are looking for some support for volatility. Interestingly, the light blue lines (which denote today’s VIX option volume) show zero interest very far below the current VIX level, but significant relative interest in higher VIX strikes, including volume at 30 and 35. To refer back to the first chart we shared, we see the Hull Moving Average (the pink line) is at 13.97. If the VIX was able to get pushed down to 14, that would roughly match up with the Hull as well as the Sigma line on our GEX Levels graph below, which signifies one standard deviation from the zero gamma level. I can certainly see 14 as an “extreme” lower target for the VIX, though I don’t require that to be touched before expecting possible market downside.
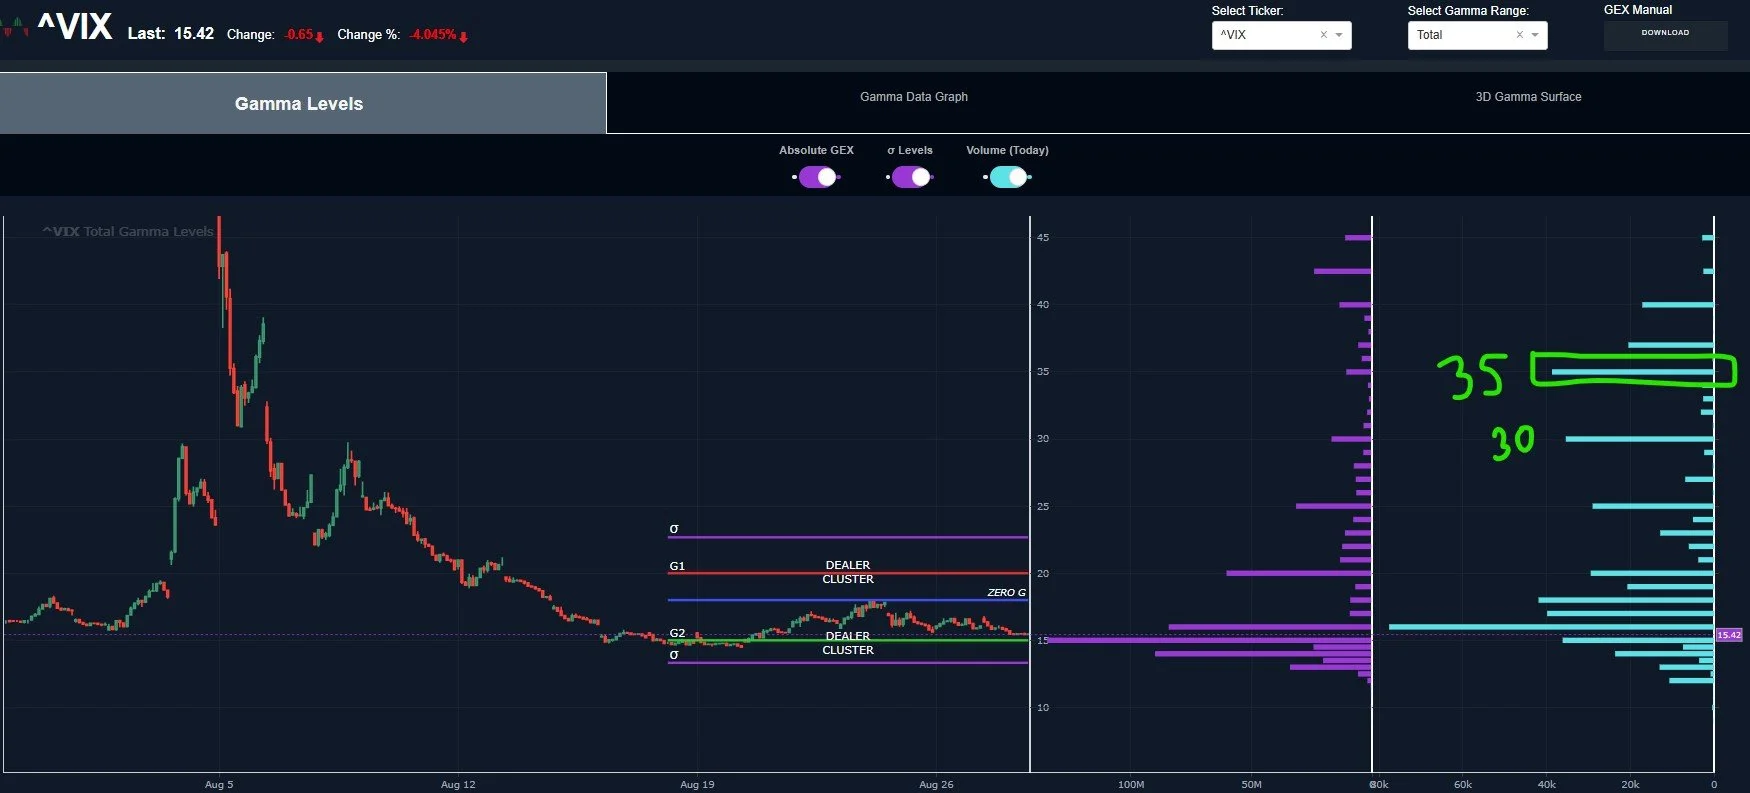
VIX GEX Levels: www.GeeksOfFinance.com
Let’s take a look at QQQ, particularly given the interest in NVDA tomorrow. In my limited experience, I wouldn’t expect any ticker to crash after such a straight-line move higher for days on end. More often, we see consolidation sideways, a slower decline, or maybe a pullback and then continuation higher. In other words, the underlying momentum and strength sometimes take more TIME to process that move before substantial downside can occur. Now, maybe we can see a false move higher in coming days that then reverses, but my mind is getting a bit ahead of where we are with creative scenarios. The bottom line is that we do have some bearish signals to pay attention to, but nothing that says “abandon all longs and get short!” at the current time.
QQQ and SPX are both below the Hull, which is bearish, and the Keltners are not signaling an uptrend for QQQ, if anything, they’re neutral (SPX does appear more bullish strictly based on the chart).
Something I’m noticing more and more is the confluence or agreement between the Hull and what we see with GEX levels. For instance, 484 would be a retest of the Hull from below, and we will see this price mentioned momentarily.

QQQ: TradingView
QQQ Historical GEX is bouncing around from negative to positive and repeating that ping-pong back and forth again, showing indecision around this neutral area. QQQ only briefly exceeded our positive GEX “line-in-the-sand” of $1B before going back to neutral. Importantly (in my view), 485 QQQ is the last BIG GEX concentration, there just isn’t substantial interest above that level, as far as GEX goes. Meanwhile, we see sizable negative GEX down to 440..Gee, what is GEX telling us about upside potential versus downside from here? Not that the odds of downside are greater, but GEX is signaling that the upside to be gained is not that great from here, for now. This can change, to be clear..But we can only deal with what we see at the moment.

QQQ Historical GEX: www.GeeksOfFinance.com
SPX overall does look more bullish than QQQ, but it also sits below the Hull and the upper Keltner channel continues to be a pesky and strong blue line (the image of a mime feeling the invisible theoretical box around him comes to mind). But we see the Keltner channels slightly turning up over the last few days…If a downside move does materialize, perhaps we can see a reversal back up after 7-10% lower? I’m getting ahead of myself again..
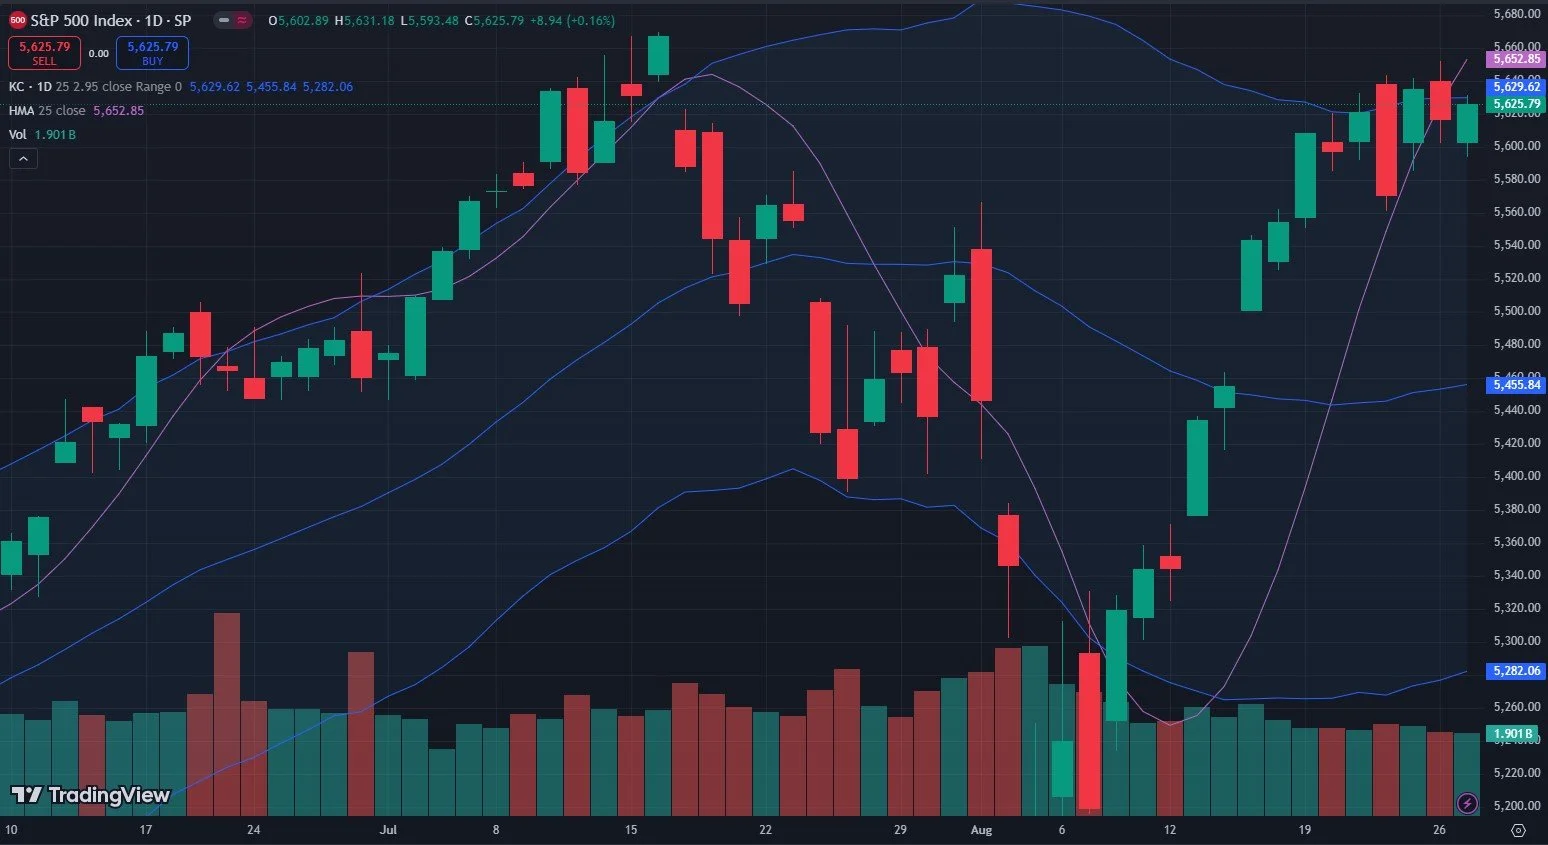
SPX: TradingView
The daily Keltner settings I used above show upside to be maxed out, but if I use weekly settings instead, I see a pathway to 5700+, which fits with what we’re seeing on the GEX levels for SPX. I like to consider the full range of possibilities as we head into a major earnings report (NVDA) with VIX at recent lows and on the heels of a major rally. The inherent problem with earnings reports is that they can spur dramatic moves that perfectly hit upside and downside targets…All within a few minutes of the after hours session, before you can sell your options the next morning. The jokes on you!
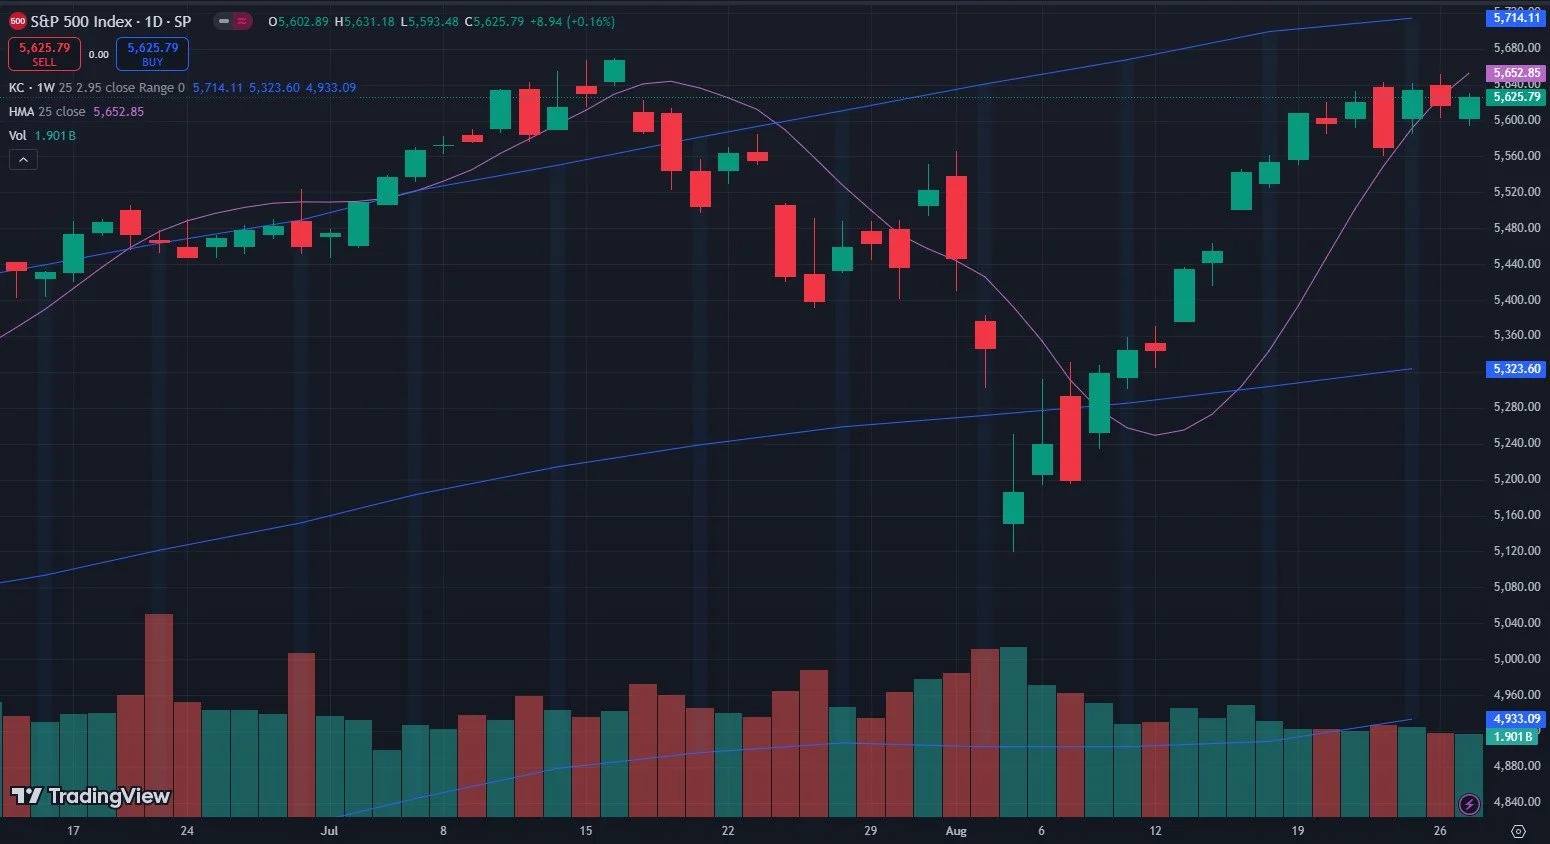
SPX Weekly Keltners-TradingView
Looking at our Geek’s GEX Levels graph, we see 5750 is a big area and the lower limit for a Dealer Cluster Zone overhead. That’s a fairly big move, even though it’s really only about 2%. 5750 is pretty close to that upper weekly Keltner limit, so more than one indication points to that as a possibility.
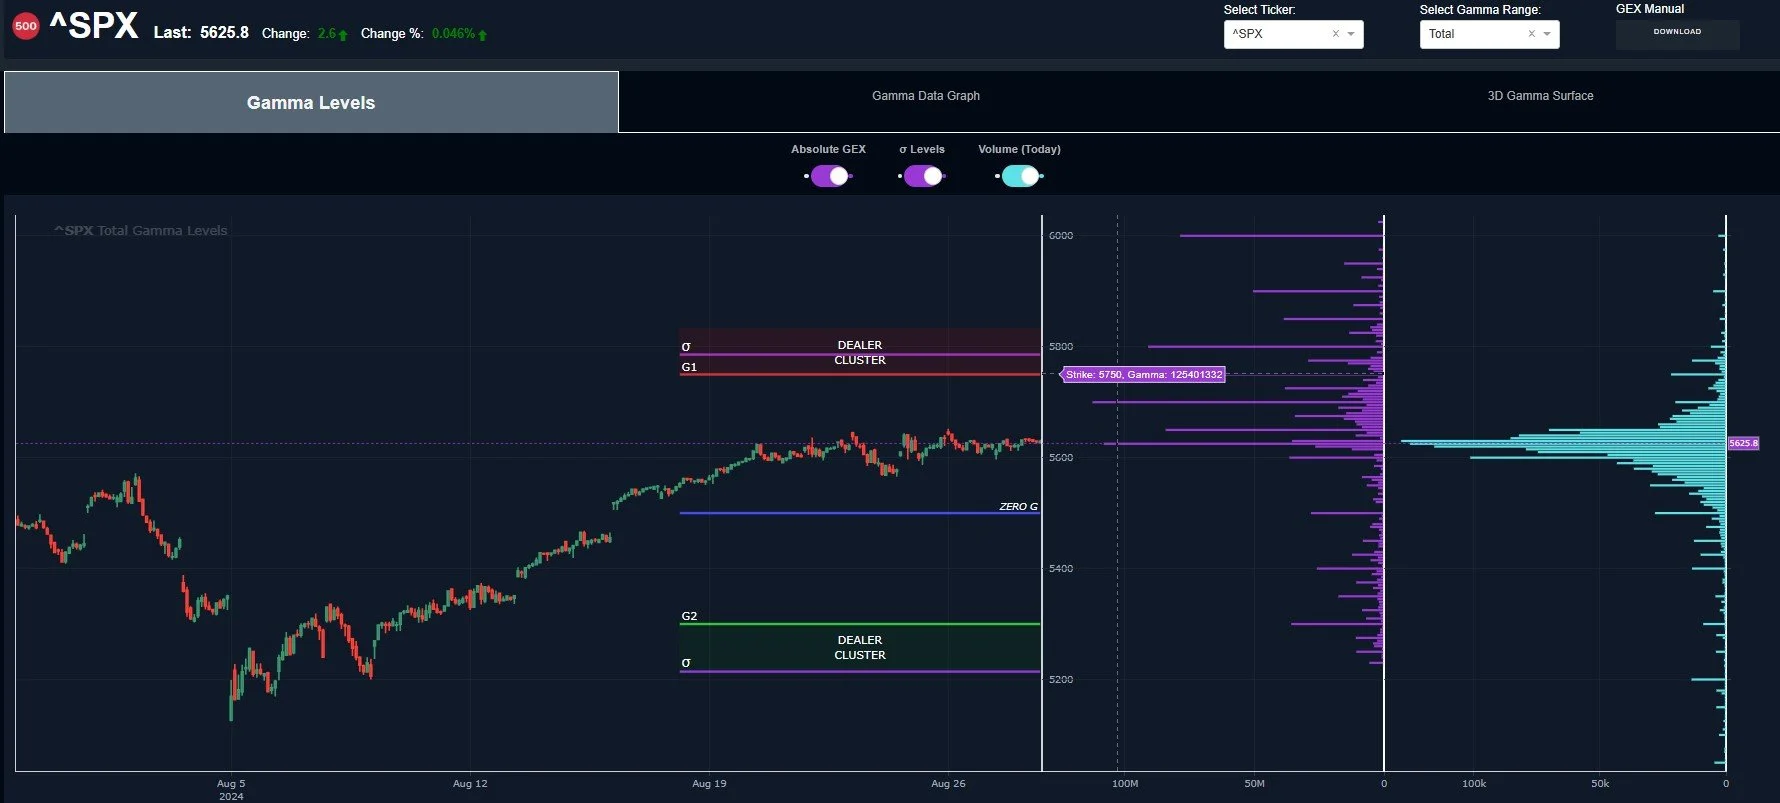
SPX GEX Levels: www.GeeksOfFinance.com
SPX total GEX is still hanging in at bullish levels at over 1B, though we know this can change quickly, and other indices don’t look as bullish. So we give the edge toward buying the dip in this environment as long as GEX stays over the “neutral” level.

SPX HISTORICAL GEX: www.Geeksoffinance.com
Can You Just Rub A Crystal Ball And Tell Me What To Do Tomorrow?
I know none of you are asking this, being astute and accomplished readers, but I did ask myself this question..The answer was sadly “no.” Not only do we not give advice, but my crystal ball has been clouded by Ken Griffin and the Federal Reserve. At least that’s what I tell myself.
But seriously, let’s consider that SPX and QQQ have roughly 80% overlap with their top 10 constituents, and NVDA is one of those. Also, NVDA has been a massive contributor toward the markets positive return year-to-date. Don’t even bother looking at your dividend or value stocks in comparison :) So we need to address NVDA in the context of 1)its likely impact on the market tomorrow night, and 2) the VIX being back to relatively low levels, and 3) the aggregate conflicting data outlined earlier in this newsletter.
We make it a rule of thumb to not trade stocks right before or during earnings, because we haven’t found GEX to be as relevant as during other times. We do sometimes get lucky and we sometimes initiate positions AFTER the dust settles within a day or two. Nonetheless, we have teased it for a couple of days, so let’s look at it: NVDA is near a Dealer Cluster Zone where we might see selling, and in fact, we already tagged the area a couple of times. But we still see big GEX at 130 and 140, with accompanying volume. I will say that total GEX is at an extreme positive reading on our GEX Intensity Gauge, meaning GEX is at an extreme relative to the last year (a possible contrarian signal).

NVDA GEX Levels: Geeks Of Finance
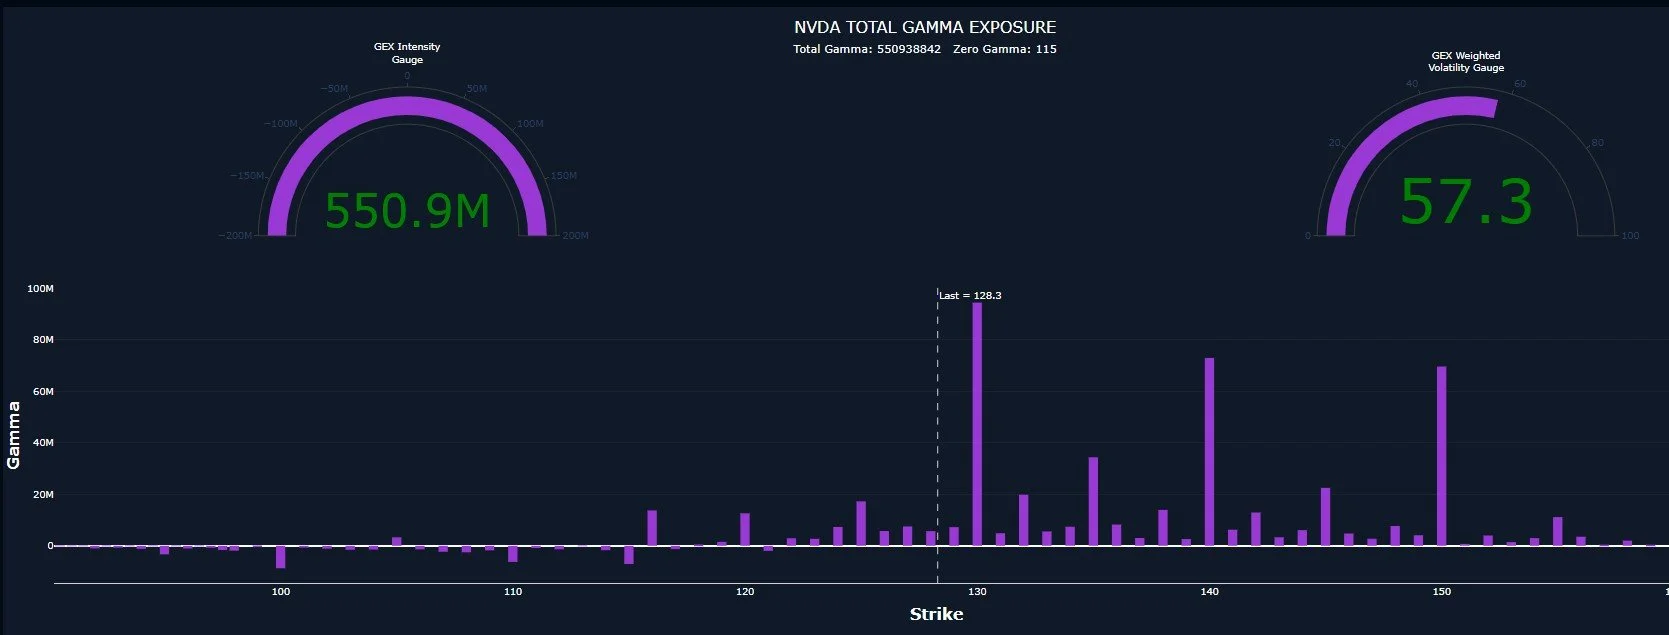
NVDA GEX Graph: www.GeeksOfFinance.com
All things considered, we are more comfortable reacting to the initial move after NVDA earnings than attempting to be a hero positioning beforehand. We outlined a number of potentially bearish factors previously that might play out, but we may also see NVDA’s upper targets hit after hours, in which case I’d expect the market to fly higher as well, even if temporarily. IF we see downside, it’s not likely to be a fleeting several hour affair, and we can point to much lower targets that would allow us to profit from what is currently unknown. Stay with us in Discord, maybe we will get a big preliminary rally tomorrow instead, making it easier to justify hedging going into NVDA earnings. We don’t know, but we will actively be trying to improve our odds as we get closer!
If you’re interested in learning more about our strategy approach, we address all of these topics in our Geek University course which is included in all memberships.
If you’re interested in accessing our tools and analytics, be sure to check out our website!
Thanks for being part of our community and know that we invite your feedback!
We have a variety of educational videos on YouTube as well!
The information provided by Geeks of Finance LLC is for educational purposes only and is not intended to be, nor should be construed as, an offer, recommendation or solicitation to buy or sell any security or instrument or to participate in any transaction or activity. Please view our Investment Adviser Disclaimer and Risk Disclosure.