
Thursday’s Preview: NVDA Bear Trap?
End Of Summer/Labor Day Promo: $300 Off The Annual PM Tier Subscription! We have big updates in the works, so jump on this promo while it lasts! Enter code SUMMER300 at checkout! See what comes with the subscription here! While we started with the idea of offering 5 subscriptions, we have had one taken, so we have 4 remaining!
Yesterday’s newsletter asked the question of whether or not the VIX has bottomed, pointing out the historical support for believing that we aren’t likely to see the VIX drop far below this area. I don’t mind a very brief victory lap in seeing the 10%+ move in the VIX right after we pointed out reasons to NOT be bearish volatility, and yet I have to shake my head, those wily VIX options traders may yet deliver another surprise in the opposite direction. My mother taught me to not play in the middle of traffic, and with the VIX rebound today, we are pretty much in the middle..We see room up to VIX 19 (as a first target), yet the sub-14 target still remains on the downside for volatility. Which one comes first? If you aren’t a big gambler and thus decided to not position for a big directional move up or down after NVDA, perhaps reacting to whichever side is chosen first would be one of several ways to approach it.
NVDA released earnings after hours, seeing the 130 level hit quickly, which GEX pointed to as a possible target. We warned that sometimes dramatic post-earnings moves can occur completely after hours, trapping option holders who won’t know whether or not they will financially survive the trade until the market opens the next day. After hitting 130, NVDA faded down to the 115s, leaving an after hours range of over 10%.

VIX chart: TradingView.com
We will come back to NVDA, but let’s look at the bigger picture with QQQ, which touched 464.56 after hours, very close to the middle Keltner channel on my daily chart. Keltner channels sometimes match up with gamma (GEX) levels and represent potential support/resistance areas in my experience (and with my custom settings, which I periodically adjust). Theoretically, 463 or close to it may represent an area that QQQ can see a reversal back up, even if only temporarily. The big question is whether or not we will see it retested in the cash session (9:30AM ET Or later) or if the after hours tag was “it.”

QQQ daily chart: TradingView.com
SPX also gives reason to not expect the world to end tomorrow: We just “happened” to settle into a Dealer Cluster Zone that may be a buying area for longs or covering area for shorts, and more than once we’ve noted the 5750-5800 zone overhead, which still seems to be live.
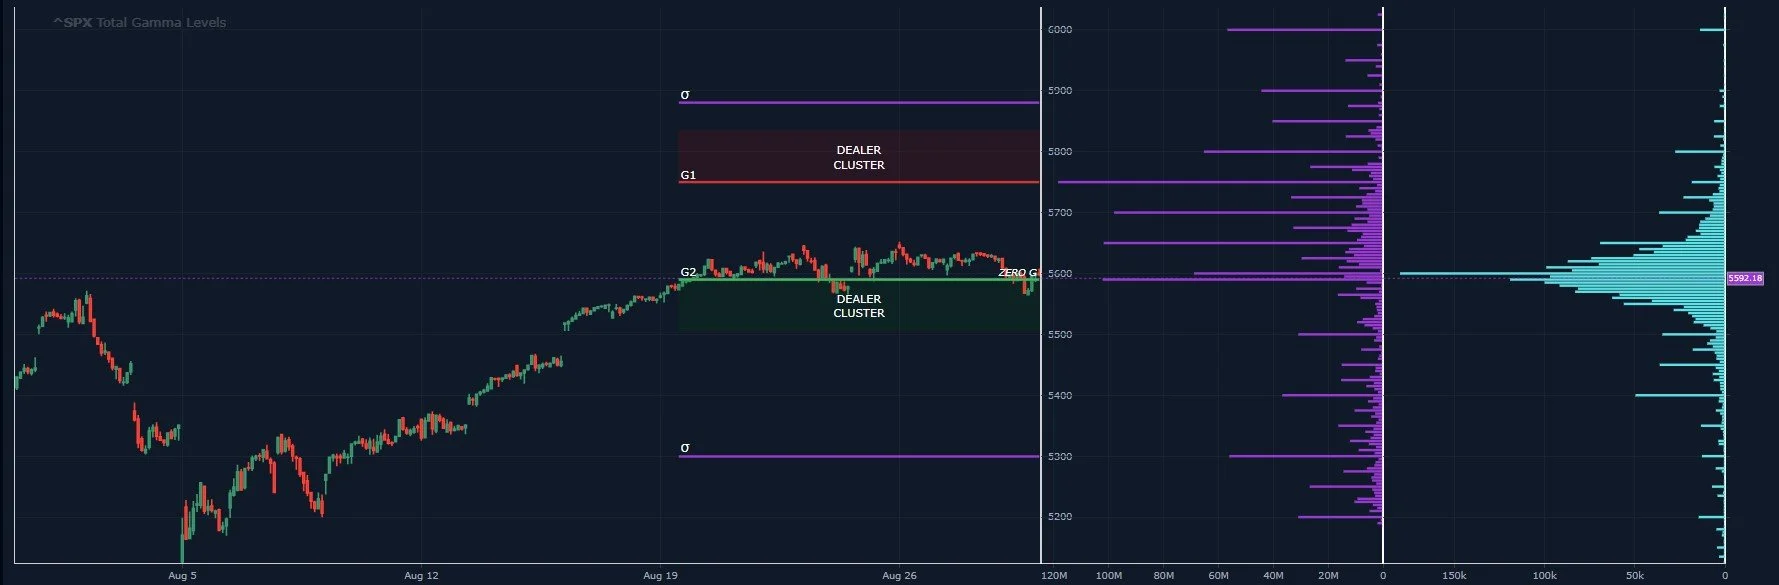
SPX GEX Levels: www.geeksoffinance.com
SPX, despite showing a declining total GEX calculation, still shows a higher low relative to a week ago and 451M is still “neutral,’ a far cry from an outright bearish GEX reading. Trust me, I prefer a very clear-cut GEX reading that allows me to mortgage the house, pawn the dog and get a payday loan on my put premium sold (is that even possible? Doubtful) in order to profit, but the market is often not THAT clear-cut, yet I am glad we can at least see that market positioning is not justifying an end-of-the-world view toward what may be concerning corporate earnings/accounting (SMCI cough) results over the long haul.

SPX Historical GEX: www.GeeksOfFinance.com
What about NVDA Itself? Can We Glean Any Helpful Hints Regarding Mr. Market?
I’m glad you asked, I was just thinking the same thing. A quick analysis of the last few days shows NVDA price below the Hull Moving Average. Regular readers know that I have a little rule I like to follow that I first heard from Brian Watt on Twitter (now only on YouTube, apparently?) to “stay short below the Hull and long above it.” I haven’t backtested this rule, but I’ve observed it across a variety of tickers ever since he uttered those words, and it tends to be a good guide, in my experience. It has certainly worked with NVDA. Not that after hours means anything once Europe wakes up and drinks their coffee, but so far, it seems that NVDA is touching prices close to the middle Keltner channel at 115.90. This may be an area of support, and thus we might see a suggestion that a gap down in the cash session might be bought. That would certainly deliver pain to both sides (calls and puts).

NVDA Daily Chart: TradingView.com
Looking at the GEX Levels chart below, we also see that NVDA has a Dealer Cluster Zone (with high option volume today) at 110, slightly below the after-hours low. GEX (so far) has accurately identified upper boundaries. Given what we see on the TradingView chart and the GEX Levels graph on our website, I personally will be looking for a possible candle wick and rebound in the event that any gap down tomorrow touches the general 110 area. This doesn’t mean that NVDA starts a new bull market from 110, or that it even holds 110, but I believe the odds favor some sort of rebound from that general area given current information.
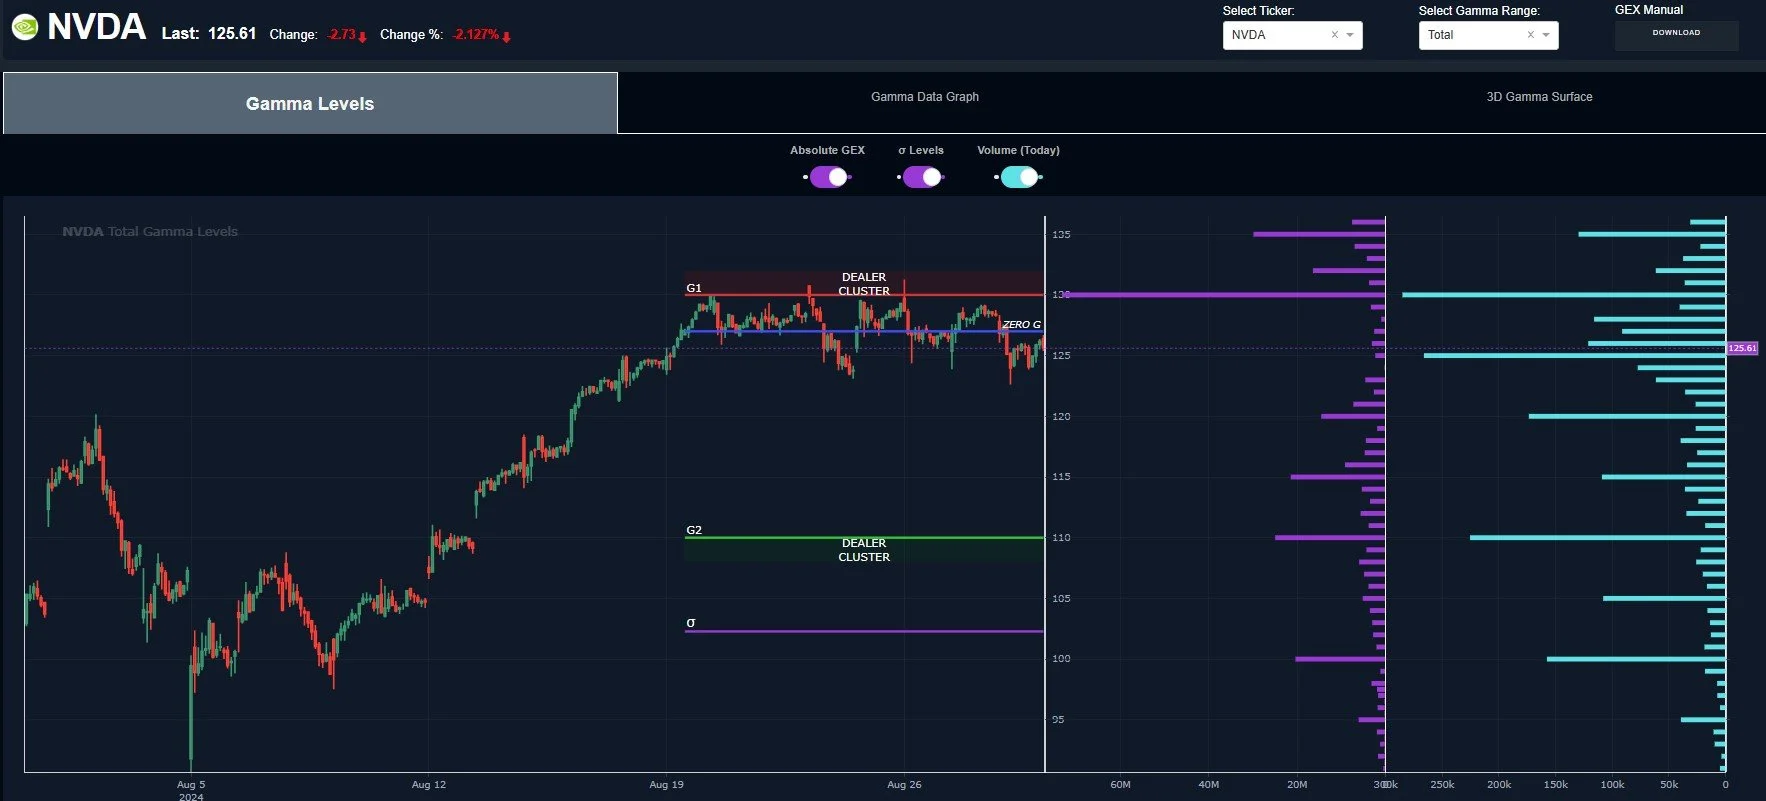
NVDA GEX Levels: www.GeeksOfFinance.com
. Check in with us in Discord, if anything shifts around the market open with GEX levels, we typically post what we see in our free channel.
If you’re interested in learning more about our strategy approach, we address all of these topics in our Geek University course which is included in all memberships.
If you’re interested in accessing our tools and analytics, be sure to check out our website!
Thanks for being part of our community and know that we invite your feedback!
We have a variety of educational videos on YouTube as well!
The information provided by Geeks of Finance LLC is for educational purposes only and is not intended to be, nor should be construed as, an offer, recommendation or solicitation to buy or sell any security or instrument or to participate in any transaction or activity. Please view our Investment Adviser Disclaimer and Risk Disclosure.