
The Worst Month For The Market Starts Now.

The market is entering the worst month of the year by historical standards, with September being down on average over 1% when looking at data over the past century.
Looking at the below chart of the previous 10 years we see just how drastic September’s performance can be when analyzing more recent data sets.

Source: YCharts, The Motley Fool
Over the last 10 years all months except September showed positive returns on average, and September’s losses are significant on a statistical basis.
But we just witnessed an amazing market reversal between August 5th and August 30th as the S&P 500 rallied over 10%, and most of that move occurred over just 11 trading sessions.

So what will this September look like? Will the market sell-off on weakness like the historical averages suggest? Or is the data and market positioning pointing to further upside?
McClellan Summation Index
The first data point we’ll analyze is the McClellan Summation Index. This is a market breadth and trend strength indicator that neatly summarizes cumulative values for the McClellan Oscillator. The McClellan Oscillator is based on Advance-Decline trend data and helps us visualize market participation over time.
When reviewing market breadth at the all-time high on July 16, we see a clear divergence between the MSI and the S&P 500, signaling that market participation was waning quite dramatically.
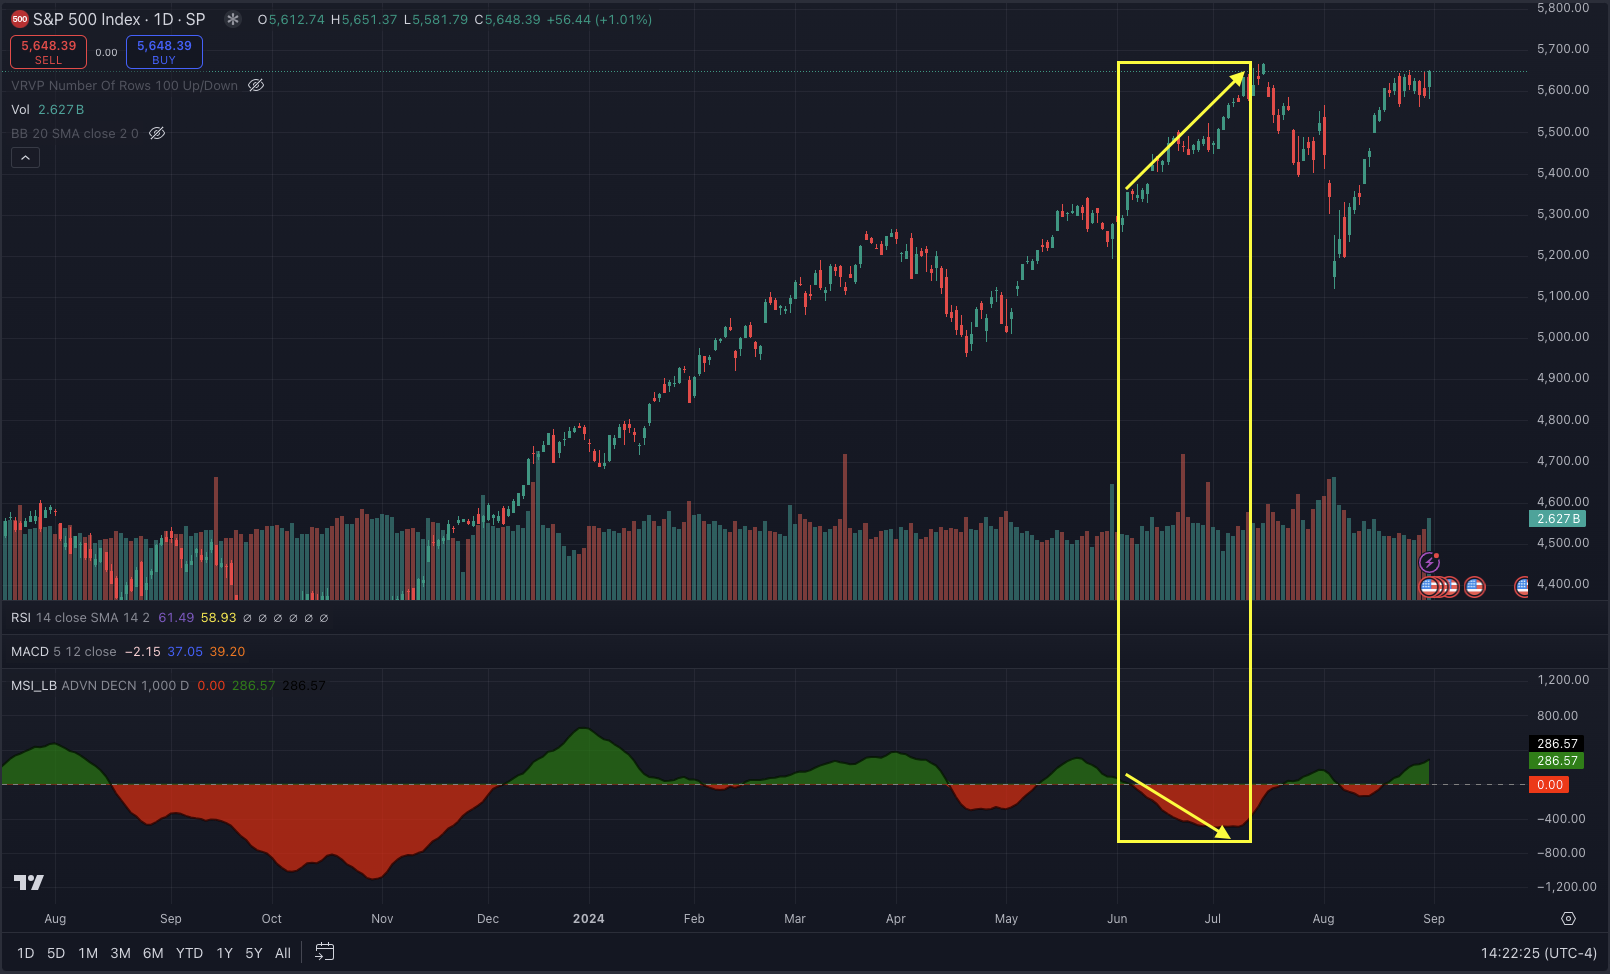
Fast-forward 6 weeks week later to today, and the market is right back at all-time highs.
However, this time we see a different breadth picture - participation is actually increasing and broadening out during this most recent market rally.
From a bigger picture perspective, this is encouraging for bulls who have been faced with mixed economic data, geopolitical concerns, the 2024 election cycle, and a massive volatility scare.

Looking at the S&P 500 Heatmap for the past week, we see some weakness in some of the Mag 7 names (NVDA, META, GOOGL), but simultaneously we’re seeing broad leadership across a number of market sectors including the Financials, Healthcare, Retail, Energy, etc.
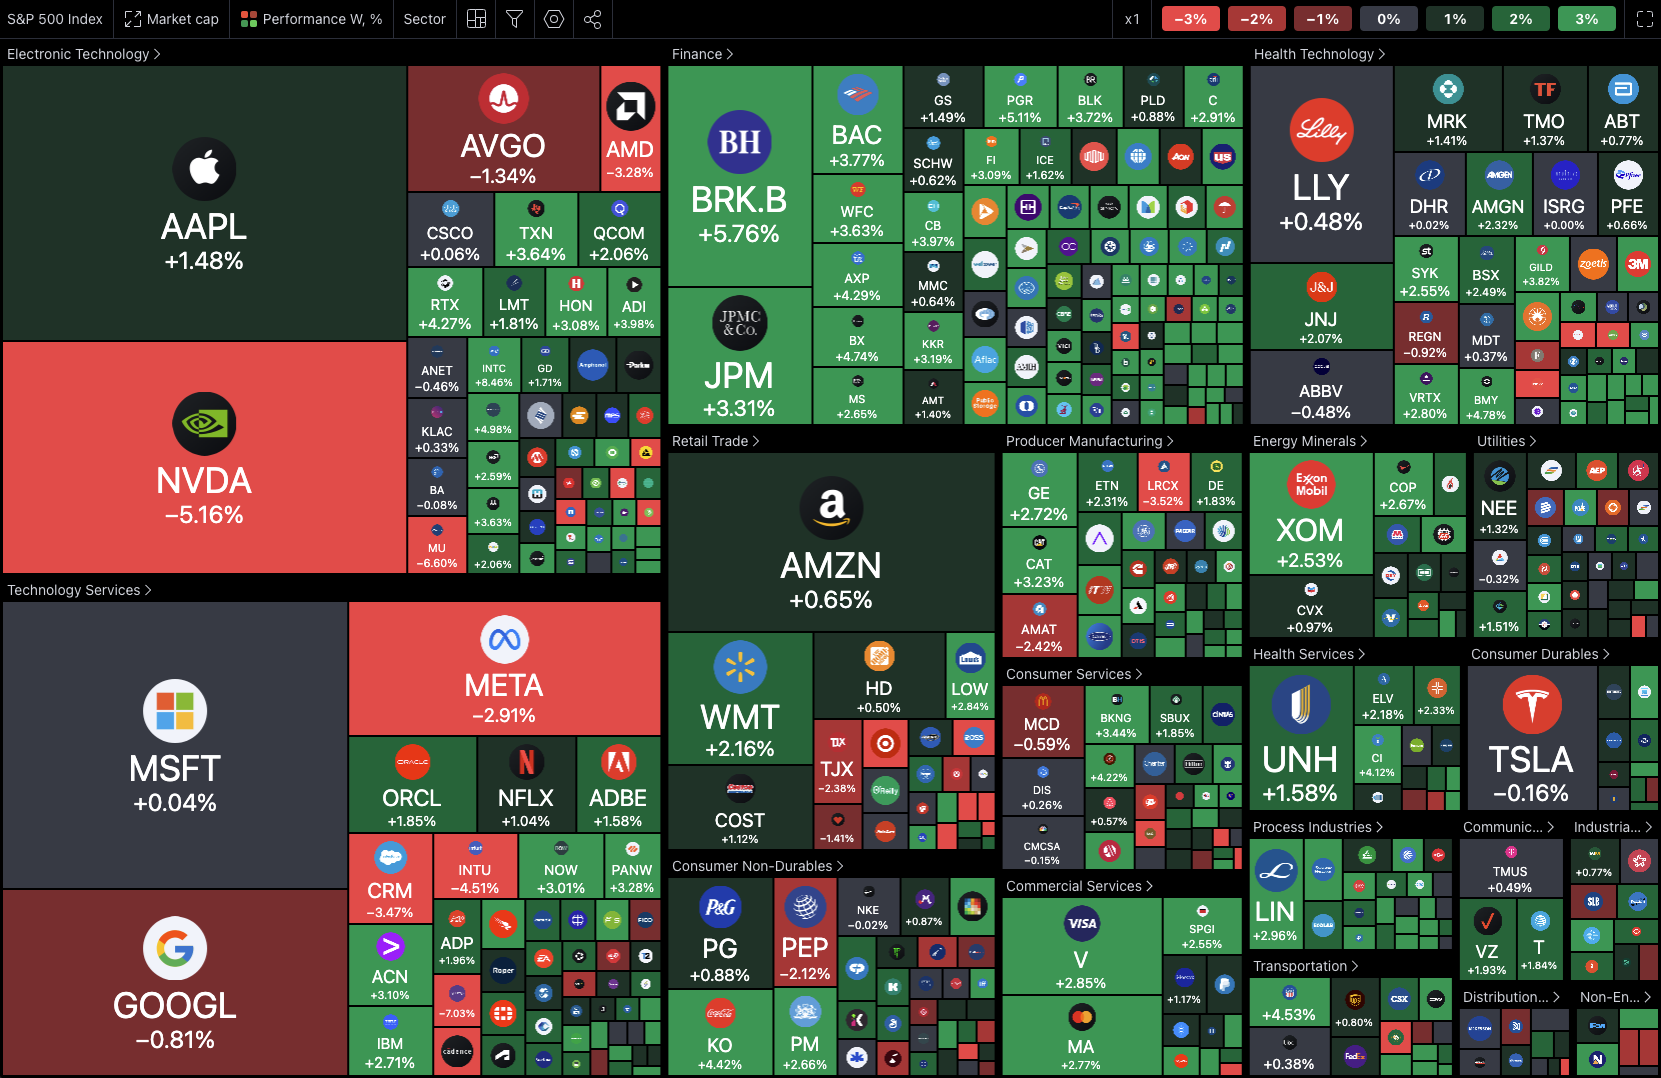
As we’ve been discussing recently in our Community Discord, we think this market rotation and broadening out in participation increases the probabilities for the rally to continue in the near-term.
S&P 500 GEX Levels
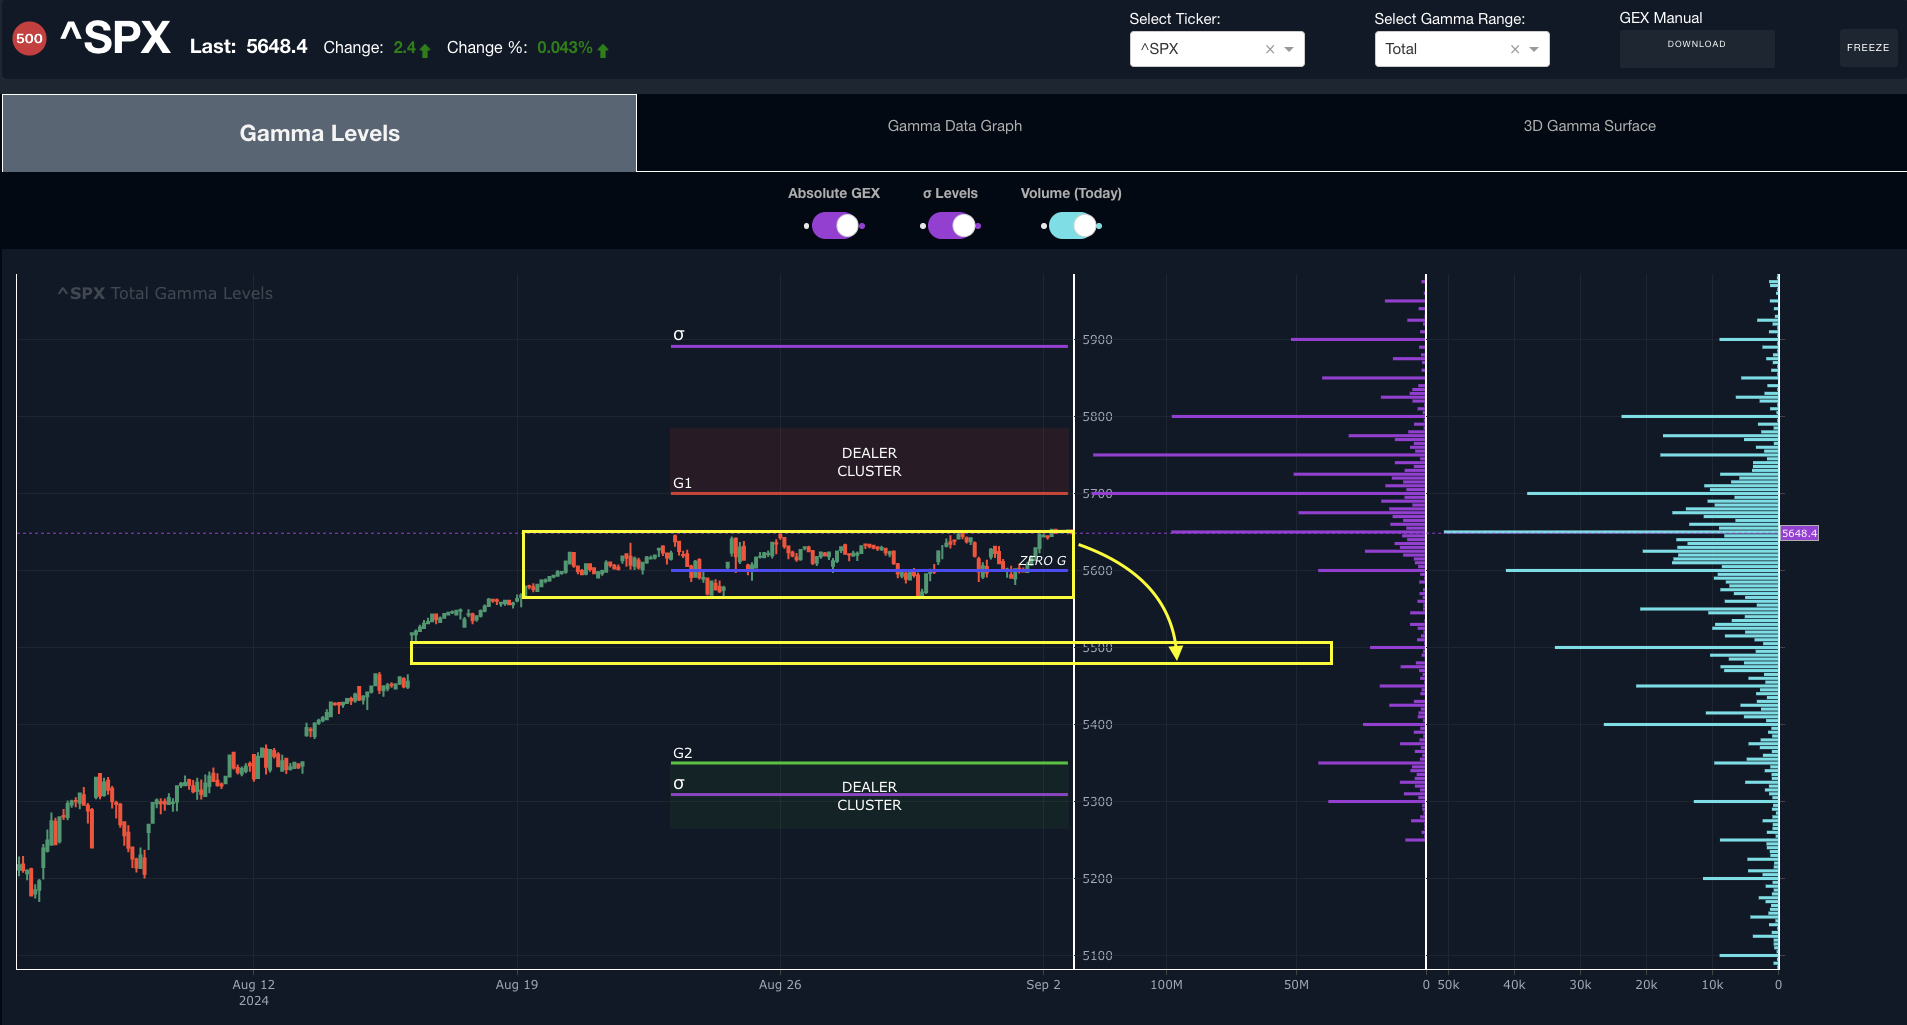
After the initial v-shaped rally in early August, the market is now consolidating around the 5600 level.
This level also coincides with the current Zero GEX level, so this appears to be a short-term decision zone for the market.
The GEX structure overall is skewed positively, with the largest GEX concentrations currently between 5700-5800 on SPX. This tells us market participants believe the market is setting up for a breakout of the recent tight range and ultimately another leg higher.

So our base case scenario is for a breakout higher in the near-term and a resumption of the up trend, with the large positive GEX concentrations at 5700 and 5750 as our first targets in September.
Based on current GEX levels, a speculative market path could look like the below, trending higher into the Dealer Cluster zone currently between 5700-5800.

However, an alternative scenario could be for a breakdown out of this consolidation zone back into the 5500 strike, before enough buyers are able to step back into the market.
5500 coincides with a large market gap and we saw some decent volume coming in at this level on Friday as well.
So while its not our base case, we want to have a view of potential paths the market could take, to aid us in positioning our portfolio for multiple possibilities - something that is only possible to achieve using the options market.
In general, we aim to structure our portfolio to take advantage of multiple path outcomes using various option strategies, which you can learn more about in our Geek University course - free for all members.
But the below graph shows just how positively skewed the GEX structure is and this, combined with expanding breadth, is a large part of our rationale for expecting another leg higher in September.

As we point out above, the largest GEX strikes are 5700 and 5750, but market participants even appear to be positioning for a possible move towards 6000 by year end.
Obviously the probabilities decrease for larger upside moves as we go up the options chain, but this just illustrates the range of possibilities that some market participants are preparing for.
We’ll continue to discuss these ideas and others in the coming week - We invite you to check out our community discord for our latest market conversations.
If you’re interested in learning more about our strategy approach, we address all of these topics in our Geek University course which is included in all memberships.
If you’re interested in accessing our tools and analytics, be sure to check out our website!
Thanks for being part of our community and know that we invite your feedback!
We have a variety of educational videos on YouTube as well!
The information provided by Geeks of Finance LLC is for educational purposes only and is not intended to be, nor should be construed as, an offer, recommendation or solicitation to buy or sell any security or instrument or to participate in any transaction or activity. Please view our Investment Adviser Disclaimer and Risk Disclosure.