
Tactical View: Whipsaw Wednesday?
Last week we shared some positive points as well as negative points, but the VIX touching a low of 14.78 (we were eyeing 14 as a possible target) and QQQ hanging out in the red Dealer Cluster Zone where we expected consolidation/selling seem to have been vindicated today. We said we wanted to see a “deeper pullback” before further upside attempts, and we certainly got it. We also wanted to see NVDA hit 110, which was elusive late last week, but today took care of that as well.
Is this going to be a historic September for bears or an anomaly for the bulls? We aren’t going to take that gamble just yet, but let’s go one day at a time and see if gamma (GEX) positioning and other clues can lead us to a profitable month. Maybe we will find opportunities in both directions, for that matter.
So far, selling in SPX seems orderly in that we are ping-ponging between resistance above and support below. We need a break of 5480 (the middle Keltner channel using daily settings) to hold if we are to see another 200 points of possible downside. Holding below the Hull Moving Average last week was another supporting point for bears, and we remain below that line, so even a rebound here doesn’t mean we’re out of the woods.
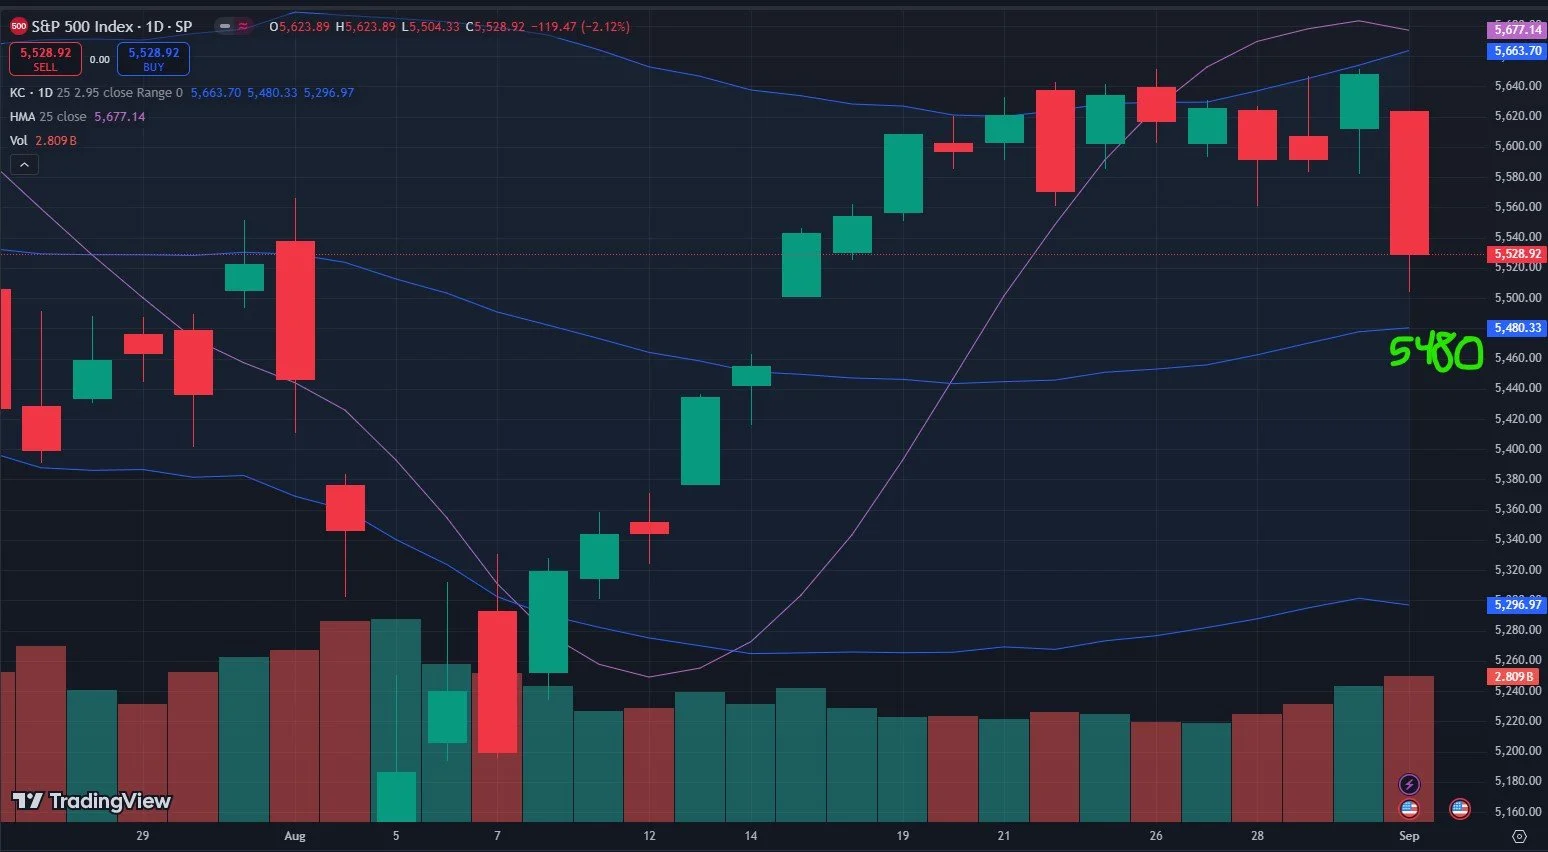
SPX chart: TradingView.com
SPX, which showed 1.5B positive GEX as of Friday, is now at a negative 529M, a testament to how quickly GEX swings these days due to the short-term nature of GEX positioning in many cases. This level is technically neutral, despite the very negative flow that led to the huge GEX (and price) reversal.

SPX historical GEX: www.geeksoffinance.com
We’ll spend more time talking about QQQ today than SPX. At first glance, QQQ’s chart looks noticeably weaker than the SPX chart. We’ve lost the middle Keltner channel using daily settings, so I switch to the next highest timeframe when that happens to see if I can find any possible area that might represent the target or support. In this case, the weekly settings reveal 457.91 as a potential area to watch, which isn’t very far away at this point. This doesn’t mean the drop is over at 457.91, it simply means we might see a countertrend bounce, though obviously we want to include other factors in assessing whether or not we want to take the risk of positioning long once that price arrives (if it arrives).

QQQ Chart: TradingView.com
QQQ GEX is approaching the area that marked the August 7 GEX low, which was two days after we saw a price low for QQQ and the beginning of a major recovery from 423 to 485. Such contrarian moves do not HAVE to happen every time, but as a contrarian, I definitely get a little nervous holding with the trend when we are approaching levels that recently proved to be good exits for shorts/entries for longs.

SPX Historical GEX: www.GeeksOfFinance.com
Adding to the case for some sort of at least temporary rebound, QQQ is entering a Dealer Cluster Zone at 460 where we might see buying activity and/or consolidation. I notice volume was elevated at 470, though I don’t have any conclusions from that, except that we saw a lot of activity near the zero gamma level.

QQQ GEX Levels, www.geeksoffinance.com
A closer look at the 3D chart also reveals a lack of significant GEX interest below 450 (ignore the very large negative cluster since that represents today’s expiry), and we have substantial positive GEX still remaining for September 20 at 480 and 480 strikes.
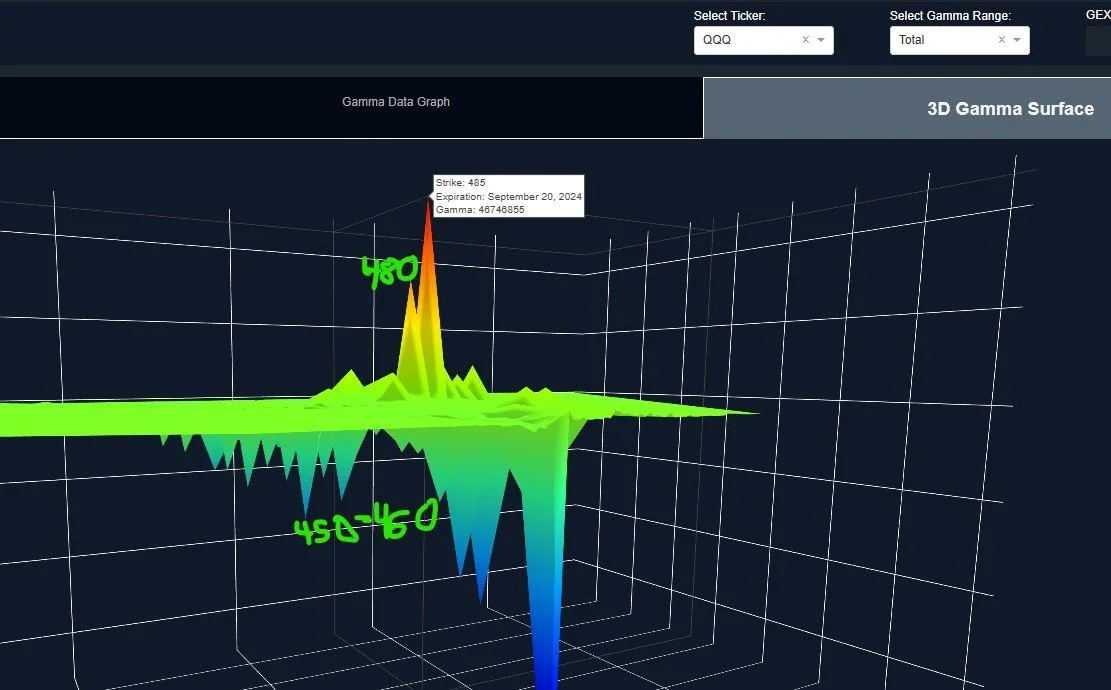
QQQ 3D Gamma Surface: www.geeksoffinance.com
Related to QQQ, we saw NVDA reach our 110 target mentioned last week, and in typical totally crazy fashion for this stock, it overshot to the downside, after hours reaching the middle Keltner channel on the weekly chart at 106.97. I marked the area but I wanted to focus on the daily Keltner settings, which show 99 as the lower channel boundary.
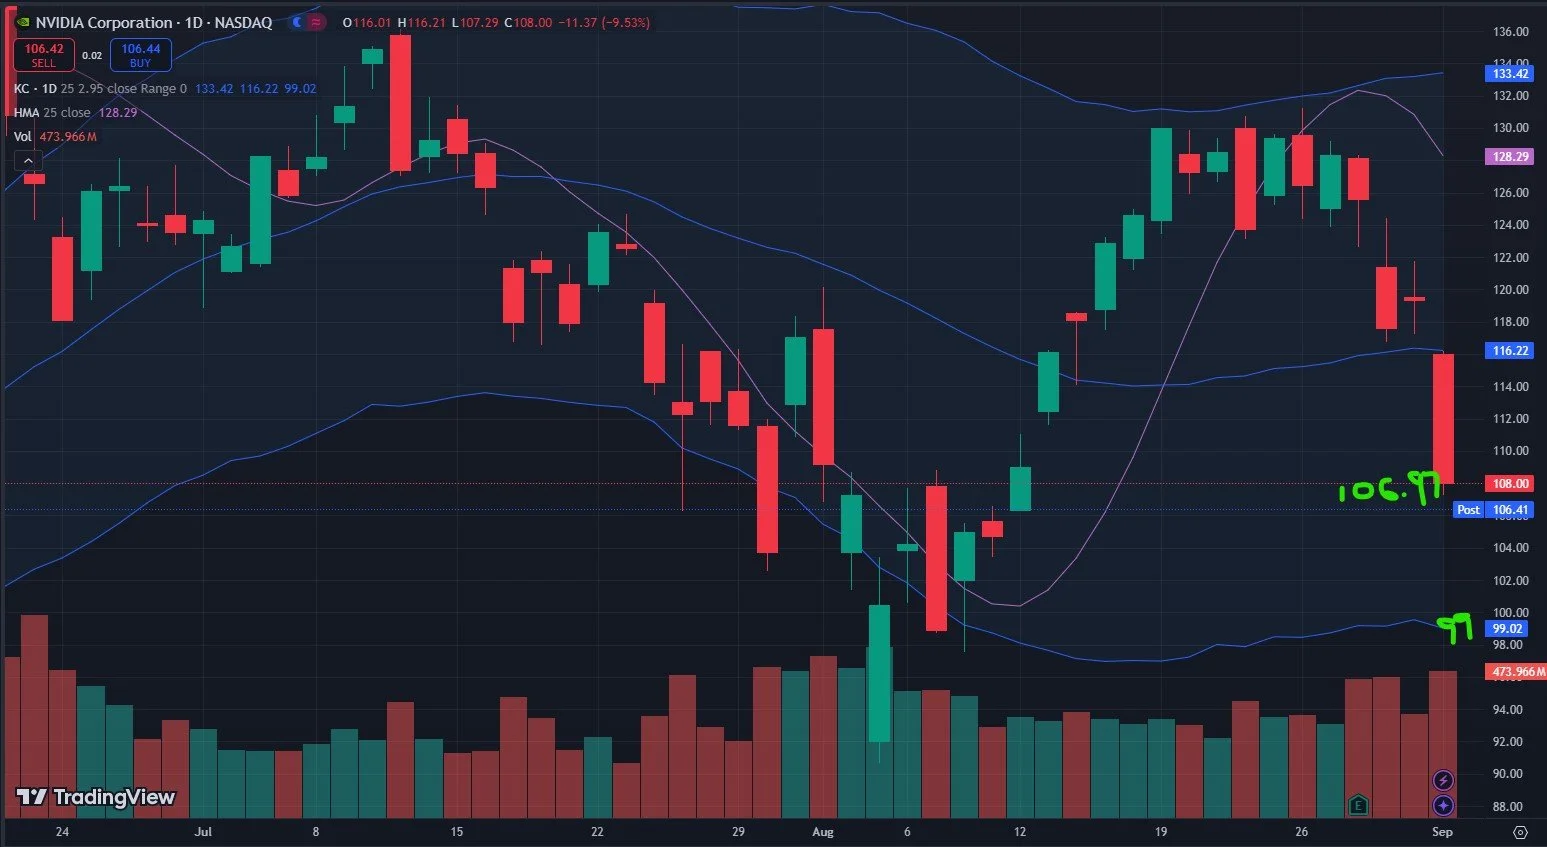
NVDA chart: TradingView.com
The potential 99 lower Keltner target is very close to the NVDA 100 Dealer Cluster Zone, so I don’t know if we’ll reach that, but multiple indicators/positioning metrics back this as a possibility with decent odds.

NVDA GEX Levels: www.geeksoffinance.com
What Possible Triggers Will Algos Watch Wednesday?
In conclusion, we have a larger view bearish development, but we are approaching a zone where a bounce of some magnitude might unfold. We especially see quite a few economic releases Thursday, but even tomorrow has a handful of possible triggers that may accompany trend changes or accelerations. JOLTS at 10 AM ET and the Fed Beige Book at 2PM ET are the most noteworthy tomorrow, so at least they’re after the market opens, when we like to take a fresh look at how GEX positioning is shaping up. We’ll share some of what we’re seeing in our Discord group, so join us in our free channel and we’d love to have you there.
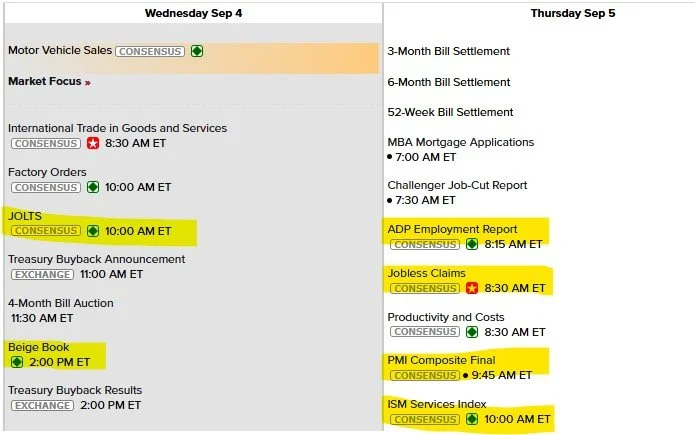
Economic Calendar: www.econoday.com
If you’re interested in learning more about our strategy approach, we address all of these topics in our Geek University course which is included in all memberships.
If you’re interested in accessing our tools and analytics, be sure to check out our website!
Thanks for being part of our community and know that we invite your feedback!
We have a variety of educational videos on YouTube as well!
The information provided by Geeks of Finance LLC is for educational purposes only and is not intended to be, nor should be construed as, an offer, recommendation or solicitation to buy or sell any security or instrument or to participate in any transaction or activity. Please view our Investment Adviser Disclaimer and Risk Disclosure.