
BIG Website Updates, Big Week For Markets!
In today’s special edition of your favorite free newsletter of ALL TIME (wait, was my insurance guy lying to me?), we’ll briefly cover some major updates released for our subscribers on our website, go over markets and expand on some points we made today on our new YouTube video, then circle back to take a closer look at the website. We hope you’ll all consider our service, but even if not, thanks for staying involved via our newsletter and Discord channel, where we regularly share free insights and we invite discussion.
A Brief Overview of What’s New On www.Geeksoffinance.com:
VWAP Flow/Top Flows - Analyze the largest Premium Traded/Volume contracts for a given stock and find breakout/breakdown zones based on VWAP.
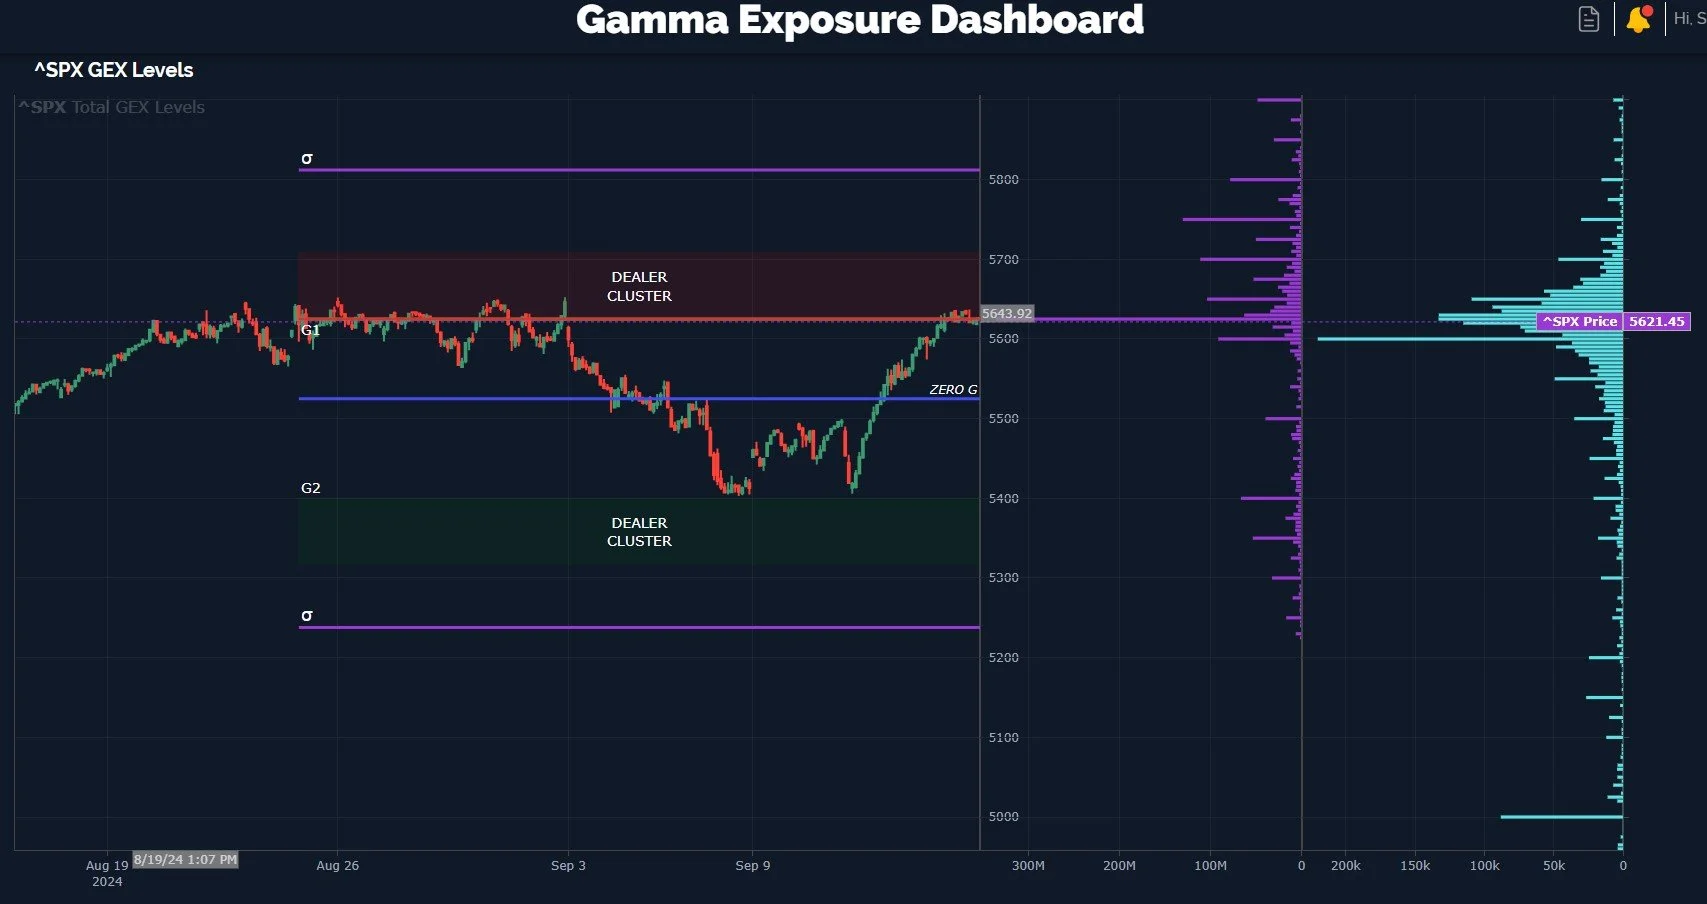
GEX Levels Chart - Analyze the top 3 largest positive/negative GEX levels for the Total, Weekly, and 0DTE timeframes.
Increased speed of GEX updates (every 30 seconds)
GEX Flow graph updates every 1 minute (*coming this week)
Improved price updates to real-time
Chart navigation upgrade (*more upgrades coming soon including technical indicators)
Improved functionality and navigation on mobile version
We also improved site navigation, removed several known bugs, and the site should load faster in general. Know that this is a beta version, so while we’ve done a lot of testing already, you’ll see additional improvements very soon and we invite your own feedback!
What Do We See Ahead For Markets This Week?
As mentioned in the YouTube video today (click here to watch the short video), SPY and SPX had a nice 4%+ move recently, virtually in a straight line. Is this the beginning of a lasting breakout that will send bears into a permanent state of hibernation, or is this yet another fake-out doomed to fail? Will SPY 560 prove to be lasting support, or is this the last time it will appear to be any sort of support?
We have a significant data week, with the Fed rate decision Wednesday, also coinciding with monthly VIX options expiration on the same date. Sounds like a powder keg to me..Though the direction is still unknown.
SPX Keltner channels certainly look bullish, with lower and upper bands pointing higher, and price above the middle Keltner. This opens up 5700+, which also coincides with the top edge of the gamma (GEX) Dealer Cluster Zone we’ve currently identified, so we are paying attention, if we get there.

Our SPX GEX Levels chart reflects areas we identify as Dealer Cluster Zones (where dealers might be buying or selling) utilizing GEX data. We bounced off of the green zone perfectly, now we are in the lower realm of the red zone, which does extend over 5700. Note the larger purple GEX cluster at 5750 relative to any other cluster outside of Friday’s largest cluster? That’s a data point to note as we see any potential attempt to press higher. We will also note the change in GEX and shifts in GEX levels as we approach Wednesday.
SPX total GEX continued rocketing higher last week, reaching 1.379B, the highest level since Aug. 30, and Aug. 23 before that. Note the lower high this time, and also that previous times exceeding this “bullish” level were tops. We typically consider over 1B GEX to be a positive, but it’s worth noting that the broader consolidation we’ve seen has instead shown high GEX to mark tops. That said, we need to consider total GEX in conjunction with other indicators that we (you) find to be useful and mostly accurate so we can make informed decisions about our trades.
With GEX positive, our bias is positive. But with other indicators (and implied volatility) giving reasons to be cautious in the near-term, we may be inclined to not pile in after a big move, but instead wait and see if we get a better entry, or hedge any new long exposure we may take. We will be discussing these thoughts more in our Discord channels.

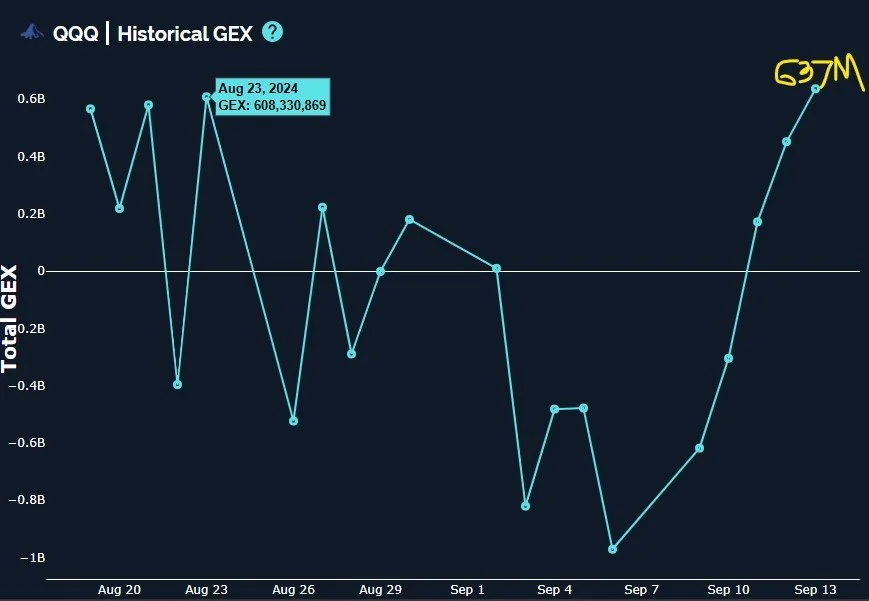
SPX Historical GEX: www.geeksoffinance.com
A brief look at QQQ, which looks very similar to SPX, unsurprisingly, shows a slightly less bullish overall chart. QQQ is still above the middle Keltner though, and above the Hull Moving Average, so even a pullback to 460 or so may be a decent long entry as long as GEX also backs what we’re seeing on the charts.

Similar to SPX, QQQ GEX has rocketed to the most positive reading it’s had in almost a month, also coinciding with readings that recently have marked short-term tops. Only the future will tell whether this time around is another contrarian signal, or if we are about to go a lot higher (492 is currently the upper Keltner channel on the daily chart).
Another important note regarding all indices: The environment for at least the last 18 months (since the failure of Silicon Valley Bank?) has been characterized by rapid and dramatic changes in GEX and a focus on shorter timeframes, so we have to be watchful for the 0 DTE crowd to quickly move the goalpost. Our intraday Discord analysis and GEX data have been very good at capturing many of these key pivots, but the buy and hold investor is left with quite a picture of uncertainty over the long haul at the moment.
We’ll be sure to look at the VIX again before Wednesday morning’s expiration, but for now, we see big GEX clusters at 16 and 17 (only 17 shown) on the negative side, with 20 as the largest cluster on the positive side. 15 is also present. Does this mean we are likely to close somewhere between 16 and 20? I can understand the reasoning behind such a pin (to kill premium on both sides), but ultimately, we will have to wait and see.
Join us in Discord and keep an eye on our analysis over the next couple of days and we’ll see if we can tilt our edge just enough to benefit from the upcoming volatility!
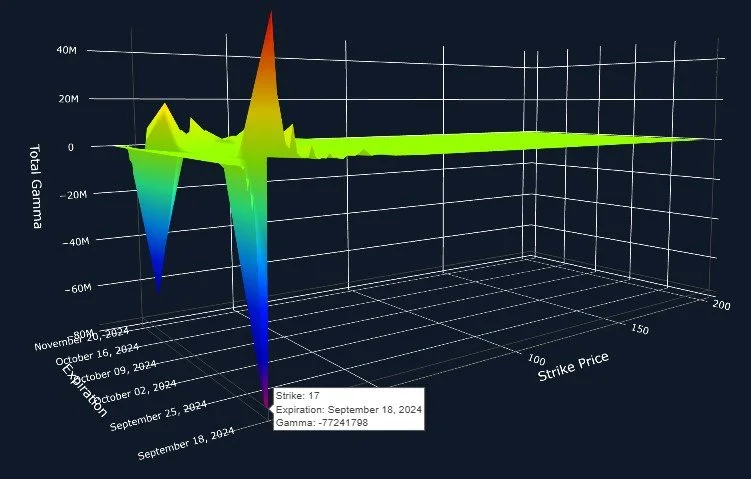
VIX 3D Chart: www.geeksoffinance.com
Additional Details On The Web Improvements:
Thanks for bearing with us to this point in the newsletter! Initially, we said we upgraded our GEX Levels Chart to “Analyze the top 3 largest positive/negative GEX levels for the Total, Weekly, and 0DTE timeframes.” Here’s an example of that:

We also mentioned the VWAP Flow/Top Flows tools, allowing you to analyze the largest Premium Traded/Volume contracts for a given stock and find breakout/breakdown zones based on VWAP. We’ll be addressing a number of potential strategies, which (when incorporated with GEX) might lead us to going long over VWAP, short below, and a number of other possibilities. We will be adding to our indicators and creating tools we hope you’ll find useful in your own journey in coming weeks/months ahead!

join us in our free Discord channel (or become a paying subscriber for a lot more) And we will share some real-time updates on how we see GEX shifting in the 0 DTE markets. Hopefully you’ll join us!
If you’re interested in learning more about our strategy approach, we address all of these topics in our Geek University course which is included in all memberships.
If you’re interested in accessing our tools and analytics, be sure to check out our website!
Thanks for being part of our community and know that we invite your feedback!
We have a variety of educational videos on YouTube as well!
The information provided by Geeks of Finance LLC is for educational purposes only and is not intended to be, nor should be construed as, an offer, recommendation or solicitation to buy or sell any security or instrument or to participate in any transaction or activity. Please view our Investment Adviser Disclaimer and Risk Disclosure.