
Another Failed Rebound
Tonight’s YouTube video covers our in-depth base view of what we want to see from the market in order to feel more confident that a larger move up is in play, and I’ll complement that analysis with some additional points on IWM and QQQ. We also discuss some individual tickers including BTC, GOOGL, TSLA, and META, so check it out on YouTube by clicking here.
Indices tried to rebound twice today, once noticeably in the morning and once this afternoon, demonstrating the wide range we expect when we’re in a negative gamma environment. We are starting to see more noteworthy signs that a bigger bounce may be near, so let’s take a look at a few divergences.

First of all, let’s look at IWM’s chart above. IWM is so oversold on the daily chart that I zoomed out and looked at the Keltners using weekly settings. My belief is that larger timeframes carry more weight/significance, and weekly parameters may become especially helpful if we have blown out to statistically less likely areas beyond the daily parameters. IWM is not far from the lower weekly Keltner just below 199. We’ve seen volume at the 200 level for a few days, and today’s low was just over 203, so we are definitely in the ballpark. I like that IWM was able to print a green candle today, and an indecision candle, this is what we want to see for potential reversals.
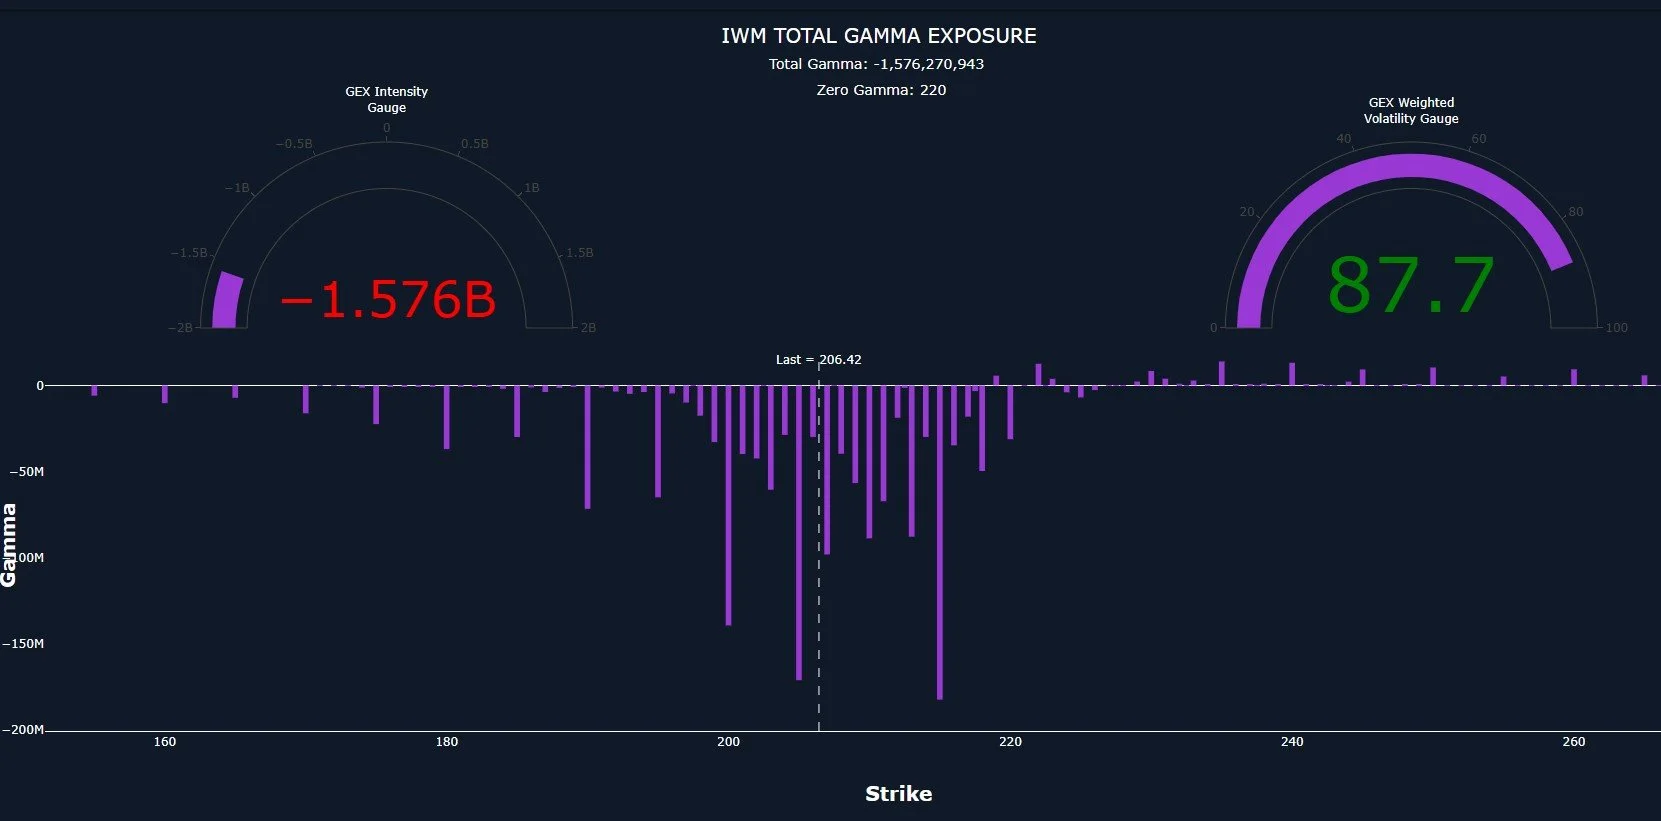
IWM’s Gamma Exposure (GEX) Data Graph shows negative GEX nearing an extreme, almost to 2B. Extreme GEX readings (compared to prior 52-week readings using our GEX Intensity Gauge) can accompany powerful reversals in the opposite direction as too many participants end up on one side of the boat, causing it to capsize. We almost reached the last large GEX cluster at 200, which we mentioned is near the lower weekly Keltner channel, so we may be in the territory for a fairly quick rebound. One thing we’ll want to watch is whether or not the GEX at 190 and 195 is growing or staying static/shrinking as IWM approaches 200. Failure to see GEX grow at those levels, while not a requirement, may signal that IWM is nearing the end of its disciplinary beatings.
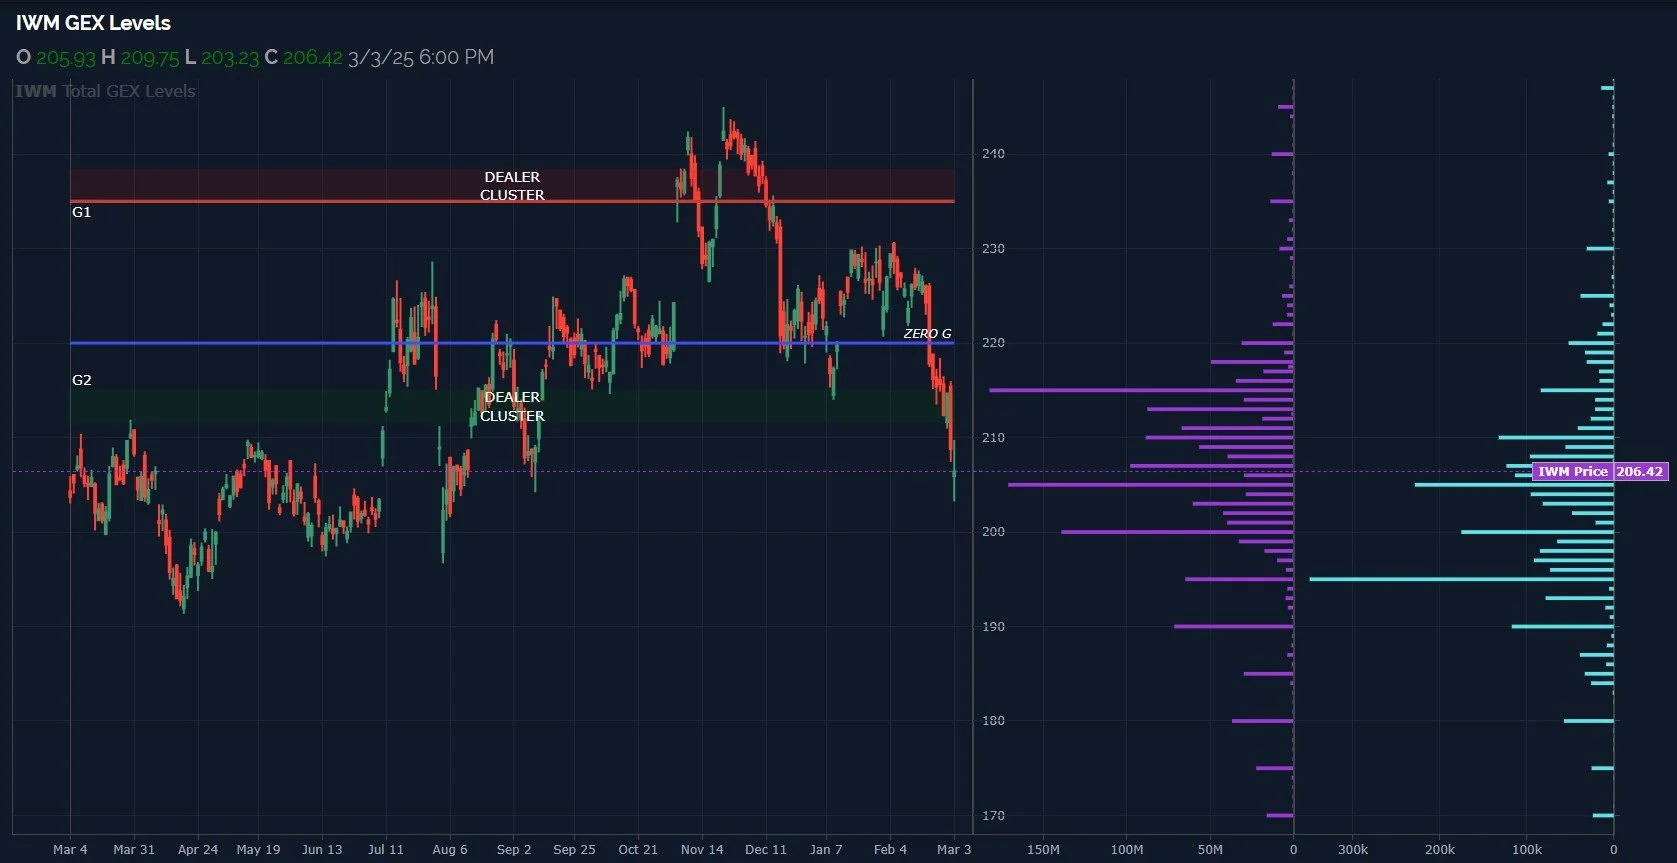
Looking at the GEX Levels chart below, we can see the candle better than on the chart I posted earlier, which is potentially a reversal candle. We still see high volume at lower strikes (volume is represented by the light blue, GEX is the purple), including at 195, but just as we said in the YouTube video about the VIX, participants looking for a tag that far down may be too late to the party, though we can’t say for sure just yet. The second half of the week will be telling.
While SPX closed in the red, QQQ printed a similar candle to IWM, which is very interesting given how many days have been long, red candles lately. I also like that we are approximately at the trendline going back to the low retest point that occurred in early 2023. Each low since then has bounced off of this trendline and continued higher. This very well could be the end of the trend, but we aren’t trying to time that, we want to stay hedged while going with the highest probabilities. The Hull moving average is just under 504, I’d like to see QQQ close above that to signal that it’s self-mutilation campaign is ending.

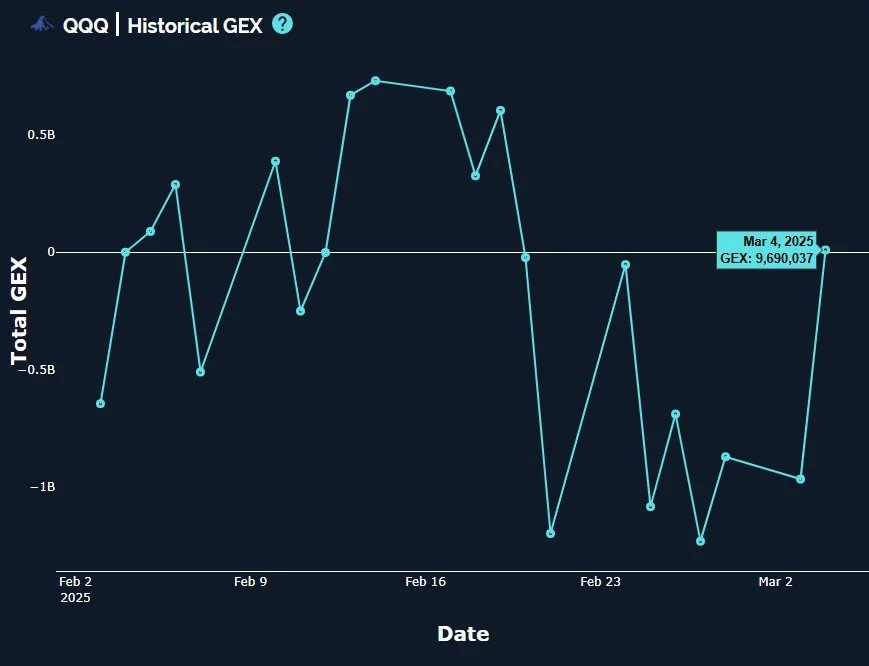
I had to rub my eyes after seeing this one- QQQ closed with positive GEX today. Wut? Yes, positive. I’ll throw that in the positive divergence file, though it’s not a guarantee that the bears have had enough salmon just yet.
In our YouTube video, we point out the volume seen at the 30 and 35 levels. Late to the party? One additional point I’ll make is that while those two outliers show higher volume, and the GEX at 30 is certainly large enough to warrant attention, the 15 through 20 strikes saw higher volume at each strike than strikes above 20.

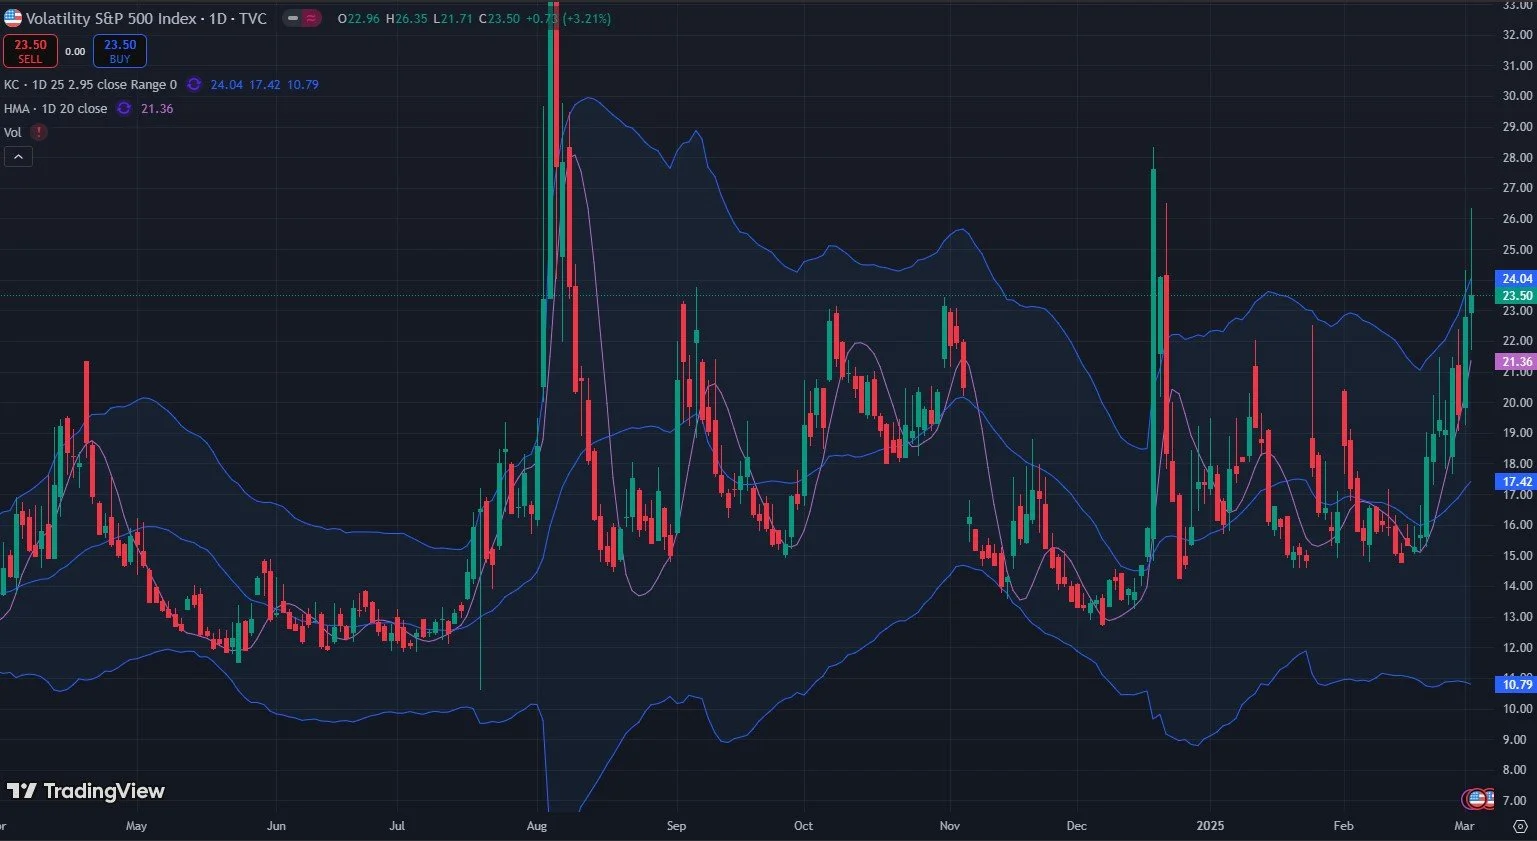
The VIX is still holding above the sharply ascending Hull, so I’d like to see the VIX lose 21.36 (the Hull may be 22 by tomorrow) to signal that the volatility spike is over. I see negative divergence today with VVIX red and VIX green, though VVIX wasn’t red by much. Is the index measuring future expected volatility of the VIX signaling a less volatile VIX looking ahead? We need a day where VVIX is down 10 points, not merely red on a technicality, so we’ll keep watching.
Here’s the Discord link if you haven’t joined us yet! Access is free for some channels, and new members have a 7-day trial within Discord to see how we operate. We have an active community of thoughtful traders who chime in throughout the day, sharing ideas and opportunities as we see them.
If you’re interested in accessing our tools and analytics, be sure to check out our website! We rolled out backtested algos and chart indicators today, which we’re really excited to announce!
If you’re interested in learning more about our strategy and approach, we address all of these topics in our Geek University course which is included in all memberships.
We recently posted a YouTube video, and we have many other short videos, so give our channel a look if you’re curious about recent market commentary and ideas as well as gamma (GEX) concepts explained.
Thanks for being part of our community and know that we invite your feedback!
The information provided by Geeks of Finance LLC is for educational purposes only and is not intended to be, nor should be construed as, an offer, recommendation or solicitation to buy or sell any security or instrument or to participate in any transaction or activity. Please view our Investment Adviser Disclaimer and Risk Disclosure.