
DIAmond In The Rough
2025 WINTER SUBSCRIPTION SPECIAL- Our Winter Special of $300 off of the annual Portfolio Manager subscription has been extended for a few more days as of today after reviewing several requests! We hope you’ll join us to take advantage of new tools going live Monday and our full tools and ticker coverage of 600+ securities! Enter code WINTER2025 at checkout.
Before we jump into our newsletter topics for this evening, here’s the link to today’s YouTube video. We cover a few ideas (various tickers) we won’t discuss here, and we do a more in-depth analysis of SPY and how we’re handling the various possible pathways going forward than we will cover in the newsletter as well. You can watch the YouTube video by clicking here.
As for Friday, a day that had the potential to go several ways, I was pretty happy to see what I would consider our “base case” outlined Thursday: We did make a lower low, and (using QQQ as a specific example below) we saw 500 as an important battleground, with QQQ initially losing it before mounting a strong rebound back over the line. I didn’t even redraw the yellow line I posted on the chart in Thursday’s newsletter, and look at how beautifully it functioned. Not even Picasso could draw a line that well placed.

Additionally, QQQ still has room to the upside before retesting the pink Hull moving average from below, currently at 516.43 but dropping rapidly due to the descent of the line. Just to be clear, a number of things can happen here: QQQ can drop again while the Hull tries to catch up (or down, I should say), we can see price continue higher to meet that line at a price likely lower than 516.43, or we can see sideways action while the Hull continues dropping. Most scenarios would have the Hull dropping below the price relatively soon, and I choose to maintain a long bias when we see price above the Hull, which is the condition this would create. The Hull is only one of several indicators and data points a trader can use, but it’s one of the first ones I look at to see where price might be headed next.
SPX is shown below, also staging a nice rebound, almost making up the prior day’s loss. SPX also came very cloes to the Hull. After such a big day Friday, I wouldn’t be surprised to see consolidation or perhaps a retest of the lows, and in fact we see futures having started with a large move up before turning negative. Volatility continues to be elevated.
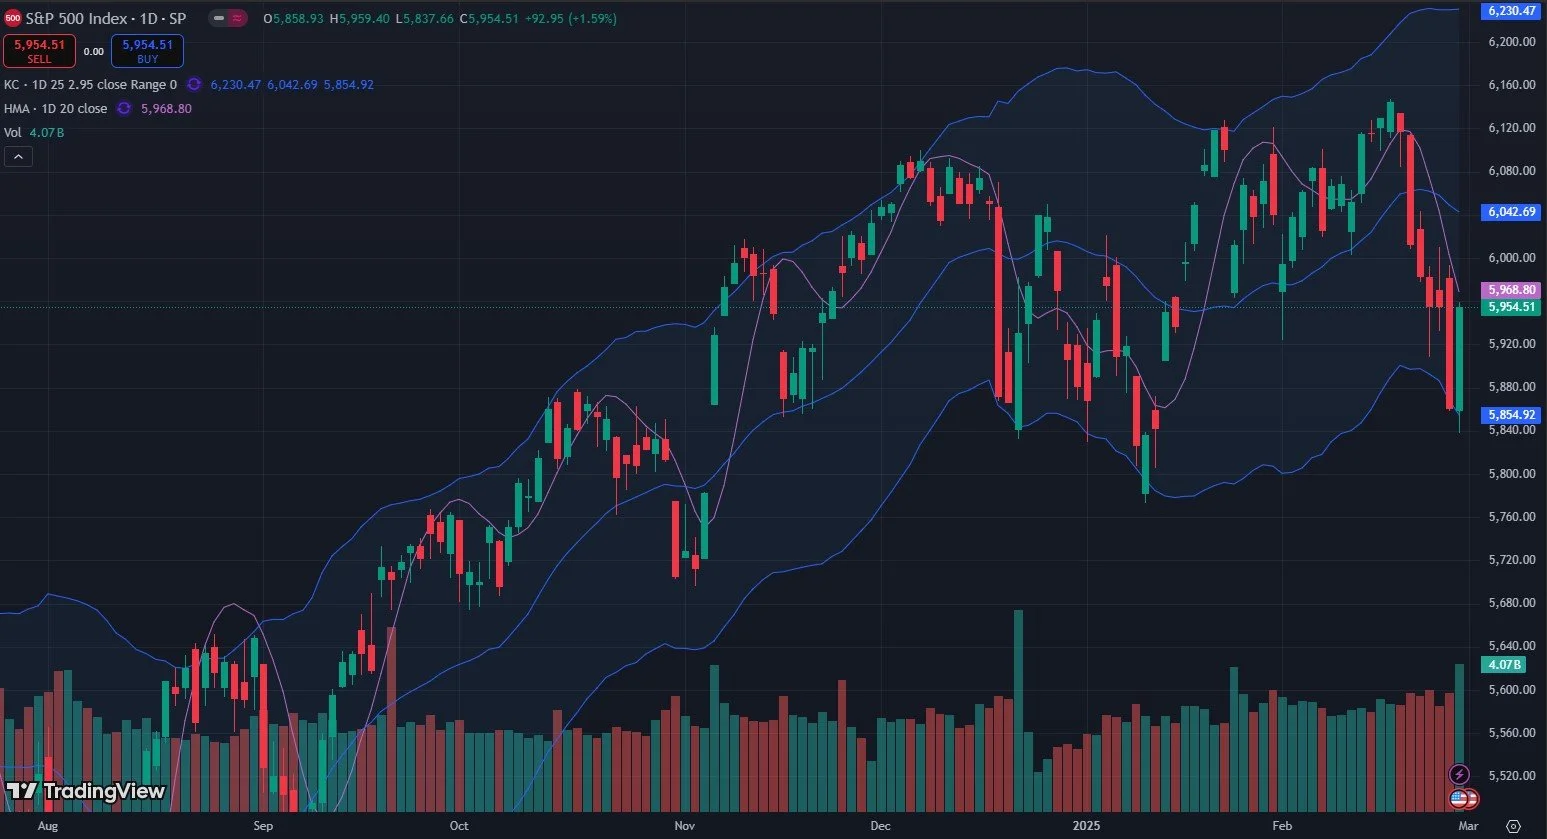
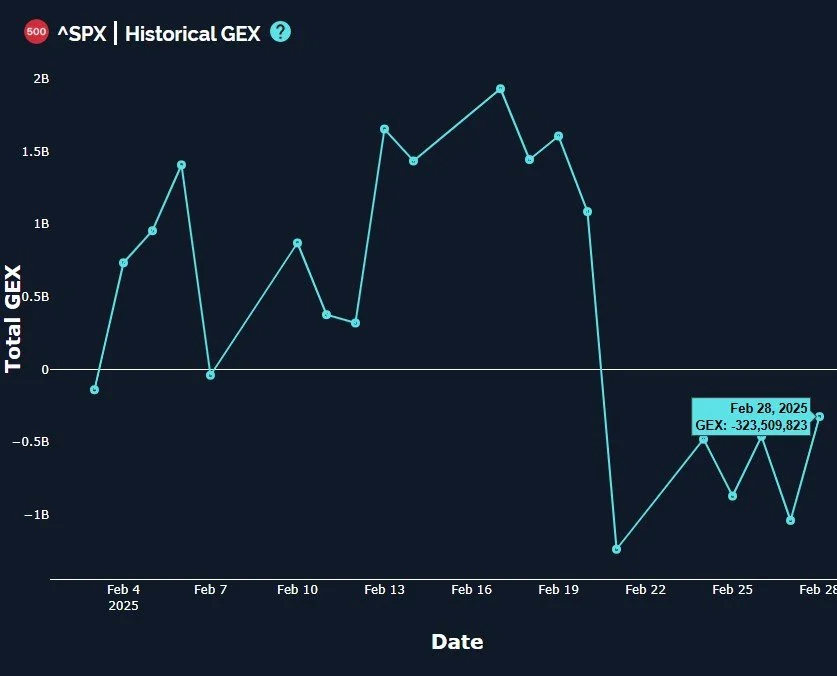
SPX gamma exposure (GEX) has improved significantly off of the lows, currently showing what we would consider a neutral (leaning negative) reading at -324M. This contrasts to SPY still showing nearly -2B, a fairly large disparity that may signal the impact of retail investors on SPY, a potentially significant contrarian signal that may give credence toward a continued bounce higher.
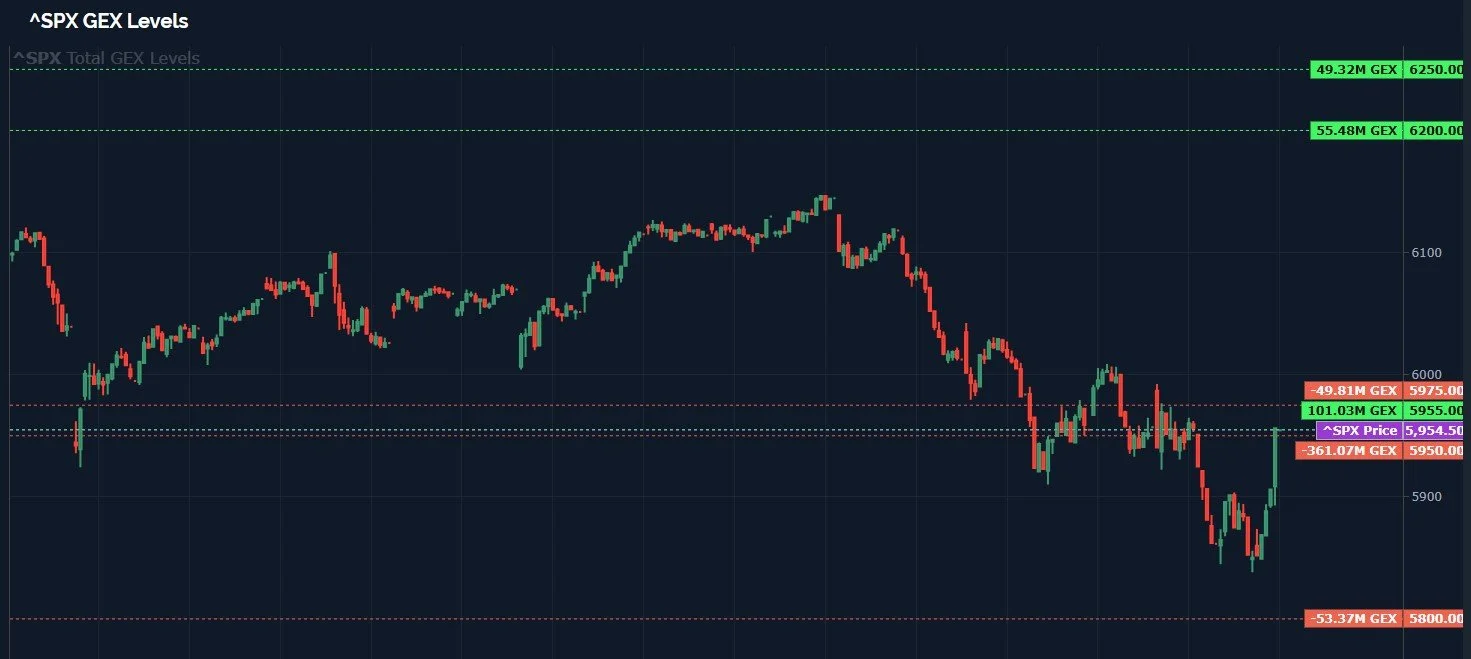
I included our GEX Clusters setting (a toggle on our GEX Levels chart) to show the largest GEX clusters, both positive and negative. You can see that 5975 is an important negative cluster, merely 7 points above the current reading for the Hull moving average. Perhaps that is next upside target that could be a short-term battleground. I would expect a large move up if we can hold above that zone, and failure may imply a move down toward 5800, at least barring any shifts in the top GEX cluster strike prices (which is why we watch intraday shifts in GEX too).
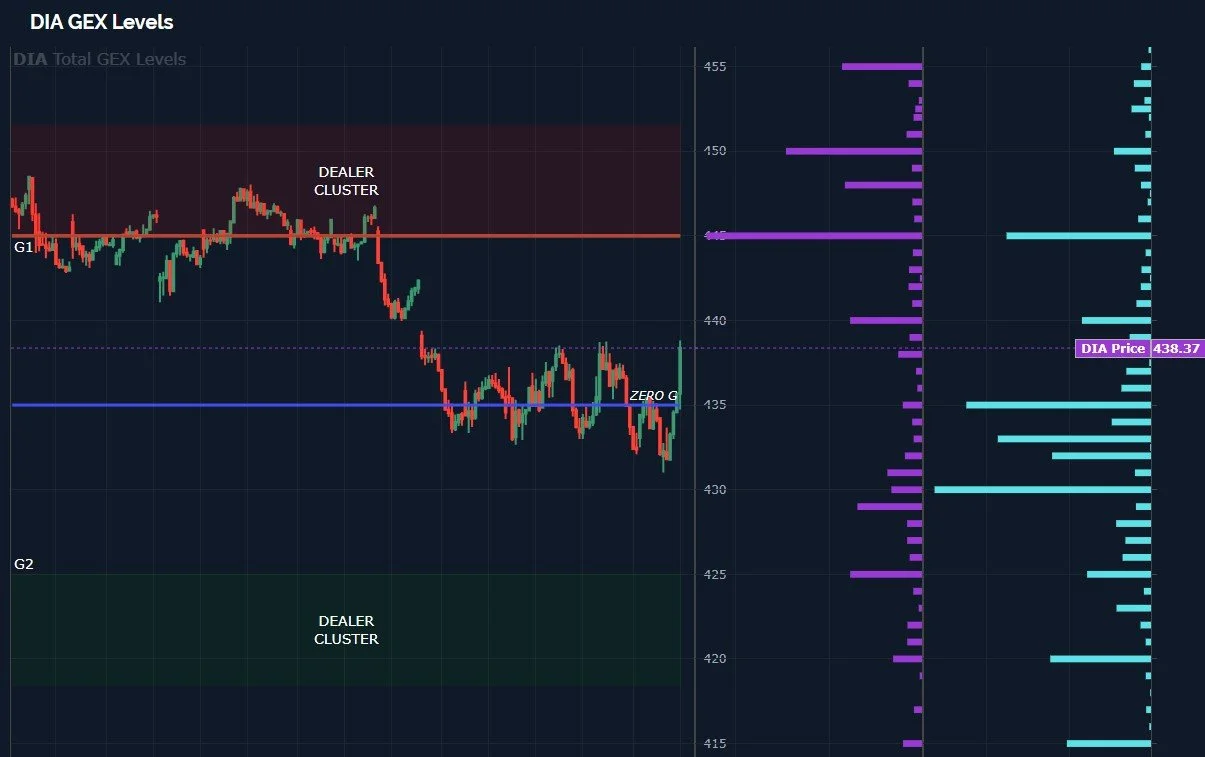
DIA was the first index to give us a green candle a few days ago, and as of Friday, it’s also the first one to close well above the Hull. I still wouldn’t be surprised to see a retest of 434 or lower, but as long as the daily close is above 434, I will be watchful regarding more potential upside. The middle Keltner channel is at 443.30, the next spot I’ll be watching to the upside. The upper Keltner channel at 456.40 is actually pointing slightly up, signaling that in general we might be facing a more volatile environment than we’ve been accustomed to in recent years. Upcoming days and weeks will be telling!

DIA almost tagged 430 on Friday before rebounding, and we see a lot of volume (the light blue bars) between 430-435. Notice the outlier volume and the large GEX cluster at 445? Most of that is clustered around the March 21 expiration. I see 445 as a live target by that date.
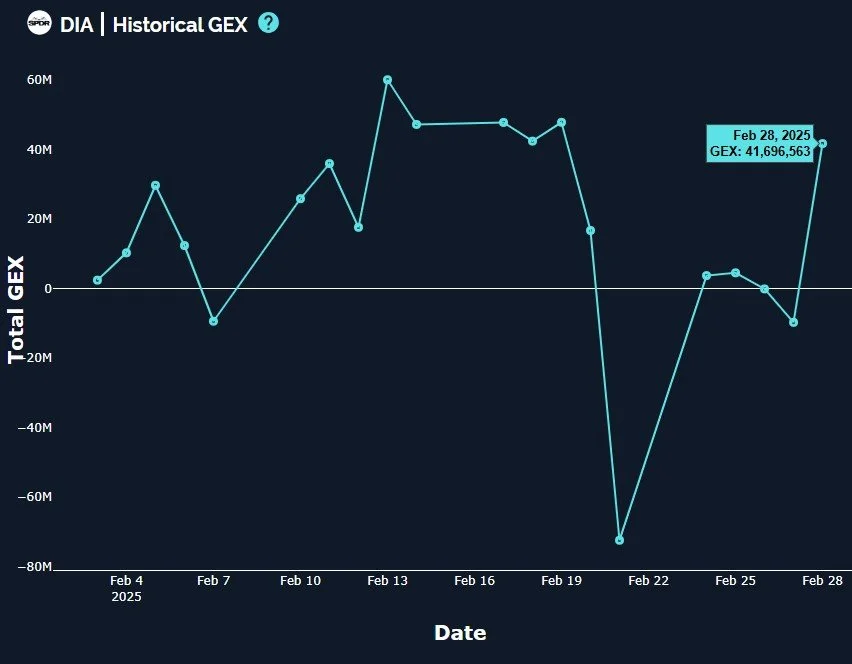
DIA’s GEX is consistent in backing up what we see with the price action and the volume Friday, with GEX moving more positive, a sharp rebound off of the February GEX lows. We’ll continue monitoring DIA as a potential “canary in the cobalt mine (we have to modernize these old sayings)” for a continued rebound of other indices as well, and the action surrounding the next inevitable red day will be very telling as well.
Lastly, the VIX reached 22.40 Friday, very close to the 22.50-23 we said may be the target, pulling back sharply by the end of the day. Sharply, but maybe not sharp enough..The VIX is still holding the Hull at 19.27, and the upper Keltner is still rising, potentially signaling that the VIX still has a little life left in it (or maybe a lot of life over a short period of time). I want to see that Hull broken to the downside to indicate a more lasting market rebound. For now, the VIX leaves some uncertainty in the short run, backing the view that even a continued rebound into mid-late March may first see additional backtests or attempts to the downside. We’ll be flexible in adjusting our exposure as we remain flexible in this volatility.

Here’s the Discord link if you haven’t joined us yet! Access is free for some channels, and new members have a 7-day trial within Discord to see how we operate. We have an active community of thoughtful traders who chime in throughout the day, sharing ideas and opportunities as we see them.
If you’re interested in accessing our tools and analytics, be sure to check out our website! More improvements coming by Monday including backtested algos and chart indicators!
If you’re interested in learning more about our strategy and approach, we address all of these topics in our Geek University course which is included in all memberships.
We recently posted a YouTube video, and we have many other short videos, so give our channel a look if you’re curious about recent market commentary and ideas as well as gamma (GEX) concepts explained.
Thanks for being part of our community and know that we invite your feedback!
The information provided by Geeks of Finance LLC is for educational purposes only and is not intended to be, nor should be construed as, an offer, recommendation or solicitation to buy or sell any security or instrument or to participate in any transaction or activity. Please view our Investment Adviser Disclaimer and Risk Disclosure.