
Early Signs Of A Pulse?
2025 WINTER SUBSCRIPTION SPECIAL- Our Winter Special of $300 off of the annual Portfolio Manager subscription only has a short time remaining! We’ll be rolling out even more new features this week, including backtested algos and indicator overlays, so we hope you’ll join us for the ongoing improvement of our total offerings! Enter code WINTER2025 at checkout.
We just posted today’s YouTube video, where we discuss SPY, DIA, VIX, CMG, TSLA, HD, and WMT. You can watch it by clicking here. We’ll have a little overlap in today’s newsletter, but here we’ll primarily discuss SPX and DIA tonight. We saw quite a volatile day today, and SPX, QQQ, and IWM all closed red. But there’s DIA, standing strong like a diamond in the rough, closing green in a sea of red. Now you know why we’ve spent several days in a row highlighting DIA: This wouldn’t be the first time DIA led the next move.
I must admit it’s too early to celebrate, and too early to pass judgment whether or not we actually are beginning a larger bounce, but it’s encouraging to see a positive divergence from the “grandpa stocks,” as one of our esteemed colleagues called them in our Discord discussion.

We’ve noted the bullish configuration of DIA’s Keltner channels, and today’s attempted decline (which made a lower low than Friday) stopped almost right at the lower Keltner channel before bouncing. Now we have the Hull moving average to contend with near 440. I wouldn’t be surprised to see another effort by “the resistance” at 440, but typically we will see the declining Hull eventually cross under DIA’s price, which then creates a more bullish setup. A strong decline would see DIA continue declining, failing to regain the Hull, mostly what we’ve seen since late January for DIA. I thought we might see DIA make a move higher once it regained the Hull 5 days ago, which was incorrect, so note that my rule is to abandon my long positions below the Hull. Doing so when I was proven wrong on the gap down Thursday would have saved some pain ever since then…So having rules can be more practical than thinking you’ll always be right.

The GEX Levels chart above also seems encouraging, with the largest volume occurring at the largest GEX cluster, a positive cluster at 445. Note that 445 almost coincides with the 444 middle Keltner channel, so (for me) that seems like a reasonable initial upside target. We also saw volume at 430 that is worth noting, so we aren’t necessarily out of the woods yet.
DIA maintained positive net GEX for the 2nd day in a row, though barely above the zero line. I still consider this to be a positive on a relative basis, given the deeply negative -2.2B on SPY and -870M for SPX. Grandpa seems to have a stronger pulse at this time.

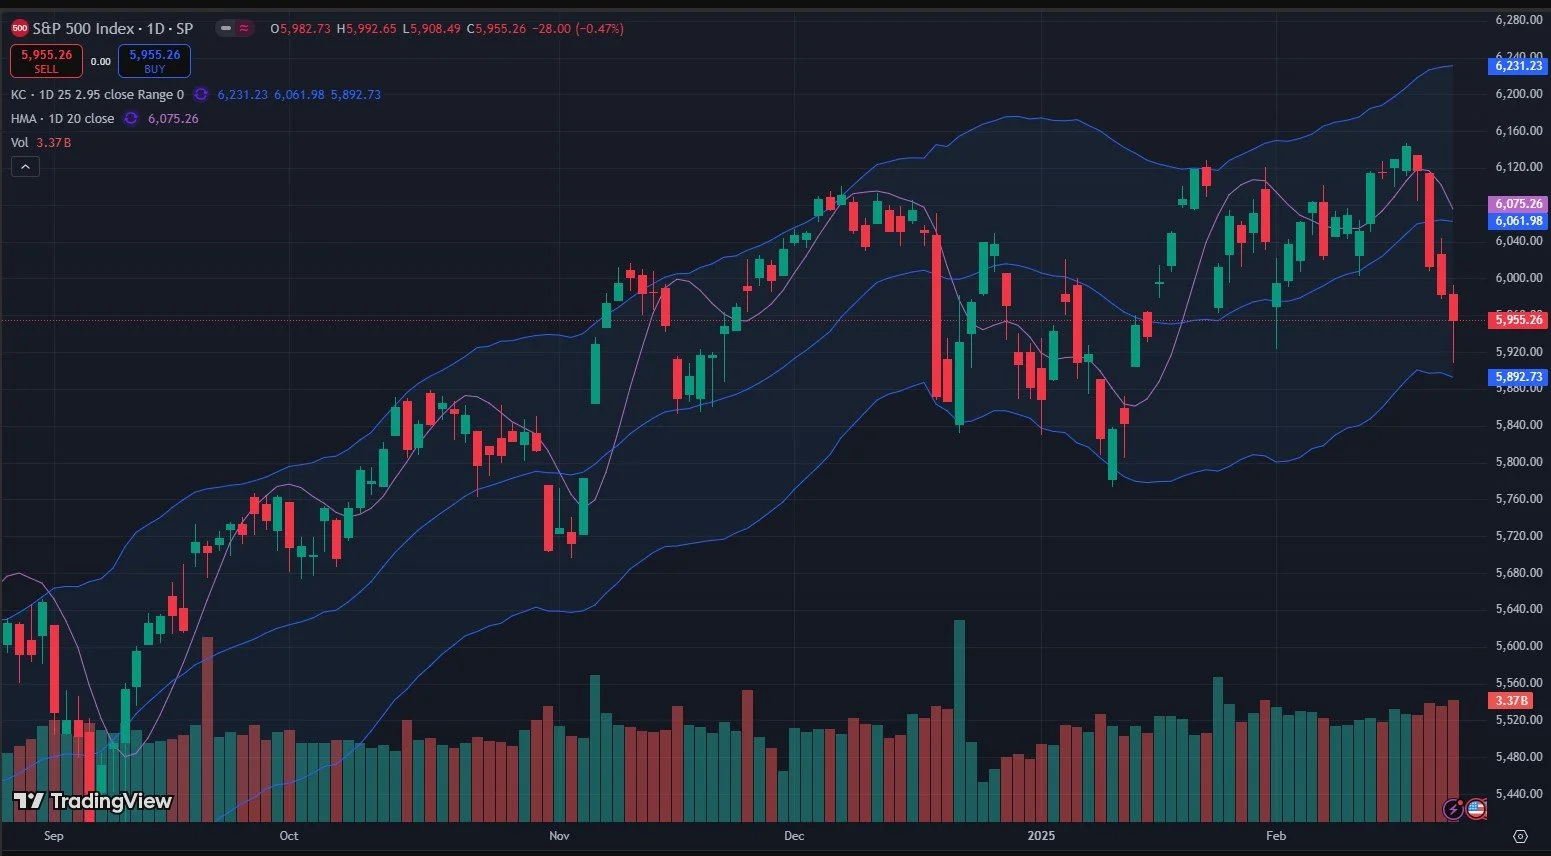
We noted that SPX and QQQ still had room to reach the lower Keltner channels, despite closing near the bottom of the 4-hour Keltner channels yesterday. We mentioned QQQ’s potential to reach 507, though QQQ stopped shy of 507, instead rebounding off of the approximately 510 GEX cluster, also a meaningful and intuitive area for a bounce. SPX saw seemingly eager effort to buy the lows today, despite not closing positive, almost reaching the lower Keltner channel. Declines can be messy, we might overshoot that lower boundary, but the oversold conditions and extreme GEX-weighted volatility coupled with deeply negative GEX can lead to a strong bounce any time. 6061-6075 SPX would be some areas on the chart to watch, but let’s look at the GEX picture for SPX.
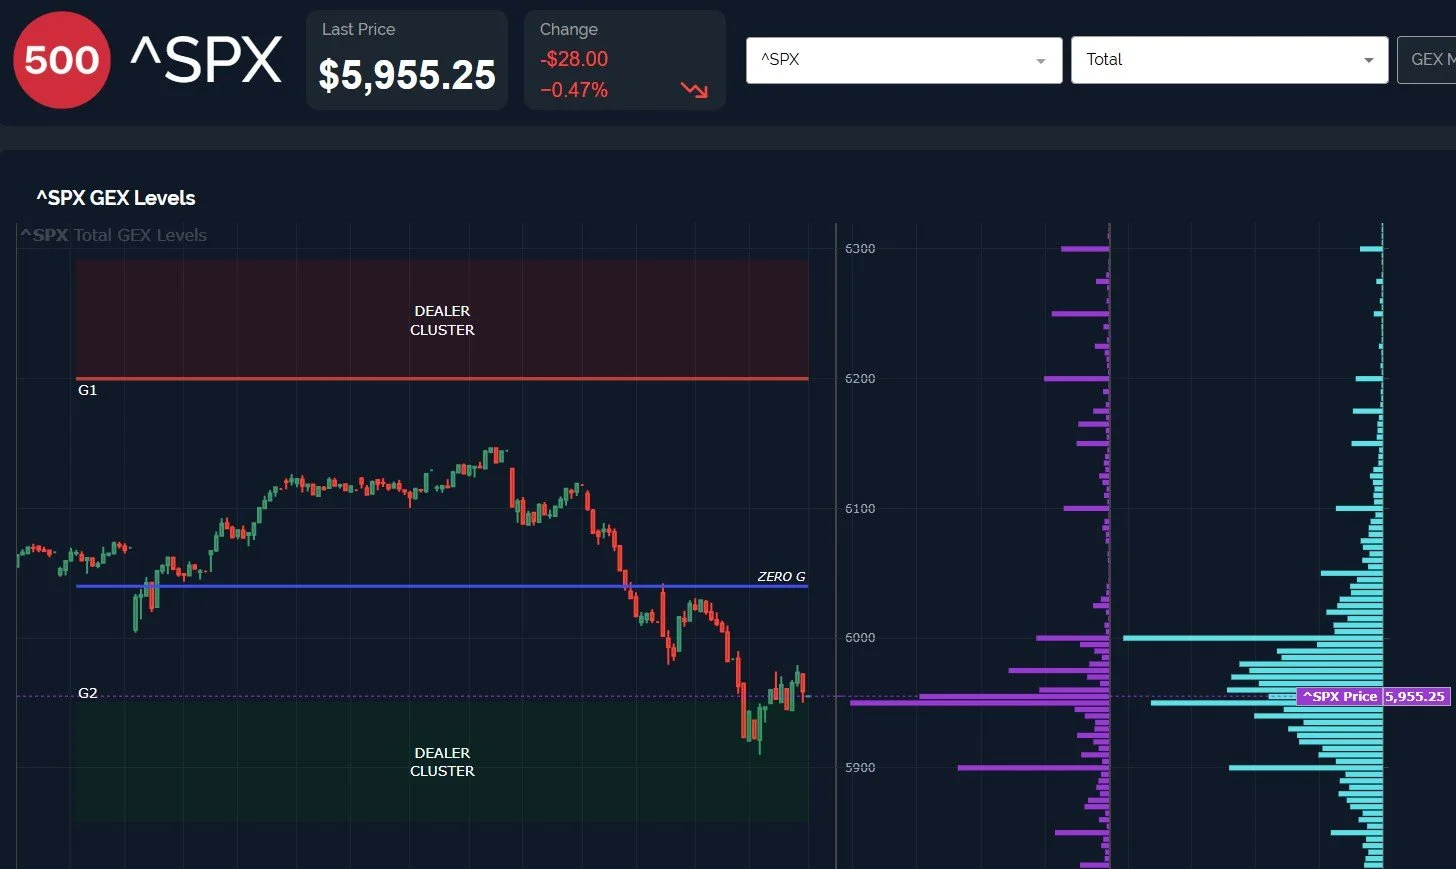
Another mark in favor of the rebound camp- SPX entered the lower G2 Dealer Cluster zone, not just teasing the outer perimeter, and we saw large volume at 6000, noteworthy given that 6000 is a price not reached today. We also see the upper Dealer Cluster zone remaining at 6200, and both 6165 and 6200 have significant representation at the March 21 expiration. With roughly a month between now and the expiration of those GEX clusters (assuming they don’t shift further, which they can), we can still see more downside, though in general we see risk/reward tilted toward a bounce soon.
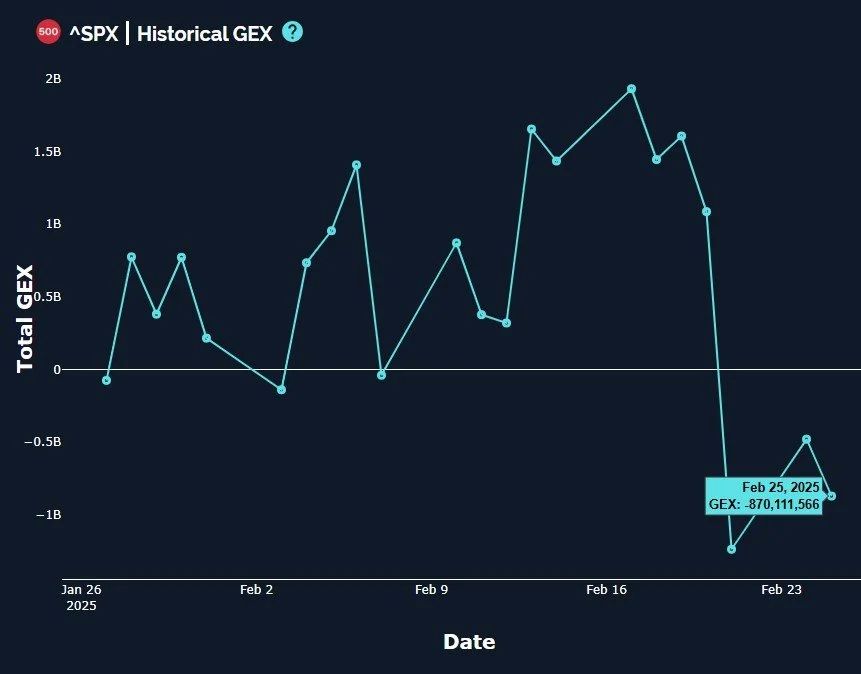
SPX’s total net GEX is somewhat less inspiring, dropping again to -870M, not quite in what we would consider “solid” bearish territory, but a negative shift nonetheless. SPY is nearly at an extreme, at -2.2B, not quite a contrarian signal, but close. It’s possible SPX GEX is signaling we may see more weakness, though we must weigh this against the positive of the lower Keltner channel being near, the lower Dealer Cluster being reached, DIA’s positive divergence, and the short-term oversold conditions we see.
The VIX climbed again today after reaching 20 yesterday, this time almost touching the upper Keltner channel at 21.83 but fading significantly. As long as the VIX is above the Hull at 16.72, we’ll remain open to the possibility of further spikes, but as of now it looks like a pullback in volatility occurred and might extend beyond today. Maybe it was Turnaround Tuesday after all, just an incomplete one…Tomorrow will be telling!

Here’s the Discord link if you haven’t joined us yet! Access is free for some channels, and new members have a 7-day trial within Discord to see how we operate. We have an active community of thoughtful traders who chime in throughout the day, sharing ideas and opportunities as we see them.
If you’re interested in accessing our tools and analytics, be sure to check out our website! More improvements coming by the end of this week including backtested algos and chart indicators!
If you’re interested in learning more about our strategy and approach, we address all of these topics in our Geek University course which is included in all memberships.
We recently posted a YouTube video, and we have many other short videos, so give our channel a look if you’re curious about recent market commentary and ideas as well as gamma (GEX) concepts explained.
Thanks for being part of our community and know that we invite your feedback!
The information provided by Geeks of Finance LLC is for educational purposes only and is not intended to be, nor should be construed as, an offer, recommendation or solicitation to buy or sell any security or instrument or to participate in any transaction or activity. Please view our Investment Adviser Disclaimer and Risk Disclosure.