
Getting Closer….
2025 WINTER SUBSCRIPTION SPECIAL- Our Winter Special of $300 off of the annual Portfolio Manager subscription only has a short time remaining! We’ll be rolling out even more new features this week, including backtested algos and indicator overlays, so we hope you’ll join us for the ongoing improvement of our total offerings! Enter code WINTER2025 at checkout.
Friday’s weakness saw continuation on Monday after a brief attempt to push higher. Sellers were active, though I would half-jokingly remind everyone buyers were active too, since every sale doesn’t occur in a vaccuum..There’s always a buyer. This is a zero-sum game we’re playing, right? So more accurately, we can say the party more willing to raise their price to willingly buy or lower their price to willingly sell is the more eager of the two. We always have the caveat of the unwilling (yet eager) buyer or seller: The one being liquidated due to margin calls. In summary, long investors saw their accounts shrink a little more (unless properly hedged). We saw some interesting developments with gamma exposure (GEX), which we’ll discuss in today’s newsletter. We also discuss complementary ideas and observations in today’s YouTube video, which you can view by clicking here.
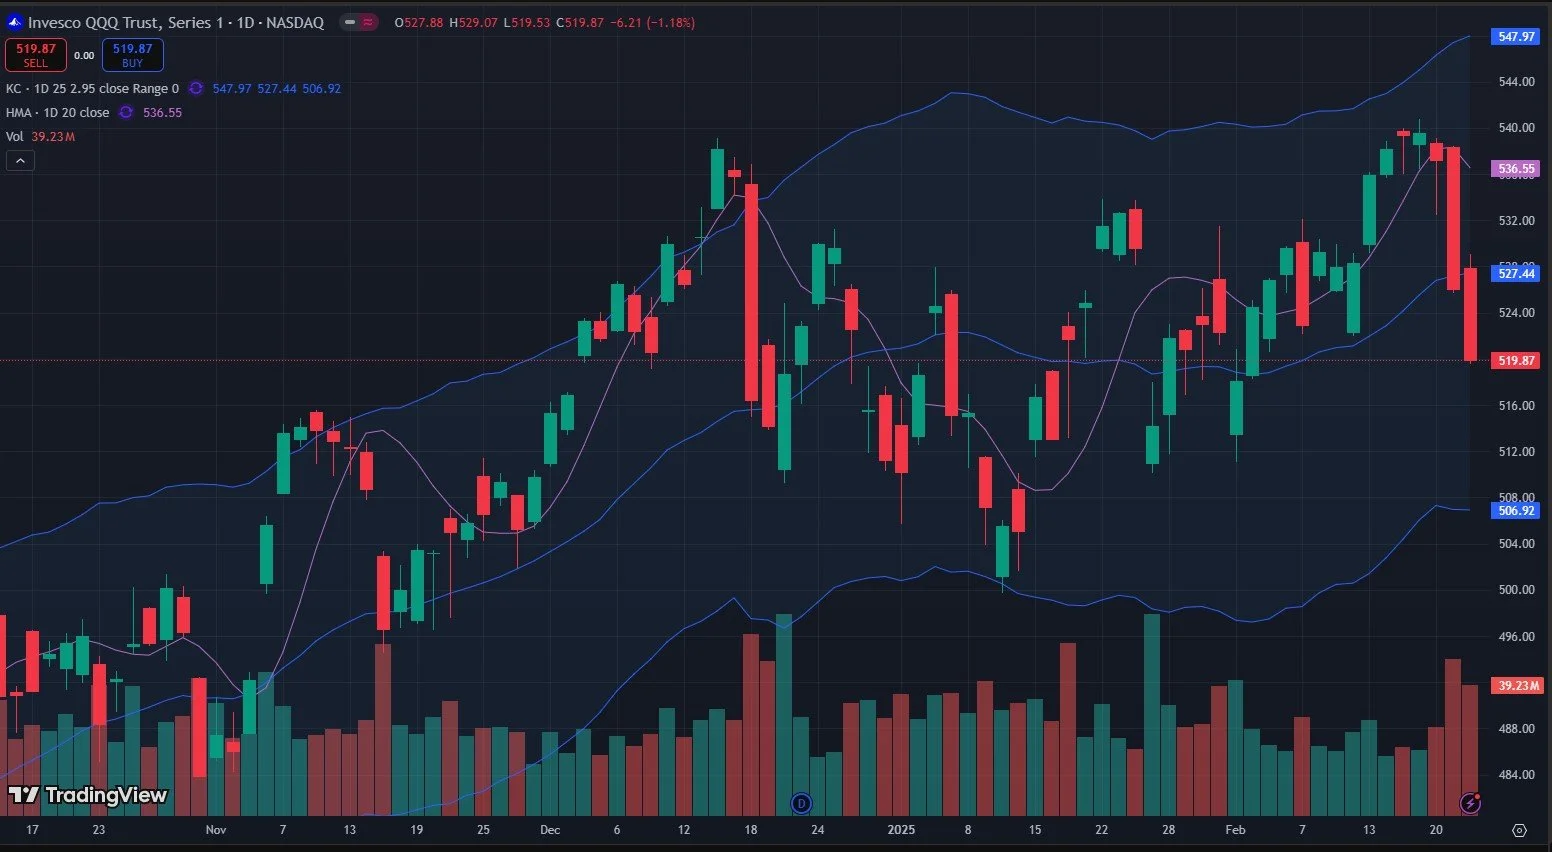
QQQ rejected an attempt to push above the middle daily Keltner channel, as shown above, and QQQ is almost to the bottom of the 4-hour Keltner channels (not shown) at 517. Will the drop stop at 517? If not, we may be heading toward the lower daily Keltner channel shown above at roughly 507. Despite most of the leading stocks since 2009 being in the technology sector, I think QQQ’s chart over the last few months looks the least bullish of all of the major indices, so I’m interested in seeing how the current consolidation phase plays out. For now, a bounce appears to be fairly imminent, even if the reversal waits for QQQ to reach the lower daily Keltner channel.
The GEX levels chart below shows QQQ to be at the doorstep to the lower G2 Dealer Cluster zone-an area where we expect dealers may become buyers. This zone does extend down a bit, and an overshoot would place QQQ’s price within range of the lower daily Keltner channel, so we keep the range in mind as we’re looking to make buying decisions in this zone. Note that we had noteworthy volume today (the light blue horizontal bars to the right) at 530 and 540, noticeably more significant than the volume at lower strikes.

QQQ’s total net GEX improved today, though it’s worth noting today’s read excludes 0 DTE GEX that has expired, which normally doesn’t roll off until the overnight session. But at least we have a defacto toggled view of what GEX looks like beyond today. We will soon have the ability for subscribers to decide whether or not they want to see 0 DTE GEX or strictly look ahead, which we’re looking forward to rolling out.

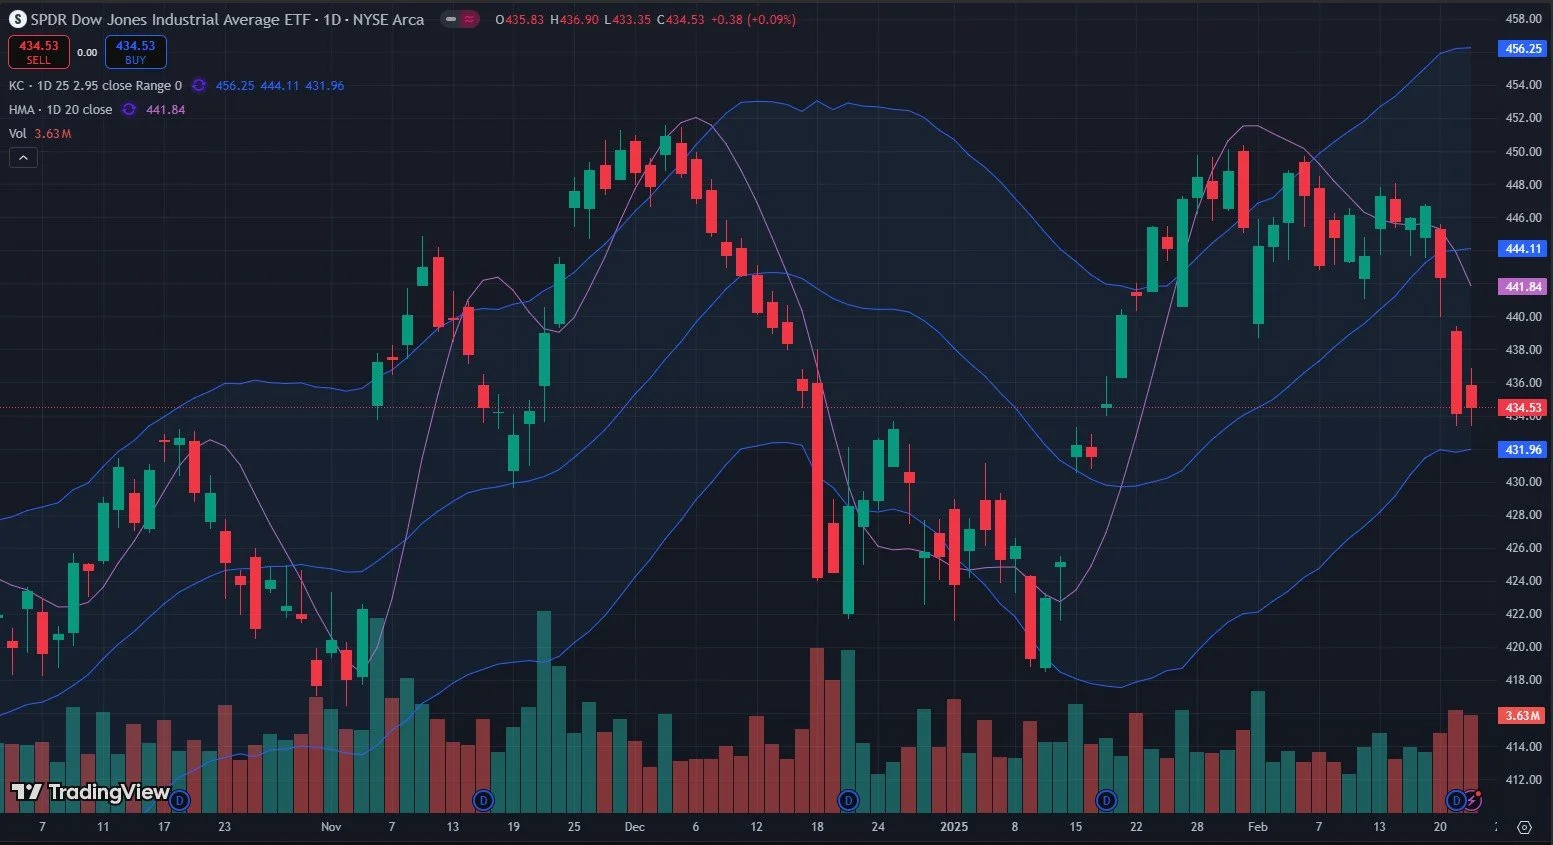
DIA looks more constructive than QQQ in several ways, and DIA is already closer to its lower Keltner channel, currently just below 432. The upper Keltner channel is still pointing higher as well. Some interesting DIA tidbits from today: DIA made the exact same intraday low as it made yesterday, 433.35. DIA closed higher today, unlike SPX or QQQ (the candle coloration is determined by the change after the open, not the prior day’s close). I consider this a mark in favor of a potential rebound just around the corner.
DIA is also the first major index to cross back over the zero line, showing positive total net GEX (also excluding today’s 0 DTE expiration).

The largest GEX clusters for DIA are still at higher prices, notably 440 and 450, with decent volume at 440. Yet we continue to see price right around the zero GEX line. We don’t have to drop to the lower Dealer Cluster zone- but we do see volume at 430 and the green box slightly lower than that, so we recognize the possibility that buyers may need to be scared just a little more before we can see the market squeeze late shorts.

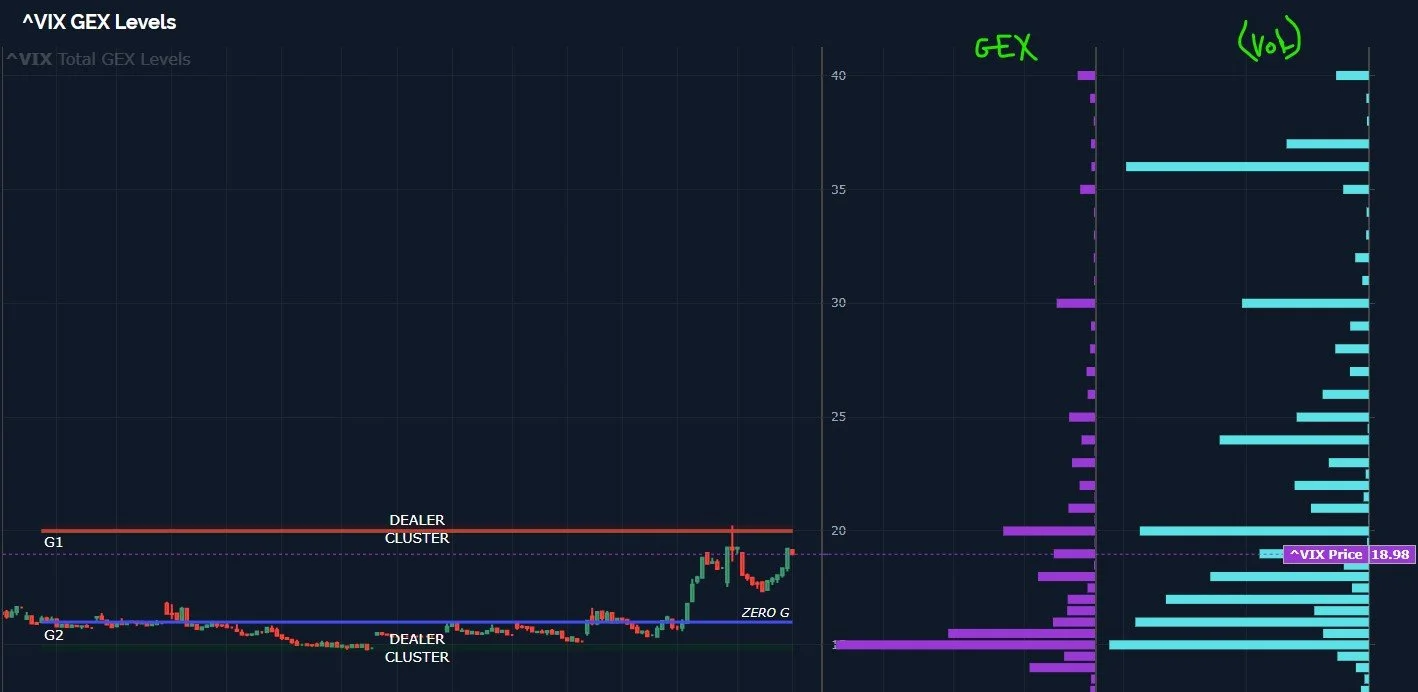
Another question mark arises from the VIX, which did finally tag the upper Dealer Cluster zone at 20, though we continue seeing volume come in at higher strikes, mostly right at 20 (which makes sense) and then at 36.
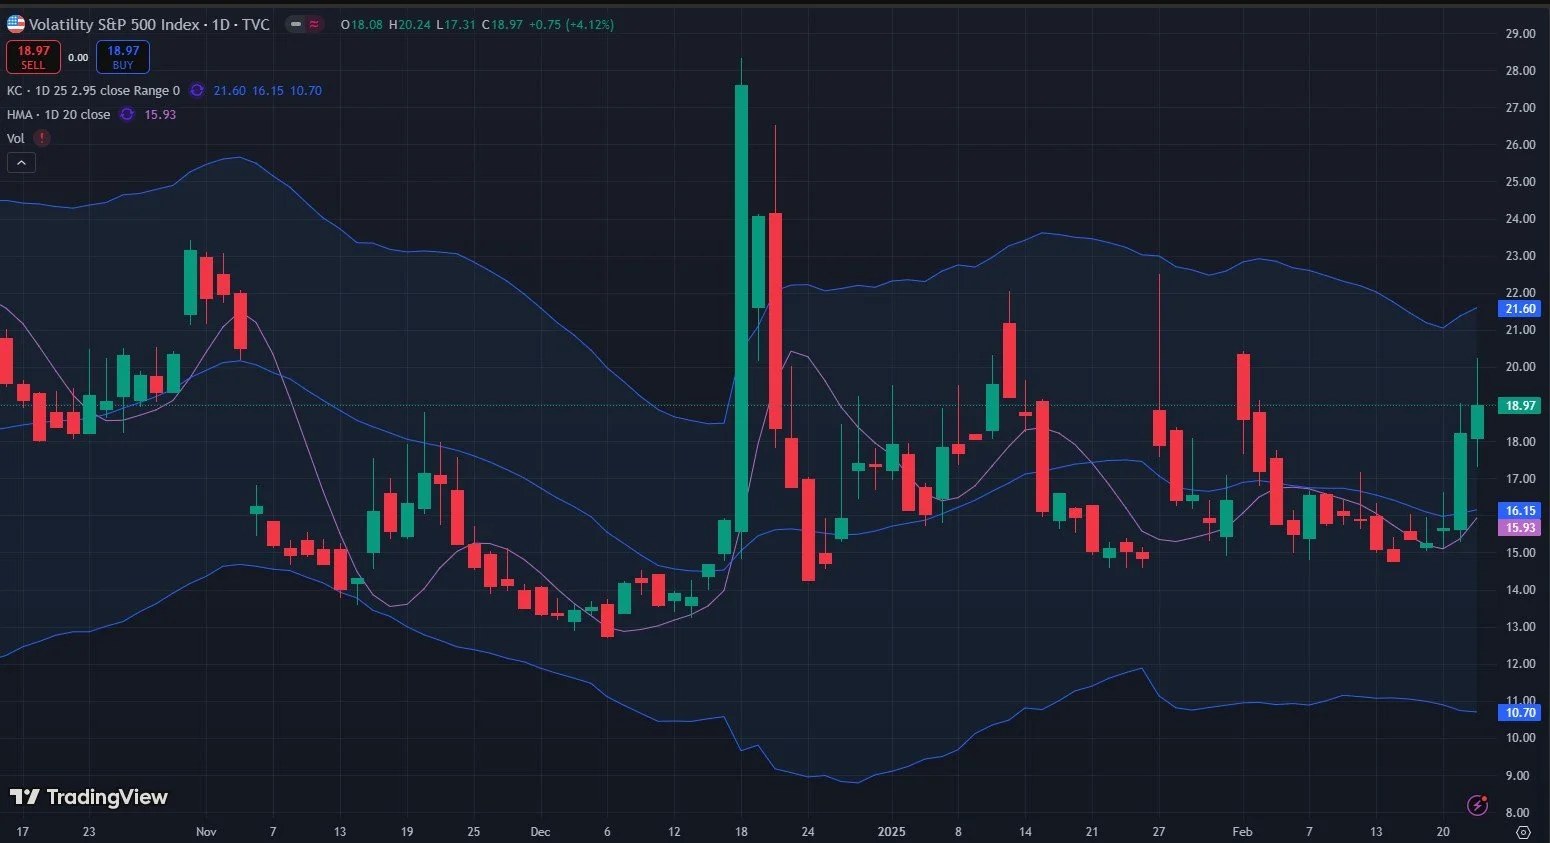
The daily chart for the VIX shows that we might see a spike higher than 20, perhaps to 22+, and it’s historically true that the VIX can indeed spike a lot higher than many might expect, given the emotional and capital flow factors (too many people short the VIX?) impacting the VIX. So while indices show possible opportunity right around the corner, the VIX and some chart indicators for the indices still say the selloff may not be done. At Geeks Of Finance, we certainly don’t base our success on the exact timing of a top or bottom, but rather on our portfolio construction, looking at risk/reward for each position taken and hedging those positions with longs and shorts alike showing asymmetry. We are looking for long opportunities despite the murky picture over a 1-2 day horizon.
Here’s the Discord link if you haven’t joined us yet! Access is free for some channels, and new members have a 7-day trial within Discord to see how we operate. We have an active community of thoughtful traders who chime in throughout the day, sharing ideas and opportunities as we see them.
If you’re interested in accessing our tools and analytics, be sure to check out our website! More improvements coming by the end of this week including backtested algos and chart indicators!
If you’re interested in learning more about our strategy and approach, we address all of these topics in our Geek University course which is included in all memberships.
We recently posted a YouTube video, and we have many other short videos, so give our channel a look if you’re curious about recent market commentary and ideas as well as gamma (GEX) concepts explained.
Thanks for being part of our community and know that we invite your feedback!
The information provided by Geeks of Finance LLC is for educational purposes only and is not intended to be, nor should be construed as, an offer, recommendation or solicitation to buy or sell any security or instrument or to participate in any transaction or activity. Please view our Investment Adviser Disclaimer and Risk Disclosure.