
Divergences: Warning Or Buying Opportunity?
Looks like dealers and other major market participants pushed the button on Friday to engage “Tease Mode” for those looking for an exact 6100, with 6099.97 ending up as the comical high for Friday. Reaching such a close price to the target but not quite tagging the exact number is very fitting for gamma (GEX), and we often see reversals in close proximity to big GEX levels. As a reminder, our Dealer Cluster zones reflect areas where we believe dealers may end up becoming sellers, and logically, if a lot of players are looking for 6100 to mark a reversal (something truly only proven in hindsight), you might see the reversal occur slightly lower. In this bull market, we’ve often seen prices exceed targets or reach deeper into the box, but that’s not a requirement. We still don’t know if we’ll end up exceeding 6100 or not, so don’t read into this as a veiled prediction. We go over SPX more in depth in today’s YouTube video, also discussing PLTR and NVDA as well as more, but let’s use the newsletter tonight to address a visible divergence between QQQ and SMH in a complementary fashion.
But before we do that, I do wnat to point out just one change of concern that I notice between Friday intraday and where things settled out at Friday’s close with SPX:

On the surface, looking at the chart above, we see more of the same: SPX is making ever so incremental new highs daily while perched atop the upper Keltner channel, with the Hull Moving Average about to move through the current price, which would create a sell signal according to my own personal methodology.
Friday morning, in our Discord server, I posted the 3D graph you see below, highlighting where we see the next largest GEX clusters concentrated, with 6150 and 6200 both representing the largest focal points on December 20.
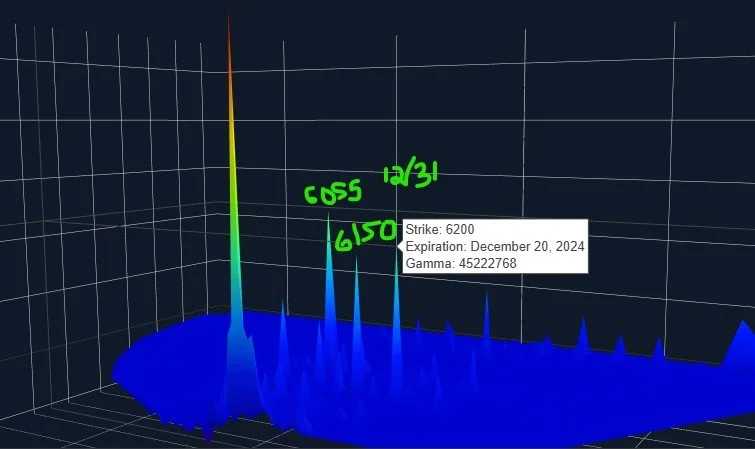
SPX 3D Graph: www.geeksoffinance.com
This evening, I pulled up the 3D graph for SPX again, just to see what changed between my Friday morning post and the adjustments around the close that we typically see. Notice anything different? 6200 is gone. We now have 6100 for December 20 two spikes over from the 6150 I highlighted, and then 6055 on Dec 31, but 6200 is nowhere to be found, at least not as a meaningful GEX cluster on one particular date. 6200 still shows up as a fairly significant cluster on our GEX Levels chart, but its GEX is scattered like the sands on the beach, with a little bit on many dates out into the future. We like to see obvious GEX clusters on specific dates that stand out relative to the other GEX surrounding it, so this is a negative change, in my view.
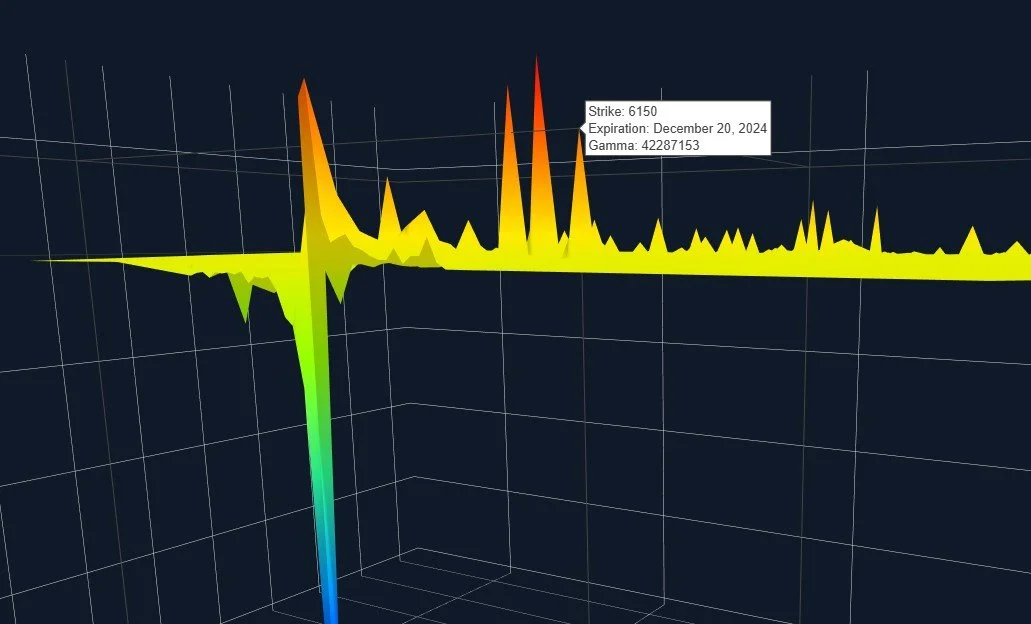
SPX 3D Graph: www.geeksoffinance.com
Let’s shift focus toward QQQ, now that we have that little point out of the way. QQQ played a fine game of catch-up with SPX, stretching even further over the upper Keltner channel and managing to close near highs of the day, which SPX wasn’t able to do. In both cases (SPX and QQQ), even if we wanted to establish a net short position, I would wait until we breached the Hull at 519.30, so we don’t see a short signal yet. Keep this context in mind tactically while we discuss theoretical reasons to be concerned about the sustainability and ultimate destination of the move in the short run.

Looking at the QQQ Levels chart below, you can see that the lower edge of the Dealer Cluster zone seems to be a resistance area, for now. We still see notable GEX all the way up to 540, but less volume intraday at those levels than at, say, 500.

QQQ GEX Levels: www.geeksoffinance.com
QQQ shows over 1B in positive GEX, but a very low GEX-weighted Volatility Gauge, implying that QQQ is far less volatile than at other times over the last year. But is the lack of volatility sustainable?
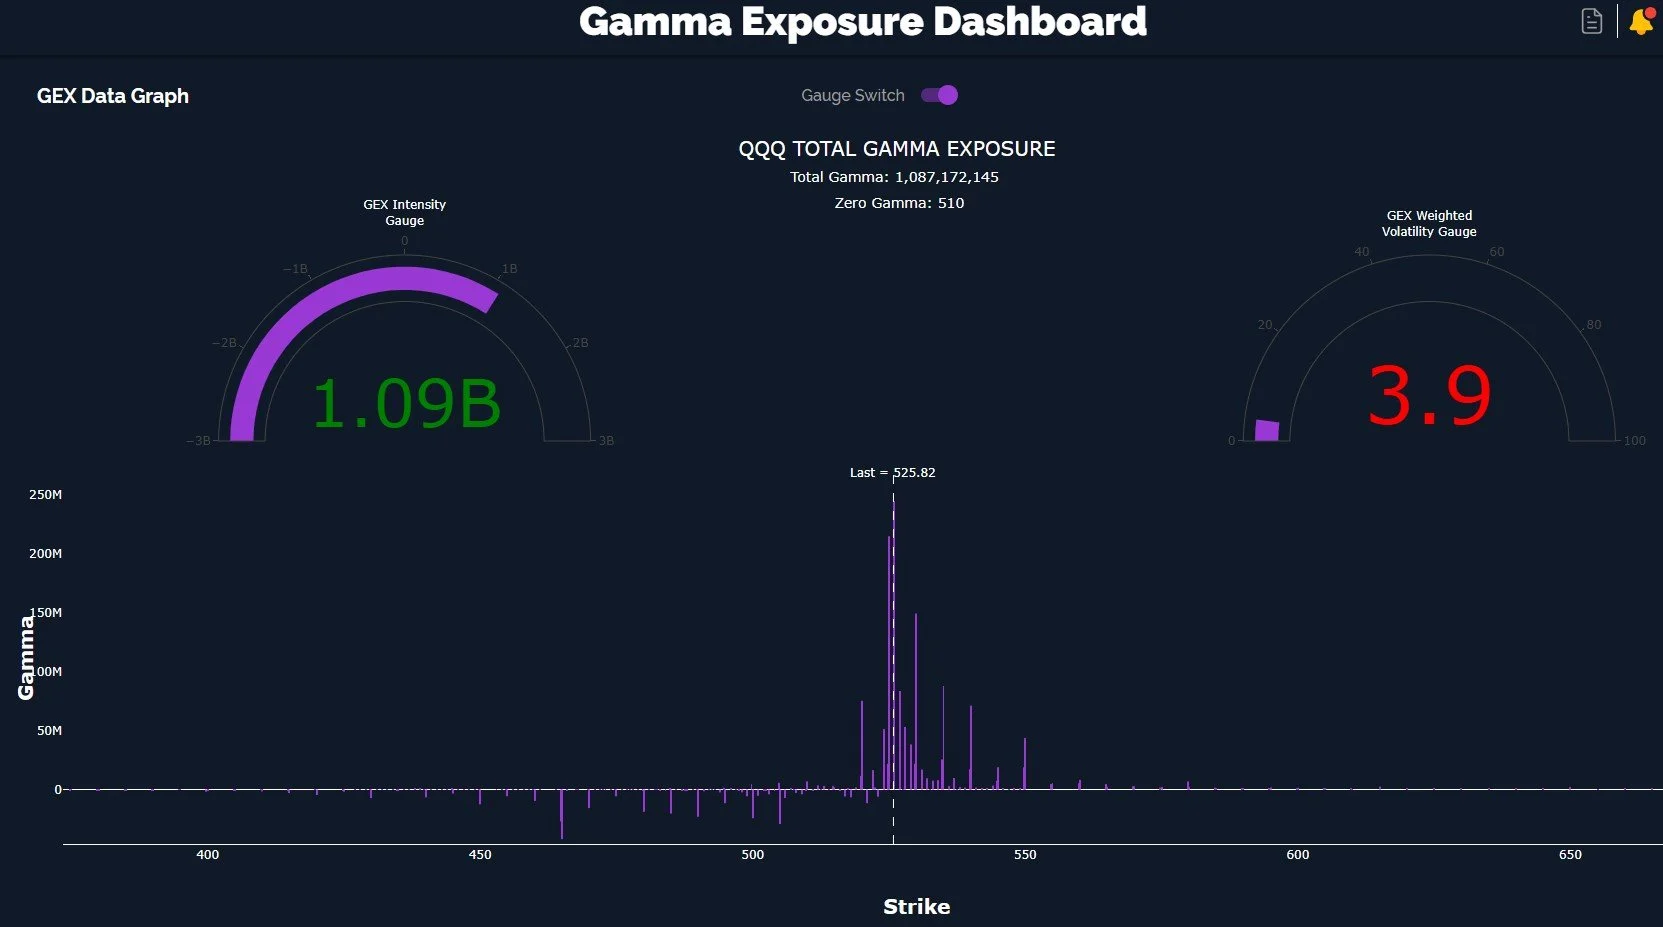
QQQ GEX Graph: www.geeksoffinance.com
Let’s tie in what we see with QQQ with SMH now. We discuss NVDA in today’s YouTube video (link at the bottom of the newsletter as well as the first paragraph), and it’s worth pointing out that NVDA can still hit 150 without SMH making a big move higher. It’s at least possible and we do have historical instances where the two didn’t exactly move in tandem.
We have SMH, which has largely failed to participate in the move higher since October, creating a big negative divergence compared to QQQ. I do see that SMH is resting above the Keltner and above the Hull, so perhaps the question mark is a good policy until we drop below 247, because holding above those two lines is considered bullish to me.

We do see meaningful GEX at higher prices (260-280), but notice the light blue bars? Those represent intraday option volume. The largest activity was actually at 165 and 170 strikes, very far away from the current price.

SMH GEX levels: www,geeksoffinance.com
Unlike QQQ (which is strange, given that SMH has largely driven QQQ higher over time), SMH currently shows negative GEX and a GEX weighted volatility gauge that is somewhat higher than QQQ. Despite the individual strikes at higher prices showing at least some interest from 260-280, the negative total net GEX is concerning because of SMH’s role in leading the way for QQQ for much of this bull market.
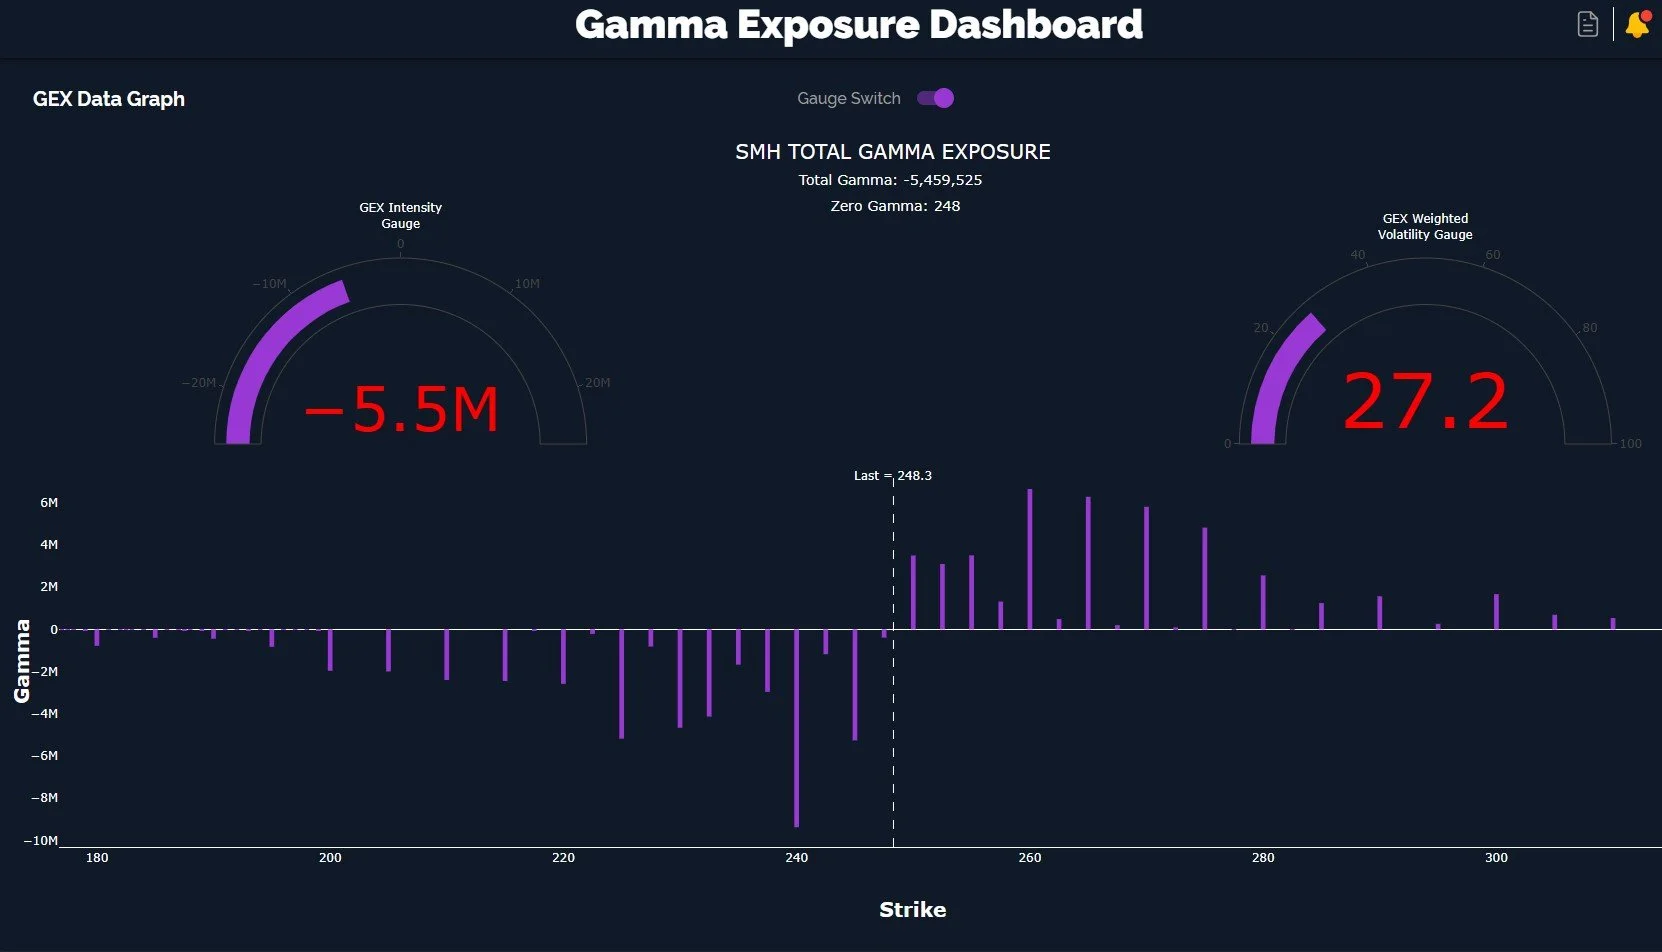
SMH GEX Graph: www.geeksoffinance.com
The 3D graph also shows SMH’s largest single GEX cluster to be the negative GEX at the 240 strike for the December 27 expiration. As mentioned, this doesn’t mean NVDA won’t hit 150, that could easily happen while SMH flounders or possibly participates in a very late-stage move to match QQQ’s advance, but each ticker deserves attention to their specific setup, in our view.
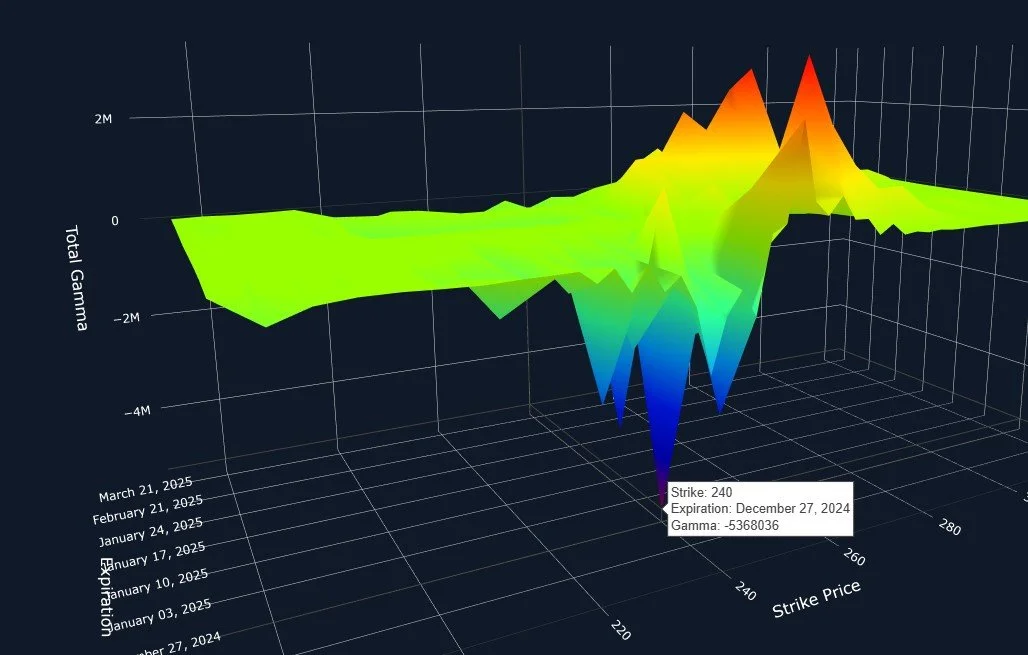
SMH 3D Graph: www.geeksoffinance.com
In conclusion, we have SPX and QQQ at all-time highs, but they’re also above the upper Keltner and showing other signs of possible short-term reversal ahead. SMH is a larger red flag for tech, at least that’s one interpretation. We will be watching whether or not SMH improves its GEX position or its chart, or whether it will lead to QQQ catching down to SMH at this point. Until then, we’ll trade what we see each day as GEX changes frequently on smaller timeframes!
Thanks again for joining us! Join us in Discord for our discussions around what’s happening as the day progresses. We’ll be active and posting some updates and we’d love to see you there!
If you’re interested in accessing our tools and analytics or taking advantage of our promotion (see the top of this newsletter), be sure to check out our website.
If you’re interested in learning more about our strategy and approach, we address all of these topics in our Geek University course which is included in all memberships.
We recently posted a YouTube video, and we have many other short videos, so give our channel a look if you’re curious about recent market commentary and ideas as well as gamma (GEX) concepts explained.
Thanks for being part of our community and know that we invite your feedback!
The information provided by Geeks of Finance LLC is for educational purposes only and is not intended to be, nor should be construed as, an offer, recommendation or solicitation to buy or sell any security or instrument or to participate in any transaction or activity. Please view our Investment Adviser Disclaimer and Risk Disclosure.