
Market With A Case Of The Mondays
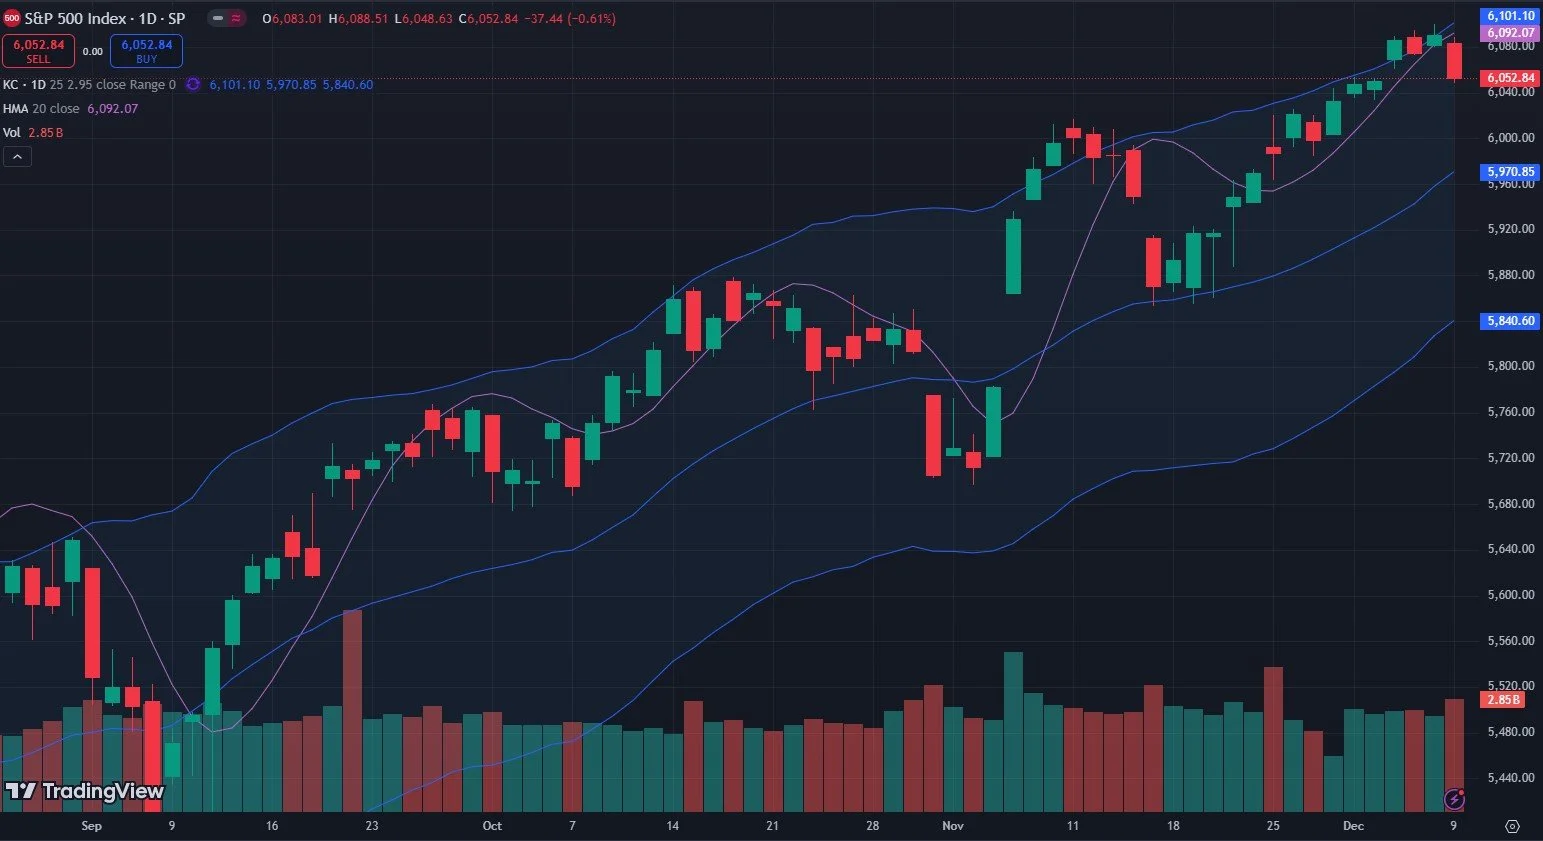
I’m reminded of a clip from Mike Judge’s 1999 comedy Office Space: “Looks like somebody’s got a case of the Mondays!” We’ve been noting that the Hull Moving Average was quickly gaining on SPX’s price as it hugged the top of the Keltner channel, and today’s gap below the line triggered a sell signal (according to my methodology). This fit quite well with what gamma (GEX) had advertised last week with the 6100 target almost being met on Friday, and VIX divergences developing alongside SMH’s underperformance. We also saw IWM move more negative in advance of today’s drop across the board. We go over SPX more in depth in today’s YouTube video, also discussing several other tickers, so give it a quick look.
My Keltner settings give potential downside targets of anywhere from 5970 down to the mid-5800s, which would still preserve the uptrend. With price action being so narrow and only upward since mid-November, it’s easy to get complacent and forget that the dreaded “V” word (volatility) can always pop out of seemingly nowhere to wake you up.
I’m quite amazed by this market, because just as soon as it seems that the data is starting to look more bearish, a subtle and possibly constructive shift happens in a number of areas. I know it won’t last forever, but it sure seems like it (thanks a lot for ruining the business cycle, Team Jerome). But seriously, Friday’s close saw the GEX at 6200 somewhat diminished, but it’s back. And we do have a very wide range for the G2 Dealer Cluster, ranging from 5950 up to just below our current price, and 6100 is pretty solidly represented as we look at the 2nd half of December.
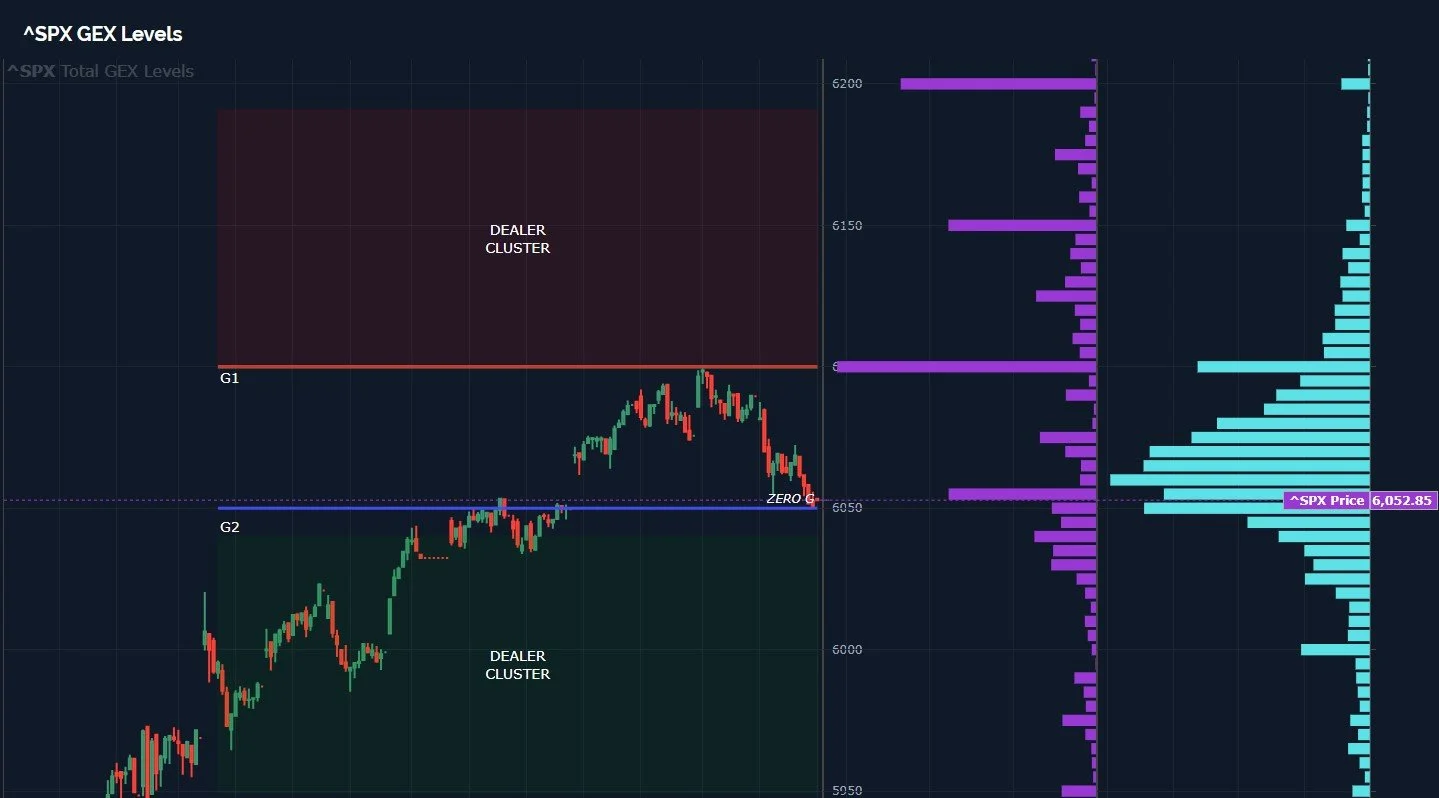
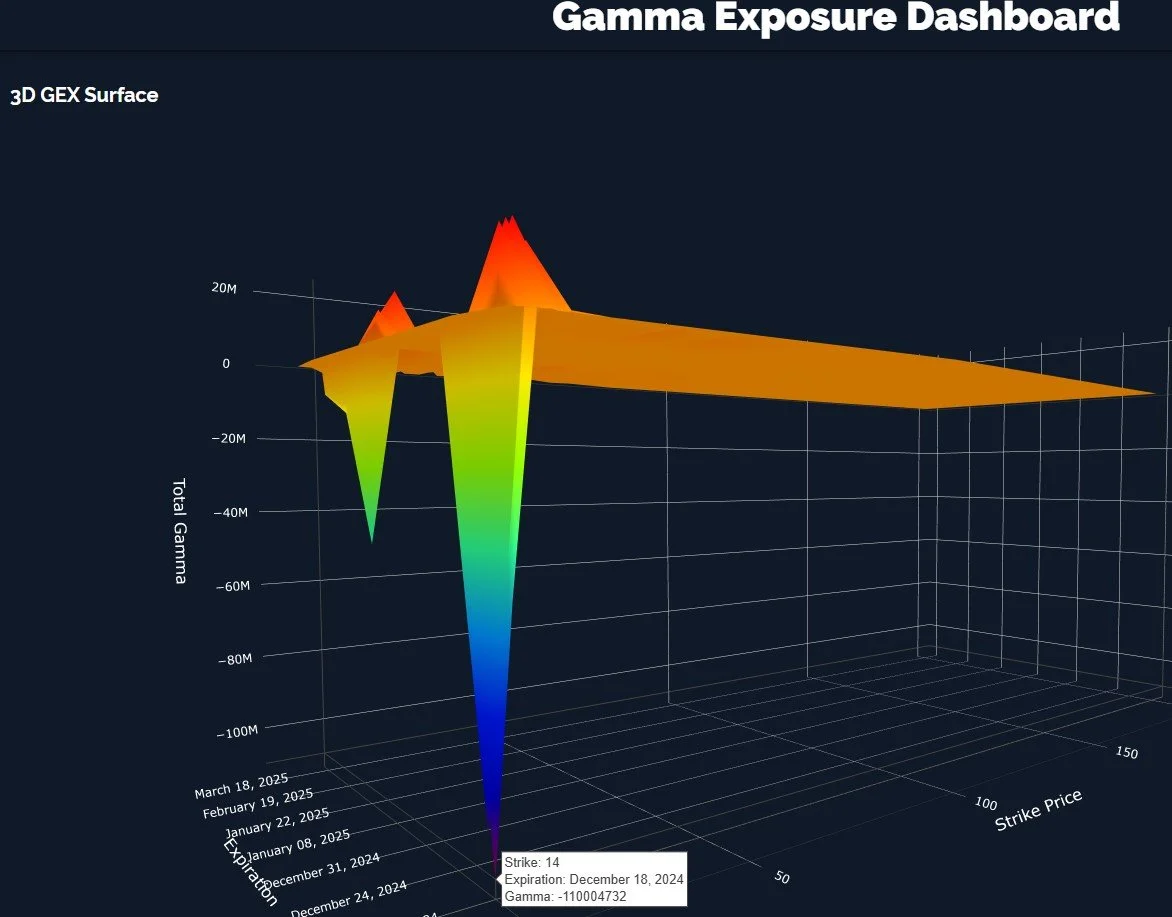
I was paying special attention to the disappearance of 6200 as a meaningful cluster for December 20 yesterday, but it’s back, and I wanted to make sure and highlight that since it contradicts any usefulness in yesterday’s reading of the 3D graph. But that’s why we constantly monitor GEX, to keep up with a constantly shifting picture. What we see as of today’s close for SPX is as follows:
1) diminished positive GEX overall, in the neutral range of 253M
2) a positive picture for December OpEx, with noteworthy GEX at 6100-6200
3) A starkly contrasting picture of SPY and QQQ, which show large negative GEX, a condition we’ve often seen near reversal points. If we were set up for a new bear market, I’d much prefer to see some agreement amongst the three, not a “meh” neutral reading on SPX.
These factors combined make me think any continuing pullback may not last too long and probably represents just another “buy-the-dip” opportunity (until something else changes).
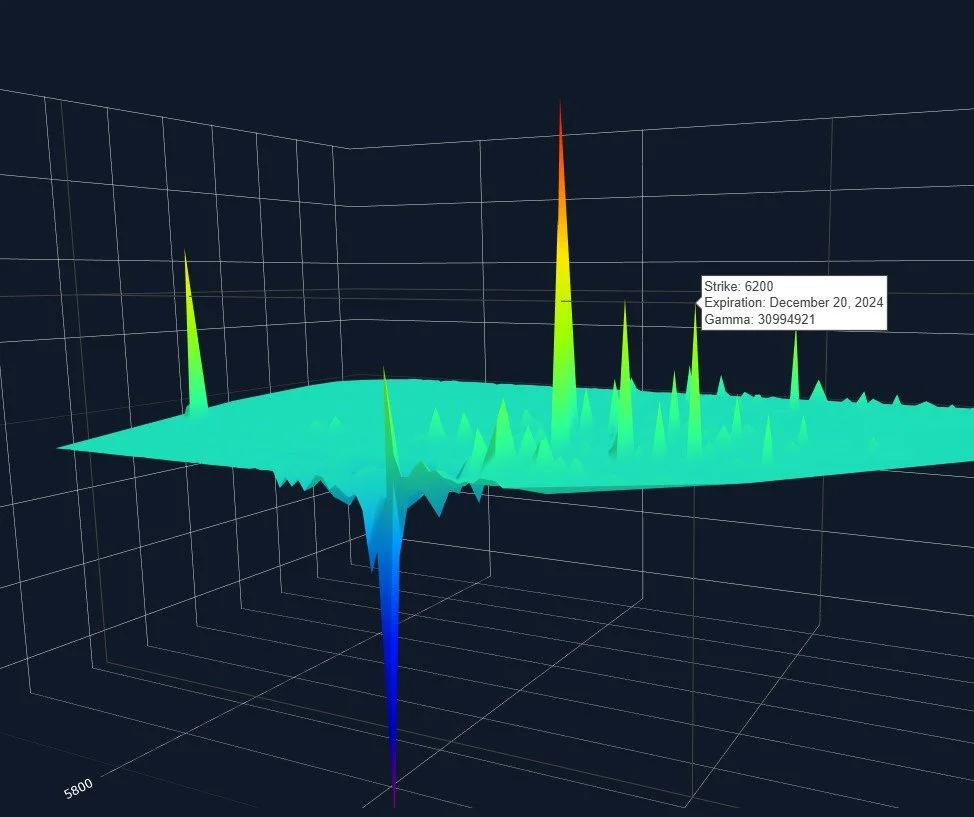
SPX 3D Graph: www.geeksoffinance.com
I saw a YouTube comment requesting some discussion of IWM, which we didn’t cover in today’s video, so I’ll share something here instead (I have no clue if the viewer subscribes or not to the newsletter). IWM has continued its downtrend ever since losing the Hull, which is something I expect to see from SPX for a time as well, even if only a few days. IWM came close to retesting the Hull earlier today, which is common to see once that level is lost, but rejection led to a drop almost to the middle Keltner channel.
The Keltners look very bullish, pointing sharply higher to the right, which really causes me to think IWM will find footing either around 236 or perhaps closer to 230 before starting down a path to new highs.

IWM’s GEX can be a tricky data point, with high GEX readings often marking index highs, and vice versa. We’ve noted this before, in fact, I think we pointed it out toward November 24 as we saw IWM hitting GEX highs. Not every ticker or index follows the exact same rules, so it’s good to take a fresh look at any new prospective trading vehicle.
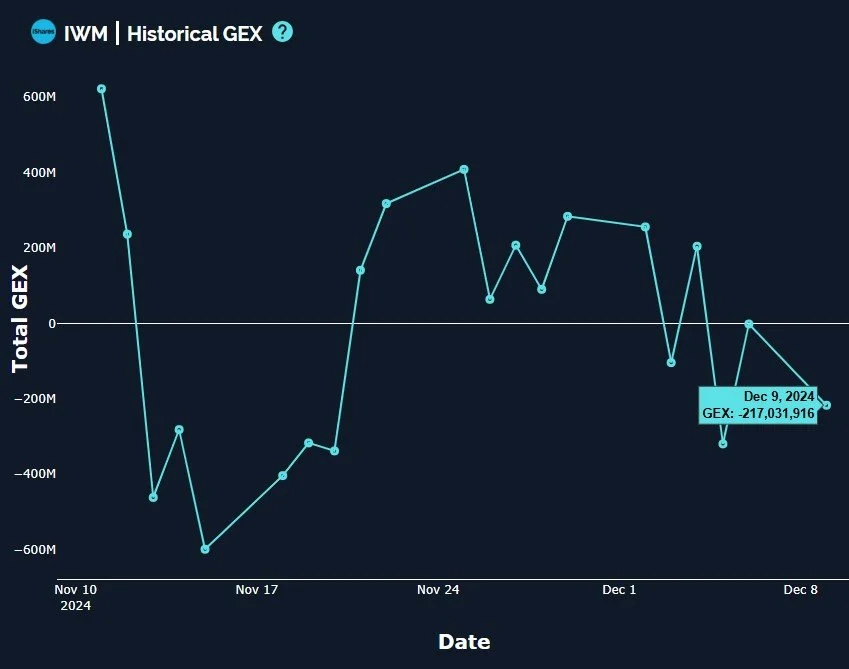
The current GEX positioning does lead me to believe we will see lower before higher in any major way, with volume right between 225-230 standing out. This level would also match where I believe the lower Keltner channel is headed in coming days, if the current trajectory holds.

IWM GEX Levels: www.geeksoffinance.com
The VIX closed above the Hull last Thursday, which we noted indicated a potential buy signal on volatility. I know some of our subscribers bought VIX calls as a hedge around that time. It’s never easy, and Friday saw the VIX close just below the line, but today gapped us up and seemingly indicates intention to reach some higher level.
That said, I am surprised at how the Keltners are really angling downward for VIX. This can obviously change with a large volatility spike, but it appears that even if the VIX reached the 17-19 area, we see the lower limit on the Keltners dropping to as low as the 10s. This possibility seems to go along with the idea that the market rallies to new highs toward the end of the year/beginning of the new year.

Looking at the VIX levels today, we see heavy negative GEX in the 12-14 range, and we’re below the G2 Dealer Cluster zone. But we see heavy volume today at the 22 level for the VIX, interestingly. I can certainly say that I personally have no interest in short volatility at these levels, even considering the possibility of VIX reaching 10. Who would’ve thought 2017 was back on the table with Yellen on the way out? what a paradox.

I consider the heavily lopsided negative VIX GEX at 14 to be a potentially bullish volatility contrarian signal. We saw this in both October and November, with the VIX rising right around the time of the monthly VIX options expiring, which I believe is tied to the negative positioning. We’ll watch this development and VIX zero GEX as we approach expiration.
If you’ve missed the rally the entire year, and you were waiting for one last dip to buy so you can tell all of your friends you’re a mega bull at your upcoming holiday parties (maybe now they’ll accept you), this might be your chance! Or you’ll lose everything on call options. Happy holidays!
Thanks for indulging our self-entertainment. Join us in Discord for our discussions around what’s happening in markets as the day progresses. We’ll be active and posting some updates and we’d love to see you there!
If you’re interested in accessing our tools and analytics or taking advantage of our promotion (see the top of this newsletter), be sure to check out our website.
If you’re interested in learning more about our strategy and approach, we address all of these topics in our Geek University course which is included in all memberships.
We recently posted a YouTube video, and we have many other short videos, so give our channel a look if you’re curious about recent market commentary and ideas as well as gamma (GEX) concepts explained.
Thanks for being part of our community and know that we invite your feedback!
The information provided by Geeks of Finance LLC is for educational purposes only and is not intended to be, nor should be construed as, an offer, recommendation or solicitation to buy or sell any security or instrument or to participate in any transaction or activity. Please view our Investment Adviser Disclaimer and Risk Disclosure.