
Fireworks For The New Year?
2024 HOLIDAY SUBSCRIPTION SPECIAL- $300 off of the annual Portfolio Manager subscription! We JUST rolled out 500+ new stock and ETF tickers on the dashboard. Check it out for yourself! Enter code HOLIDAYS at checkout! We still have 2 of 7 discounted subscriptions available for this limited time promotion.
We’re not talking about the kind of fireworks requiring gun powder, we mean volatility. What we don’t know is whether or not we’ve seen the last of the selling for 2024, or will it continue into the first day or two of 2025? According to my calendar, we’ll find out by Friday how things play out. We go over some levels and considerations around the market in our latest brief YouTube video, which you can watch by clicking here. We also cover some ideas surrounding MSTR, WMT, SLV, NVDA, and more, so check it out.
We saw immediate positive reaction from the VIX after dropping to important support levels Friday, a possibility we highlighted in last night’s newsletter, though we weren’t willing to go as far as to call for a spike today. I think it goes to show that while prediction of exact reactions in exact timeframes can be difficult to impossible, particularly surrounding the last few trading days of the year, we can position ourselves for success by recognizing areas that may provide some form of support while ensuring we have enough time (and placement of trading stops) to allow those moves to play out. We use gamma (GEX) in this way as well.

Our YouTube video linked in the first paragraph gives a more comprehensive view of the market, but in today’s newsletter, let’s see how the SPX and DIA relative possible opportunity is playing out. Looking at the TradingView chart above, we see SPX’s price is indicating indecision, attempting to head lower today while meeting some buying near the lower Keltner channel, leaving a tail on the daily candle. SPX is below the Hull Moving Average, which I consider to be bearish, but that upper Keltner is still amazingly pointing higher, refusing to drop. This definitely casts shade on the bear thesis short term, at least as far as the indicators go. If the weekly chart “takes over,” we may see 5750-5811 as the next support area. 5750 is the middle Keltner on the weekly chart, whereas 5811 is the 15-period EMA, another indicator I like to use. Otherwise, we’ve had enough downside to not want to get too greedy with short positions.
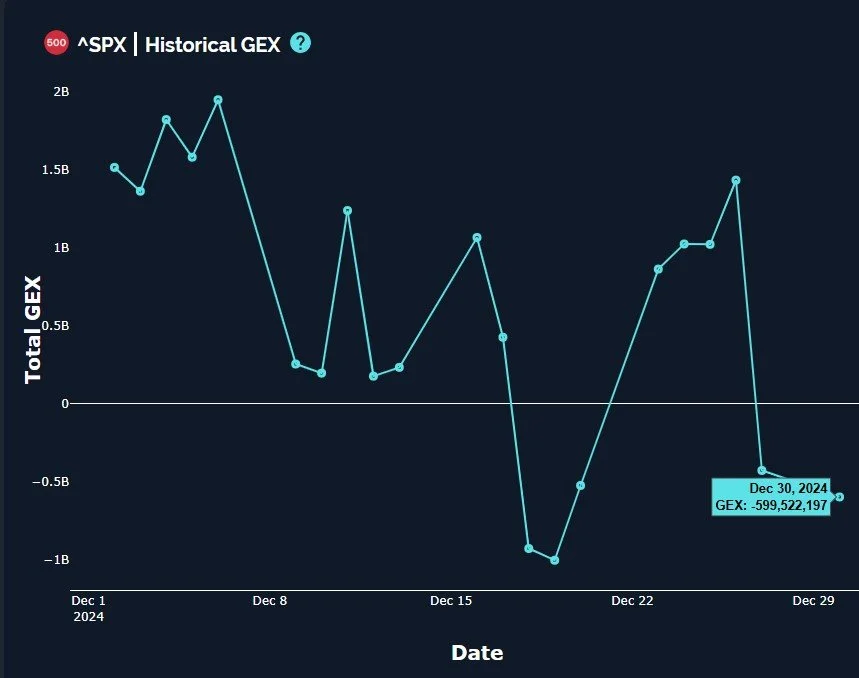
A point toward the negative is that SPX GEX has moved more negative again, reaching -599.5M today. Once again, as we finish out a year and begin January, I personally don’t like the idea of going full bear. There will be plenty of days to trade in 2025 and I’d rather not risk getting in the way of early year flows or reallocation toward sectors that are actually quite beaten up at the moment.
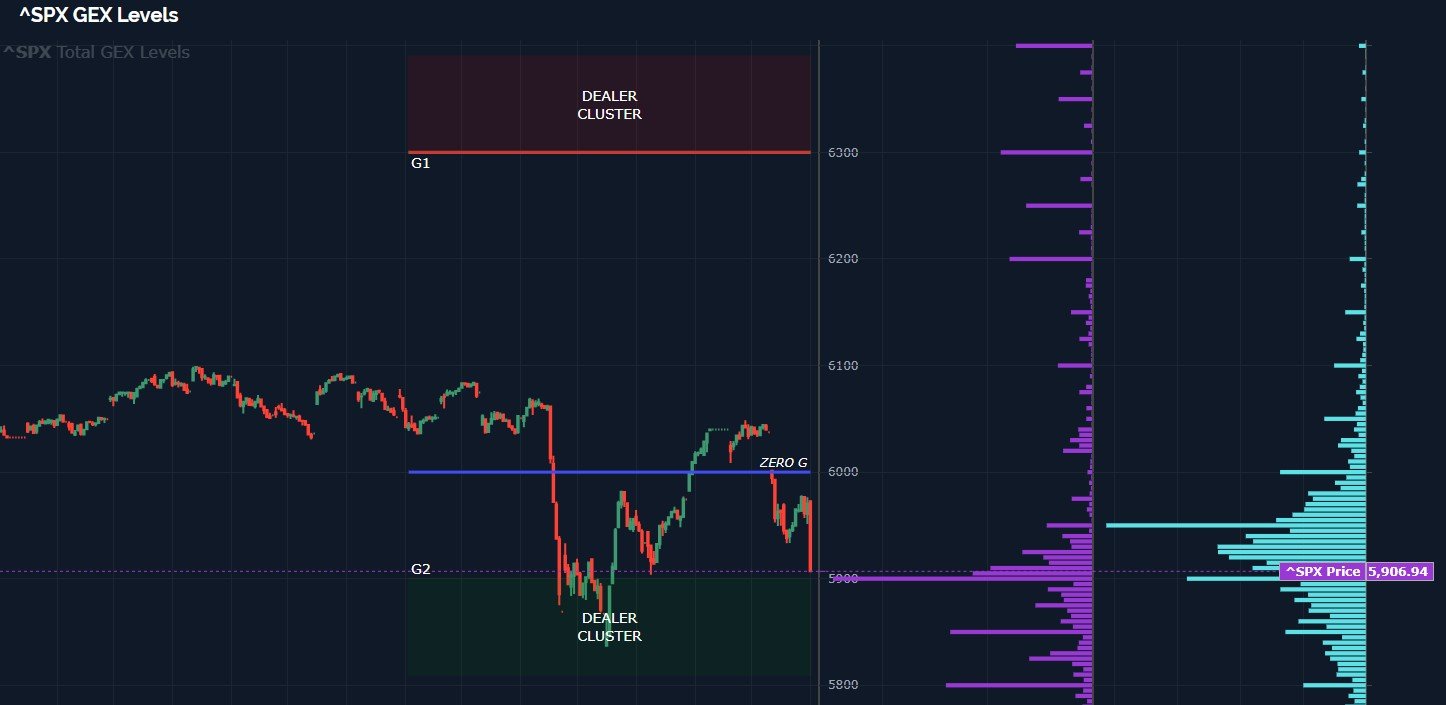
The GEX Levels chart below shows SPX flirting with the G2 Dealer Cluster zone, though that zone extends down to the 5811 area I mentioned as a potential target on the weekly chart.
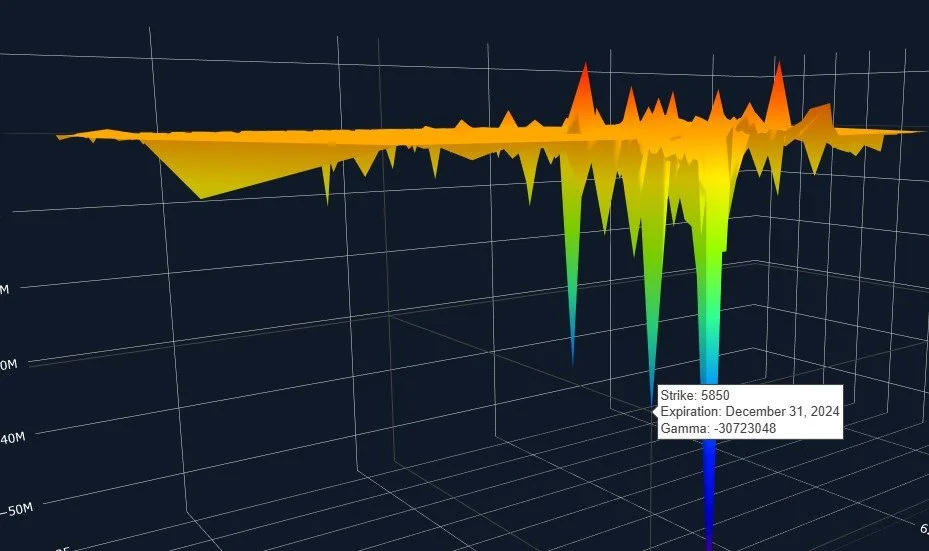
Looking at our 3D GEX picture, negative GEX at 5850 is the largest cluster set for expiration tomorrow. This can change in the morning, but I’ve found that prior day indications for the next day tend to have some relevance.
I see the most constructive case when looking at DIA, which painted a higher low today relative to 12/20, and DIA is holding the Hull by 2 pennies, a condition not met by QQQ or SPX. I don’t necessarily know whether or not all of the indices will rebound together, or at all, but being above the Hull is a long signal for me, and this potentially adds credibility to DIA leading us out of the depths (maybe just out of the swimming pool at the top of a high rise?).

DIA still maintains positive GEX, though it declined today. Meanwhile, SPX, SPY, and QQQ are all quite negative.

DIA is just out of a lower Dealer Cluster zone, with 425 representing a large cluster, and 440 showing both significant GEX as well as meaningful volume today. Even greater volume at 445.

Other than some housing data tomorrow, PMI on Thursday is the next important data point to watch. Regardless, we have what seems to be actionable data on the indices right now, and we’re finding individual opportunities that appear to show attractive risk reward. Join us in Discord as we discuss what we see intraday on the last trading day of the year tomorrow. We hope to see you there!
If you’re interested in accessing our tools and analytics, be sure to check out our website. We just rolled out 500 new tickers and speed enhancements!
If you’re interested in learning more about our strategy and approach, we address all of these topics in our Geek University course which is included in all memberships.
We recently posted a YouTube video, and we have many other short videos, so give our channel a look if you’re curious about recent market commentary and ideas as well as gamma (GEX) concepts explained.
Thanks for being part of our community and know that we invite your feedback!
The information provided by Geeks of Finance LLC is for educational purposes only and is not intended to be, nor should be construed as, an offer, recommendation or solicitation to buy or sell any security or instrument or to participate in any transaction or activity. Please view our Investment Adviser Disclaimer and Risk Disclosure.