
Time For The Laggards?
2024 HOLIDAY SUBSCRIPTION SPECIAL- $300 off of the annual Portfolio Manager subscription! We JUST rolled out 500+ new stock and ETF tickers on the dashboard. Check it out for yourself! Enter code HOLIDAYS at checkout! We still have 4 of 7 discounted subscriptions available for this limited time promotion.
The slow holiday grind continues, even with the threat of actual red on the screen, as we might have seen today (I say “might” because I rubbed my eyes this morning, looked back, and it was green). We’re watching several divergences that might spell trouble on the horizon, as well as several contrarian opportunities (IWM, DIA and more), but so far, the short-term gamma (GEX) picture has assisted in keeping us on the right side of the prevailing direction. We discuss more about what we’re looking for with SPY in our latest YouTube video that you can watch by clicking here. We also cover BTC, PLTR, a new long idea in BUD, and more.
Regardless of intermediate term uncertainty, GEX continues to assist us intraday, as demonstrated by our freely shared data point this morning in Discord:

The high of the day was 6049.75, so I’d say the early indication was quite actionable. This was roughly 30 points from where SPX was sagging at the time of our post, pointing to the benefit of GEX over what otherwise appeared to be a negative morning for indices.
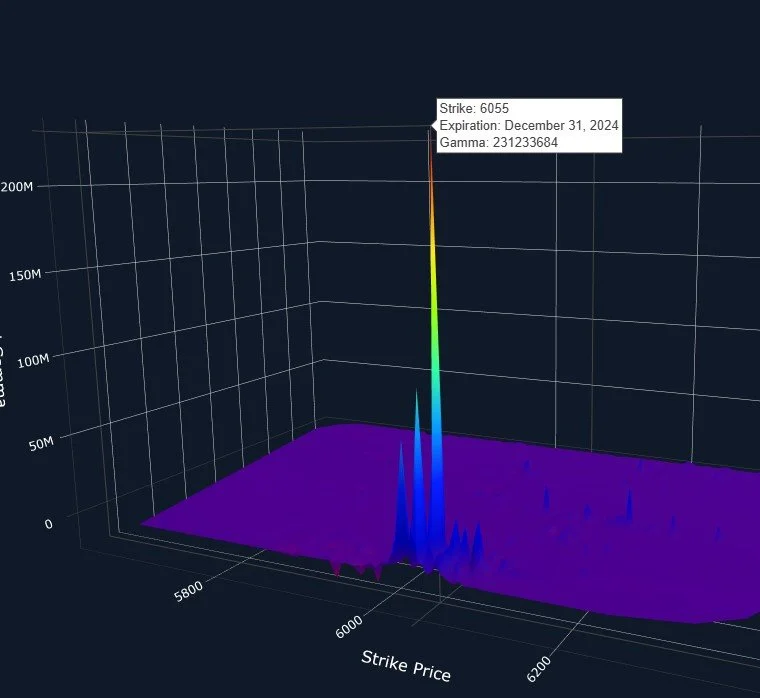
Looking at the chart below, SPX marches higher from the green G2 Dealer Cluster, now right at the doorstep of the big 6055 GEX cluster expiring 12/31. We also saw some volume today at 6100, but 6055 still dwarfs 6100 as an important level at the moment. What happens from here? Will we even tag 6055? Dynamics surrounding the tagging of GEX levels is a discussion for another day, but suffice it to say we often see overshoots or falling short when trend changes are imminent. Occasionally the perfect tag does happen, but counting on perfection (as opposed to risk management) is often a recipe for failure in trading.

Impressively, SPX GEX continues marching higher, reaching 1.43B today, not quite to the 1.9B high we saw on December 6.

Looking at the 3D graph below, we don’t yet see meaningful enough GEX on individual dates beyond 6055, even with 6100 and 6200 well represented compared to other strikes in general, so the field is wide open as to where we go next, if exclusively looking at SPX GEX for clues. But with positive overall GEX, a chart showing room for higher prices, and GEX tilted toward the higher strikes, we don’t yet see a good reason to short SPX, and the bias based on momentum is toward the positive.
We’ve talked a bit about IWM and DIA as of late, given their starkly contrasting negative performance relative to SPX and especially QQQ. IWM has overtaken some key technical hurdles, closing above the Hull Moving Average, and it’s now above the lower Keltner channel, potentially opening the door to 234 if the upside move continues. At this point, DIA and IWM’s charts look quite similar, and the upside move for each of them to reach their upper Keltner channels is a lot more than SPX and QQQ show on their own charts. Is this a good catch-up opportunity for the two laggards? What does GEX say about this?

The initial glance at IWM’s data graph is not impressive, showing negative GEX and large negative clusters at 210 and 220. But notice the zero GEX level at 232? That’s very close to the middle Keltner at 233.93, which draws my attention.
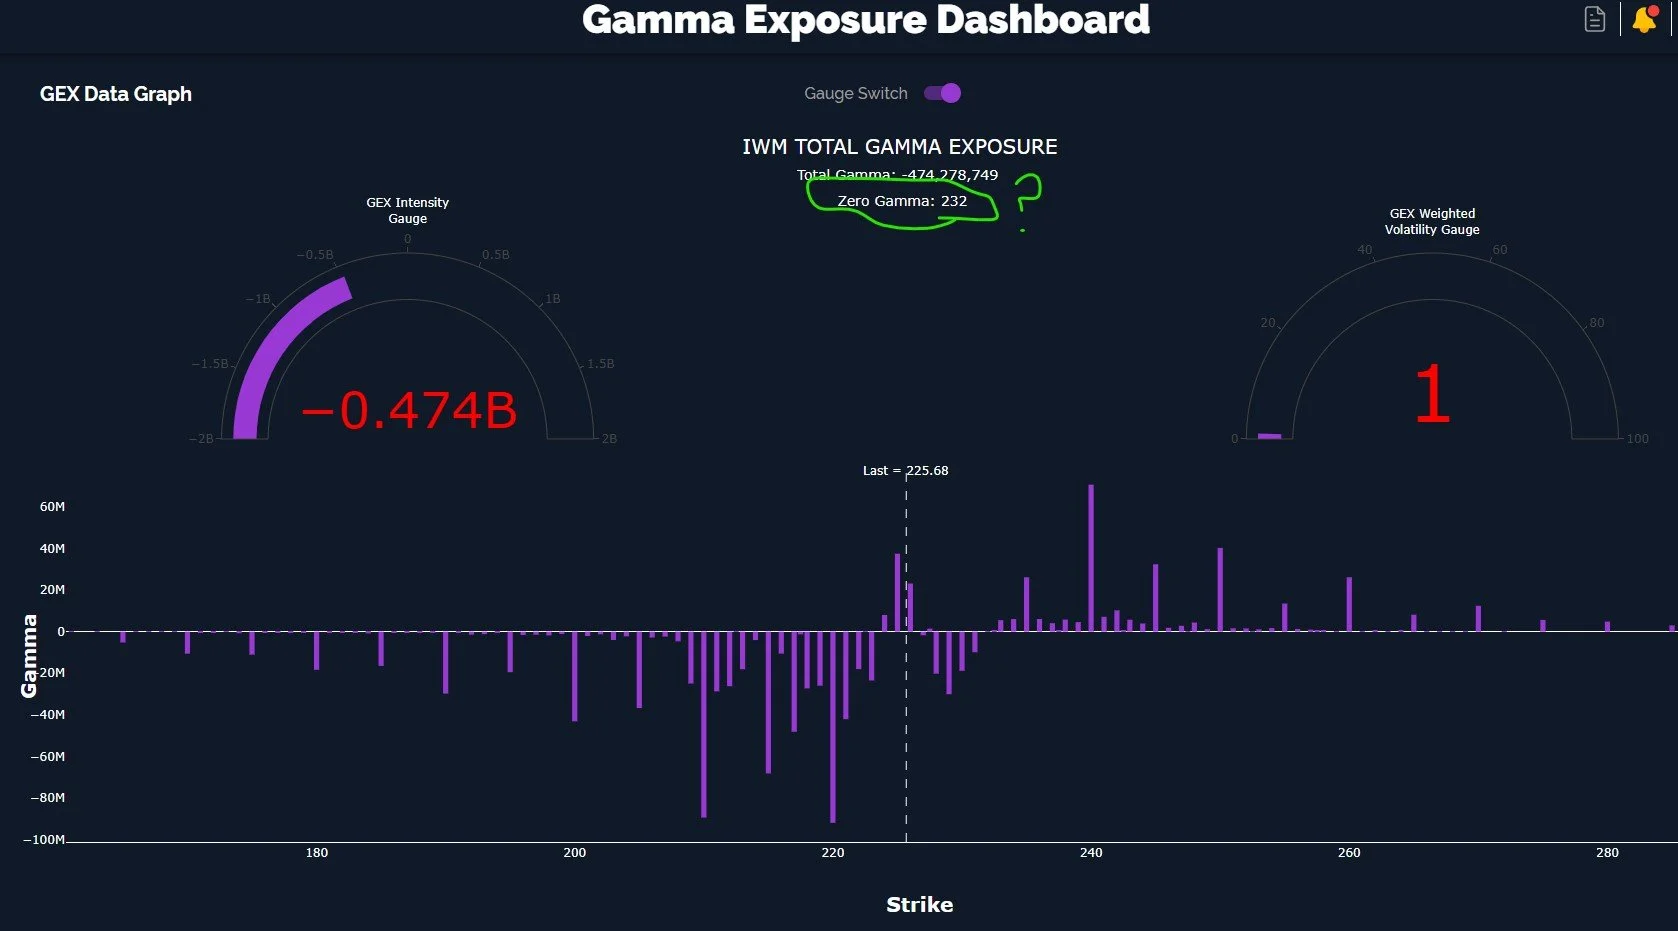
Also, notice the positive movement in GEX, even if it is still negative. One thing I’ve noticed with IWM is that the absolute GEX reading might be tricky at times, but the change in GEX sometimes gives advance notice of where price is headed, and the trend matches the price movement oftentimes. Cases in point: November 29 GEX high was only a few days after the price high, and before we really saw the downtrend emerge for IWM. After the 29th, GEX continued decreasing along with IWM’s price. GEX bottomed on the 19th and started rebounding. Price really started following the last two days, which potentially gave observant traders time to position for the follow through.

IWM’s GEX levels also seem to be helpful, with price holding the upper and lower Dealer Cluster zones as we would expect, selling off from the upper zone and turning back up from the lower zone.

One other observation as of late- with IWM and DIA’s charts looking so similar, what does DIA say about this early move up? DIA’s GEX picture is very positive, showing a variety of higher strikes in focus and very little negative GEX.

We saw elevated volume at 440, 445, and 450 today, potential upside targets as both clusters fit close to the upper Dealer Cluster zone. With DIA and IWM’s prices above the Hull and above the lower Keltner channel, and some positive signs from the GEX picture, we might see more upside from the two “troublemakers” even if QQQ and SPX begin to take the backseat to meaningful upside.

The VIX is slowly waking up again, which is a concern, but we might see a year-end push from more than one index while the VIX is revving up for a rebound. We’ll continue monitoring how the situation unfolds. Join us in Discord as we discuss what we see intraday. Hopefully GEX will give us some hints as to where we’re heading looking forward and we hope to see you there!
If you’re interested in accessing our tools and analytics, be sure to check out our website. We just rolled out 500 new tickers and speed enhancements!
If you’re interested in learning more about our strategy and approach, we address all of these topics in our Geek University course which is included in all memberships.
We recently posted a YouTube video, and we have many other short videos, so give our channel a look if you’re curious about recent market commentary and ideas as well as gamma (GEX) concepts explained.
Thanks for being part of our community and know that we invite your feedback!
The information provided by Geeks of Finance LLC is for educational purposes only and is not intended to be, nor should be construed as, an offer, recommendation or solicitation to buy or sell any security or instrument or to participate in any transaction or activity. Please view our Investment Adviser Disclaimer and Risk Disclosure.