
More Volatility Ahead?
2024 HOLIDAY SUBSCRIPTION SPECIAL- $300 off of the annual Portfolio Manager subscription! We JUST rolled out some of our last bug fixes and speed enhancements to our website today, as well as 500 new tickers on the dashboard. Check it out for yourself! Enter code HOLIDAYS at checkout! We still have 5 of 7 discounted subscriptions available for this limited time promotion.
Markets appeared to be headed lower for a split second this morning, but participants decided the pain trade was higher today, continuing the rally from Friday. We have a lot of remaining uncertainties regarding what comes next, but the semis (SMH) certainly appear to have cast their vote that their upside targets will come before additional downside. Or at least we are closer today to those targets. Will we reach those targets tomorrow? The largest gamma (GEX) cluster for SMH’s Friday expiry is negative GEX at 240, so I wonder what lies ahead. Our next newsletter will be Thursday evening, so we’ll see if the market is still positioned similarly when we get beyond the Christmas holiday. You can see our analysis of SPY, SPX, DIA, and QQQ on YouTube by clicking here. We also cover some long ideas like Proctor & Gamble (PG).
After the initial spike higher today, but still in time to grab 25 points, we pointed out that SPX showed 6000 as the largest GEX cluster for Friday. This is the kind of analysis we try to point out throughout the day for various tickers and indices:
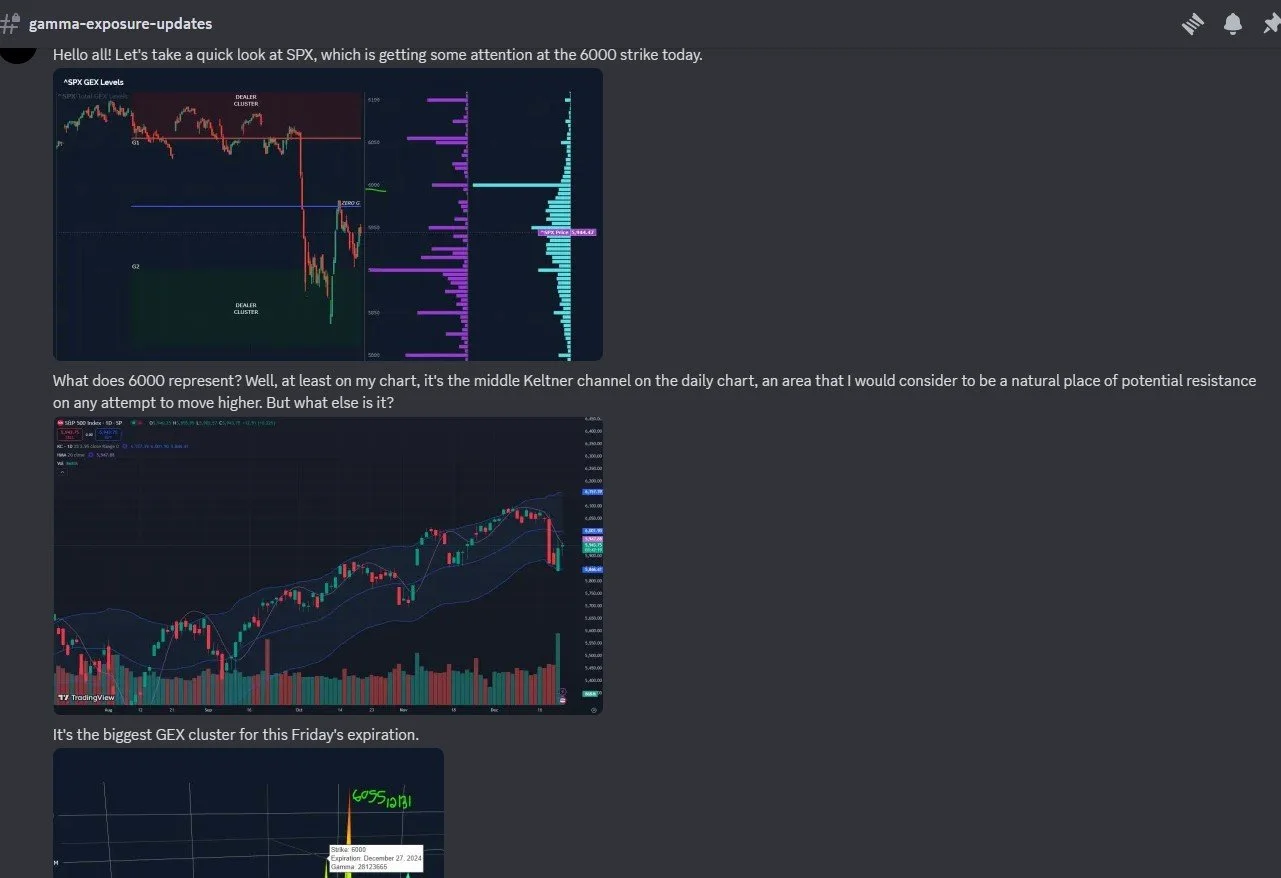
SPX is already within 26 points of 6000, so even with 1.5 trading days until Friday (don’t forget that markets close at 1PM ET tomorrow), the odds are that we’ll move at least 26 points before Friday’s expiration, so we will need to see if that picture shifts as well. SPX going to 6000 is seemingly at odds with SMH dropping to 240, so something has to give. I mean, it’s not like SMH is the Dow or anything (more on that later).
GEX aside, SPX chart seems to signal more volatility ahead, with the upper Keltner continuing to move higher, now at 6161. Will 6200 creep back into the picture with indicators like the Keltners pointing to higher prices? The lower band is definitely lower than it was a few days ago, but it’s not dropping further just yet, so I consider this to be an uncertain picture. But with SPX above the Hull Moving Average, and GEX showing 6000 as an important number for Friday, my personal bias is long as long as we’re above the Hull at 5951.

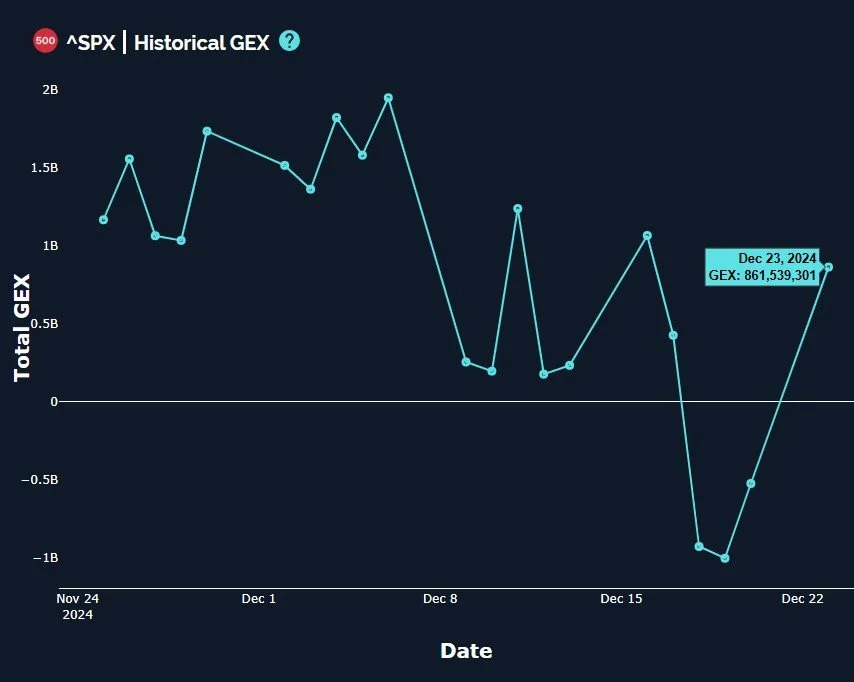
Confirming previous newsletters where we’ve brought attention to how volatile GEX has been from day to day, unsurprisingly given the market focus on 0 DTE for the last couple of years especially, GEX swung from negative to positive 861M, a huge swing.
You can see the light blue total option volume at the 6000 strike on our GEX levels chart below. Note that this is different than the GEX cluster I mentioned, which is easier to see on the 3D graph (see the first graphic displaying our Discord post). We also mentioned the ever present 6055 that has been hanging onto 12/31 for a long time now. That cluster plays into our red Dealer Cluster zone you see, reflecting an area where dealers might become sellers. Since the box is wide and reversal could happen from anywhere close to the box, we try to complement our decision making by considering other factors as well. These zones are not static, so when you see the prices in early December above the box, keep in mind the box was at a different position then as well, which our website blog and previous newsletters would show from that timeframe.

QQQ has appeared to be the most bullish index in a flip-flopping stage play with SPX all year long, but it also has more to overcome technically to open up higher prices toward 537. The Hull may theoretically provide the first test and stopping point at 526. The Keltners still look bullish, though.

QQQ’s Dealer Cluster zone fits 526 quite well, potentially extending up to 530. We still have sizable negative GEX below, and I’ve been watching those clusters in expectation that they’ll either diminish relative to the higher clusters if we are likely to move higher, or they’ll sit there staring at bulls in the face until their magnetism draws QQQ back to the depths. Okay, more like back to the top floor of the Empire State Building from the top of the needle, but you get the point.

QQQ had a similar gravity-defying lifting of the GEX from negative to positive 101M, an impressive increase worth noting, though still at a level we consider neutral.

Let’s end this brief analysis with a quick look at DIA, which I’m far more interested in personally, given my contrarian leanings. DIA started spilling off while QQQ was still climbing to new highs, and kept spilling off when QQQ finally turned down. Not very fair, is it? Presumably, the buy, hold, close their eyes and pray bulls who have held tech all year or all decade long will wait until January 1 to take their profits, pushing payment of their capital gains taxes out to 2026. Or at least that’s the status quo. But perhaps DIA is giving us an opportunity as a whole that we sometimes see with individual tickers at year-end that have underperformed: They get trashed near the end of the year for tax reasons, then rally nicely in January. I don’t know if this will happen or not, but it certainly doesn’t make sense that DIA would continue plunging without QQQ joining the party. Or DIA can play catch up, or they meet in the middle, right? Simple-minded analysis, but maybe there’s some truth in the logic.
Timewise, I like that DIA is now above the Hull, and regained the lower Keltner channel. It appears to be stabilizing after a drop for the history books. 440.49 represents the middle Keltner.

DIA also gave us an early preview Friday, swinging to positive GEX before the other indices. having reached the lower Dealer Cluster, 440 is represented above, matching the middle Keltner. Volume was active all along the pathway of higher prices, which is encouraging for bulls, too. Maybe Santa won’t leave coal (or a defective electric car battery) in the stockings of DIA holders this week after all.

We’re rapidly approaching the end of the year, so we are open minded as to how we finish the year and enter the new year. Join us in Discord as we discuss what we see intraday. Hopefully GEX will give us some hints as to where we’re heading looking forward and we hope to see you there!
If you’re interested in accessing our tools and analytics, be sure to check out our website. We just rolled out 500 new tickers and speed enhancements!
If you’re interested in learning more about our strategy and approach, we address all of these topics in our Geek University course which is included in all memberships.
We recently posted a YouTube video, and we have many other short videos, so give our channel a look if you’re curious about recent market commentary and ideas as well as gamma (GEX) concepts explained.
Thanks for being part of our community and know that we invite your feedback!
The information provided by Geeks of Finance LLC is for educational purposes only and is not intended to be, nor should be construed as, an offer, recommendation or solicitation to buy or sell any security or instrument or to participate in any transaction or activity. Please view our Investment Adviser Disclaimer and Risk Disclosure.