
6000 Or Bust
VIX expiration at 9 AM ET this morning is now behind us, with the VIX staying well within the 15-18 range that we were expecting (thanks to gamma (GEX) positioning), and NVDA reported earnings after hours. As I type this, NVDA is trading only slightly below its closing price and it’s holding above the middle Keltner channel at 142.11, which in and of itself is a victory of sorts, leaving open various possibilities for NVDA (and therefore SMH) tomorrow. In today’s YouTube video, we take a look at SPY and SPX, the VIX, GDX, and SMH.
SPX has had 3 green daily candles in a row, though overall, we are moving sideways after the gap down into OpEx. This behavior fits what we often see going into VIX expiration, so perhaps tomorrow we can see some movement. Since we are consolidating on the tail end of a multi-day decline, my inner contrarian is saying it might be time to attempt some upside again, but instead of looking within, let’s take a look at the data.

Looking at the chart above, we see that SPX is holding the middle Keltner (bullish), we’re below the Hull Moving Average (bearish), and the Keltner channels overall continue to modestly move higher (slightly bullish). The distance between the current price and the Hull leads me to believe those two points should meet, whether that means SPX rallies to test 5973 (and perhaps go beyond it), or the Hull continues dropping while SPX consolidates sideways.
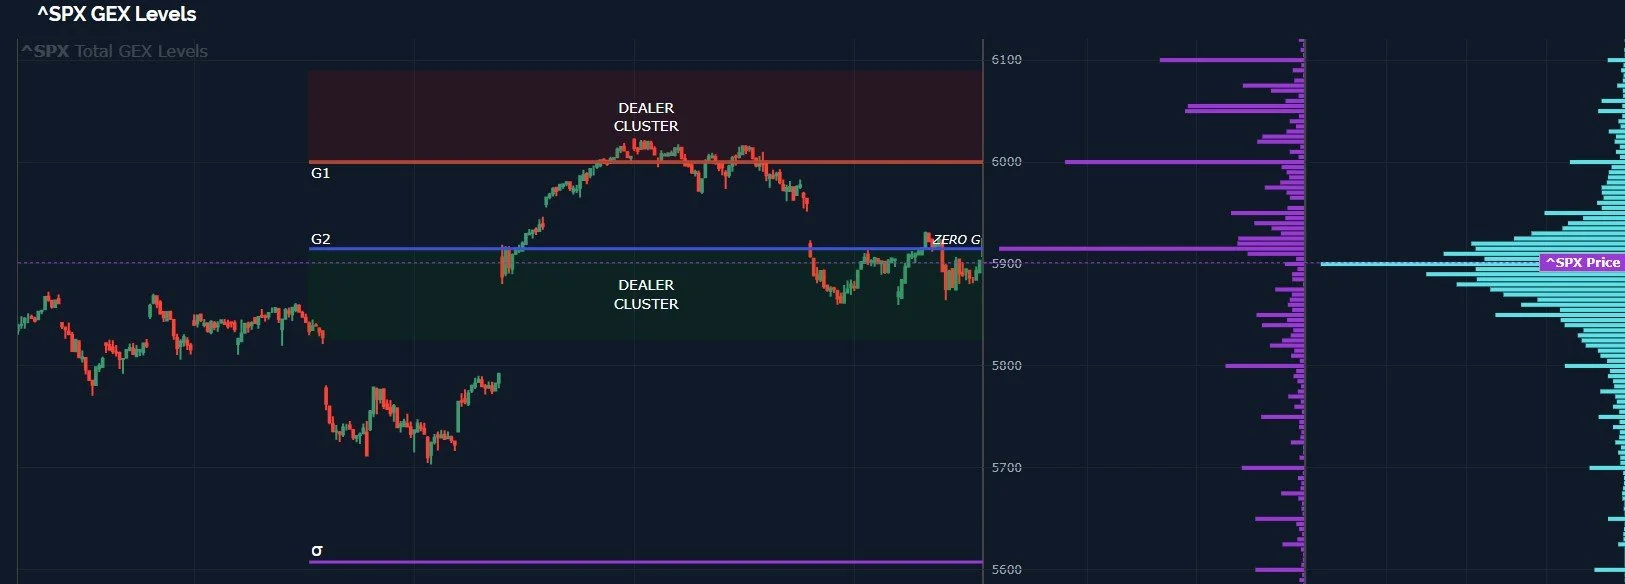
SPX GEX continues to move higher, which is a positive, though the overall range is still neutral.

SPX Historical GEX: www.geekoffinance.com
SPX is showing us that its price is within the G2 Dealer Cluster area, which is a place where dealers might be buying. The lower GEX strikes don’t seem to have a lot of interest right now, but we see large relative interest in 6000-6100. While those higher strikes appear to be the highest probability targets, a “black swan” or some other unexpected event could certainly send us lower, and the magnitude of that event may mean a larger decline as participants rush to reposition portfolios. That scenario is not as likely, but it’s always good to consider the possibilities.
SPY GEX Levels: www.geeksoffinance.com
Looking at the 3D graph below, I want to point out that the 6000 strike expiring this Friday is very prominent compared to all other strikes except for those that expired at the close today, GEX at 6000 expiring Dec 20, and GEX at 6055 expiring December 31. There’s no other way to interpret that other than that participants are bullish into the end of the year (alright, there are some explanations involving aliens and the supernatural, but we’ll leave those out).
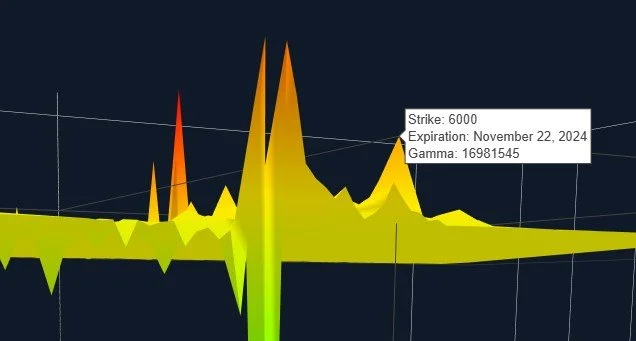
SPX 3D GEX Graph: www.geeksoffinance.com
We discuss SMH in our YouTube video, so I won’t rehash the same points, but let’s add some additional context and a different look at the ETF, starting with some different chart indicators. It’s bearish that SMH has really underperformed SPX and QQQ recently, particularly because SMH has been the leading sector for virtually the entire bull market. Does SMH signal we’re topping? For what timeframe might we be topping? The answers to these questions can vary, so we won’t spend time on the theoretical and implications for the distant future. The chart is showing that SMH should find support anywhere from where it is now down to 234, and the sharply declining Hull will soon cross under SMH’s price, which will put it on a buy signal using my methodology.

SMH is below the zero GEX line, yet above the lower G2 Dealer Cluster Zone, so we can’t draw any high-probability conclusions from this information. We do see a lot of GEX clusters above, and the highest volume was at higher strikes, but we did see meaningful volume at lower strikes as well. The largest GEX cluster is still below the current price, too.

SMH GEX Levels: www.geeksoffinance.com
On the marginally positive side, we see SMH’s GEX poked over the line to the positive side of life, even if it’s barely over the line. The increase in GEX from the OpEx lows was clearly positive, though.

SMH Historical GEX: www.geeksoffinance.com
Lastly, we see the zero GEX level at 245 and a large positive GEX cluster at 250 as the nearest potential upside targets, if we don’t go straight for the 234 area instead. SMH’s move tomorrow will likely be largely influenced by NVDA, so we will take a look premarket to see which direction is appearing to be the chosen one.
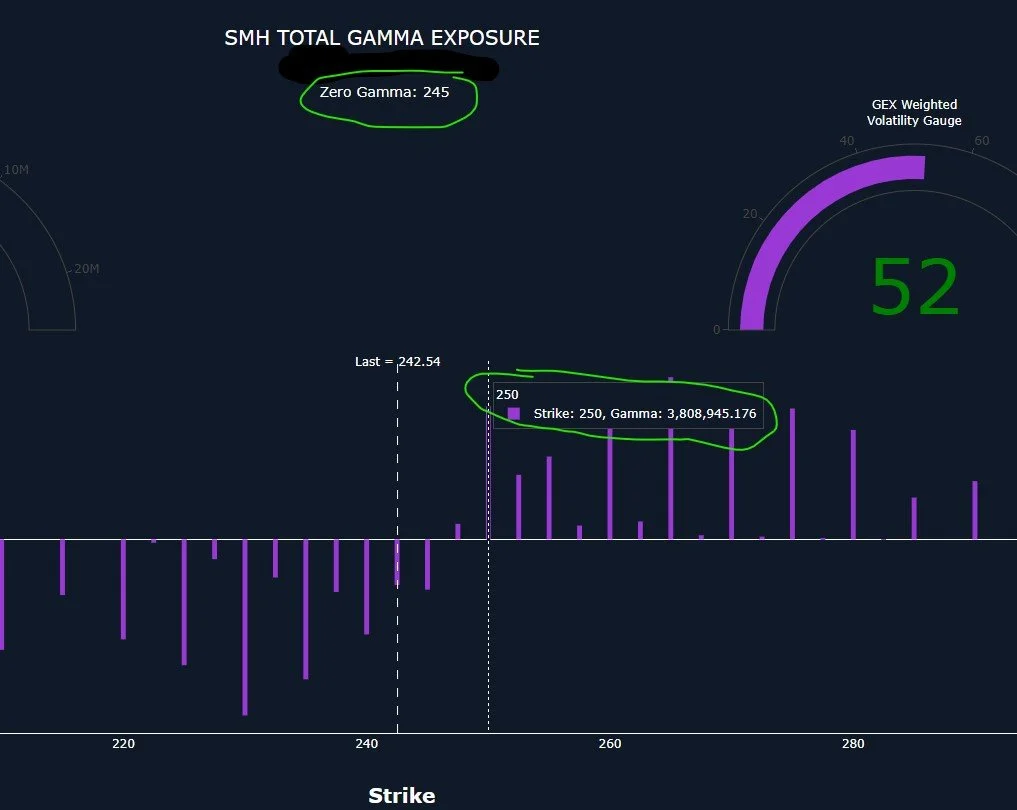
SMH GEX Data Graph: www.geeksoffinance.com
In summary, SPX appears to have fairly good odds to make an attempt higher toward the gap fill and potentially 6000-6055. We can speculate that Friday might be a target date for 6000, but we will likely have a better idea of that once we see the market’s reaction to NVDA, or perhaps the rally will be postponed until we’re beyond this week (assuming the GEX picture maintains those higher targets). Regardless, we have been receiving timely clues from GEX along the way and we’ll continue watching for helpful developments.
Looking at today, for example, we started out with SPX clearly showing a large GEX cluster at 5850, over 40 points lower at the time. It didn’t take long to see roughly 35 points lower from our post in our Discord 0 DTE channel. Other members took new trades in the afternoon and shared those as well. Join the conversation in Discord tomorrow and we’ll report what we’re seeing as the data unfolds!
If you’re interested in accessing our tools and analytics or taking advantage of our promotion (see the top of this newsletter), be sure to check out our website.
If you’re interested in learning more about our strategy and approach, we address all of these topics in our Geek University course which is included in all memberships.
Thanks for being part of our community and know that we invite your feedback!
We recently posted a YouTube video and we have many short videos for you to review where we cover a variety of predictions and educational topics.
The information provided by Geeks of Finance LLC is for educational purposes only and is not intended to be, nor should be construed as, an offer, recommendation or solicitation to buy or sell any security or instrument or to participate in any transaction or activity. Please view our Investment Adviser Disclaimer and Risk Disclosure.