
Already Dropping, Nothing From The VIX?
Before we jump into the doom and gloom portion of the newsletter (just kidding, only gloom for short-term market bulls), here’s the link to our YouTube video recorded today. It’s barely over 7 minutes long and we cover SPY, the VIX, IWM, TLT, GLD, and GDX.
We had yet another negatively correlated day for VIX and VVIX (a concept we discuss in yesterday’s newsletter), making 3 of the last 4 days negatively correlated. This time, the VIX was up while VVIX was down, whereas the last few times saw VVIX up and the VIX down. This and several other reasons give cause for concern that a VIX spike might be just around the corner. We’ll hit on a few of these reasons below.
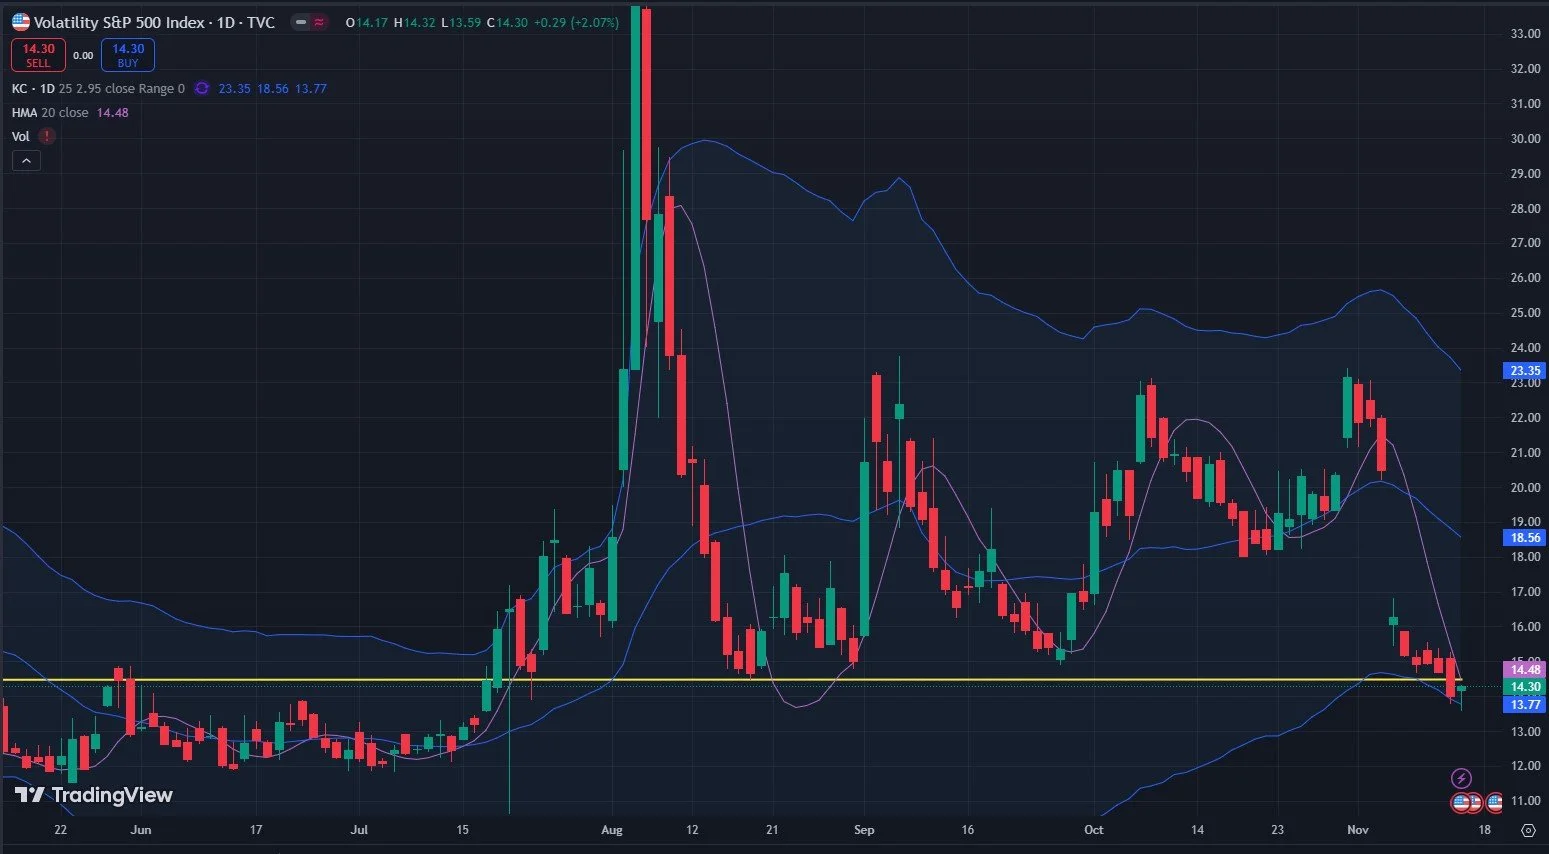
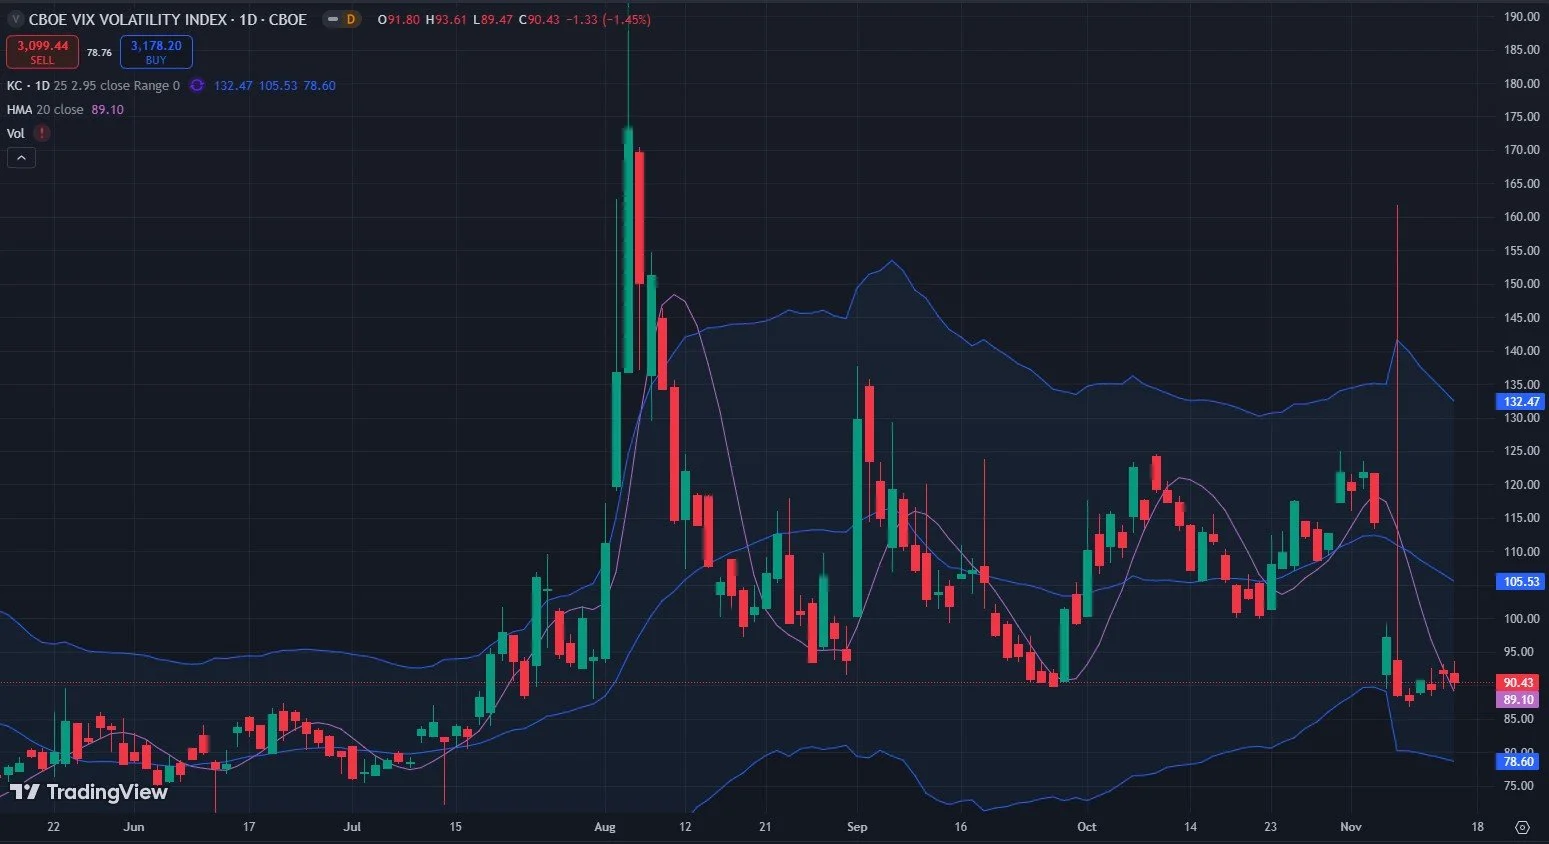
Looking at the VIX above, the sharply declining Hull Moving Average is almost below the VIX price, and when that crossover occurs, my rules say to be biased long whatever instrument we’re looking at (gamma and other factors considered). So that alone says we’re probably very close. Looking at the index measuring the future expected volatility of the VIX, the VVIX, we just saw the crossover today, despite the red candle. So both charts show the Hull either indicating to go long volatility or very close to that trigger.
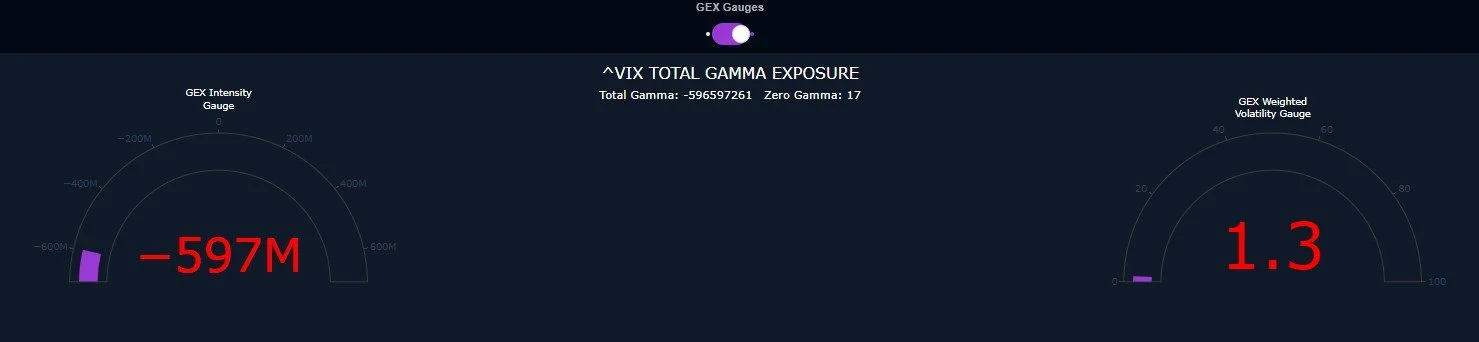
I want to focus on a couple of gauges found on our VIX GEX graph below (only part of the web page is shown). On the left, you see the GEX Intensity Gauge, this compares the current GEX and compares the relative reading to the last 52 weeks. The gauge is telling us that we are basically at an extreme level of negative GEX on the VIX compared to the last year, which can be a contrarian signal to consider going long volatility.
On the right, we have the same relative comparison, but this time we see a comparison of implied volatility. This reading of 1.3 is also at an extreme. One way to read this is to say the market is not pricing VIX options in a way that indicates any expectation of heightened volatility ahead. I think I’ve said it before, every chart I’ve seen shows periods of low volatility preceding high volatility, and vice versa. One thing I want to note is the small letters in the middle of the page that indicate the zero GEX level is at 17..We’ll come back to that.
VIX Data Graph: www.geeksoffinance.com
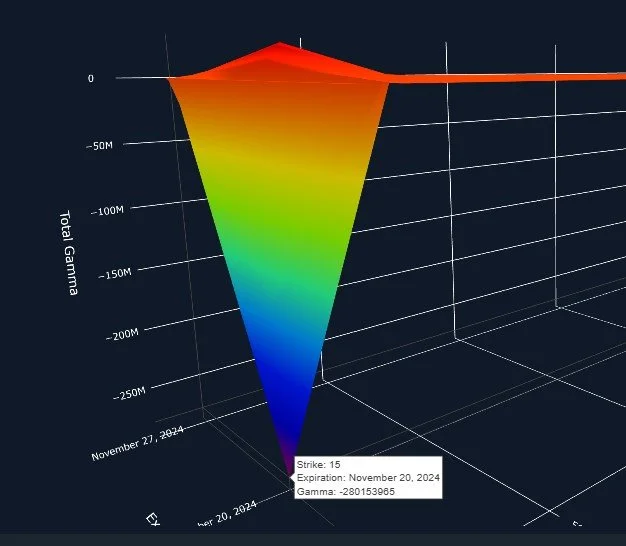
With the VIX expiration set to occur this coming Wednesday morning at 9 AM ET, we can see that the largest GEX cluster is at 15, and it’s negative GEX. We also already see the VIX below that largest strike, at roughly 14. Unlike many prior VIX expirations recently, we see virtually no positive GEX clusters, or at least they are much smaller in size. Zero GEX is at 17. Will dealers allow all of the put holders at 15 to get rich by Wednesday after a blistering run for bulls that has gone on for 10 days, or will they receive a little pre-Thanksgiving humble pie? Not that the volatility bulls will get rich either, but a move up toward the zero GEX line at 17 would see a lot of premium killed on both sides, unless someone goes long volatility here while no one wants it.
We might also see this iron grip maintained until we get through Wednesday, but I have a few reasons to believe we might see some fireworks sooner than that (admittedly speculative and my own personal view).
VIX 3D Graph: www.geeksoffinance.com
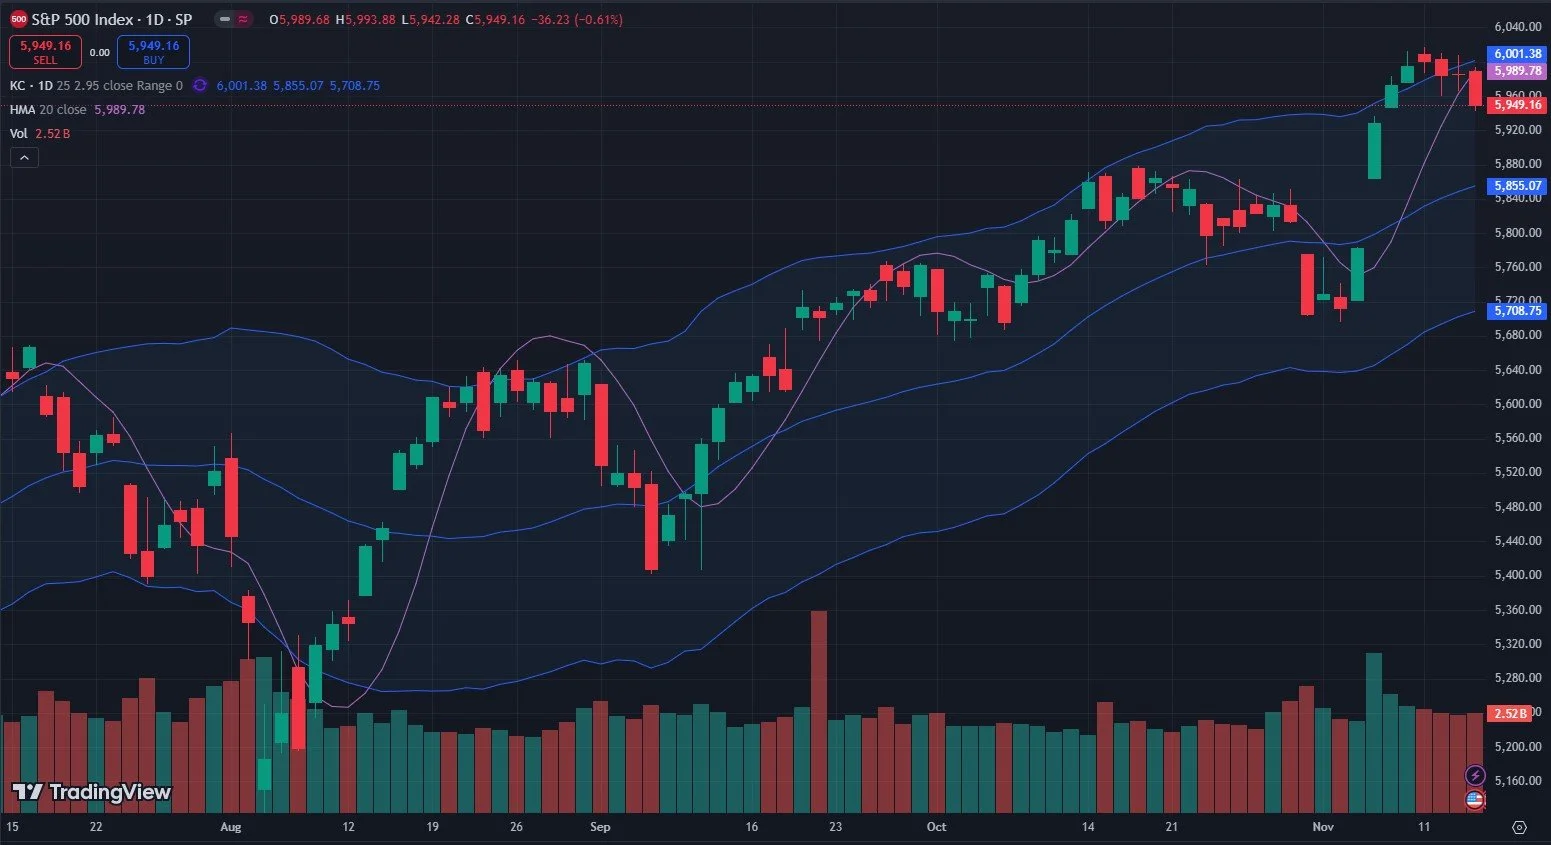
The S&P 500 has broken below the Hull, which is a short signal for me. GEX often matches my Keltner channels and the Hull, and when it doesn’t, I tend to go with GEX. But most of the time, I’ve noticed the GEX clusters fit fairly nicely within the context of these indicators. SPX has a target of 5855 for this move lower, according to the Keltners. This doesn’t mean we can’t rally and test 5990 from below as support turned resistance.
SPX actually shows the most mild drop in total net GEX, still indicating a neutral 522M.

SPX Historical GEX: www.geeksoffinance.com
QQQ ‘s chart looks similar to SPX in terms of the indicators. For QQQ, I’ll be watching 498-500.

QQQ’s total GEX ended today on a far more sour note than SPX, but that doesn’t make the reading more valid than SPX. It’s just interesting to see that the heaviest tech sector is indeed feeling quite heavy at the moment.
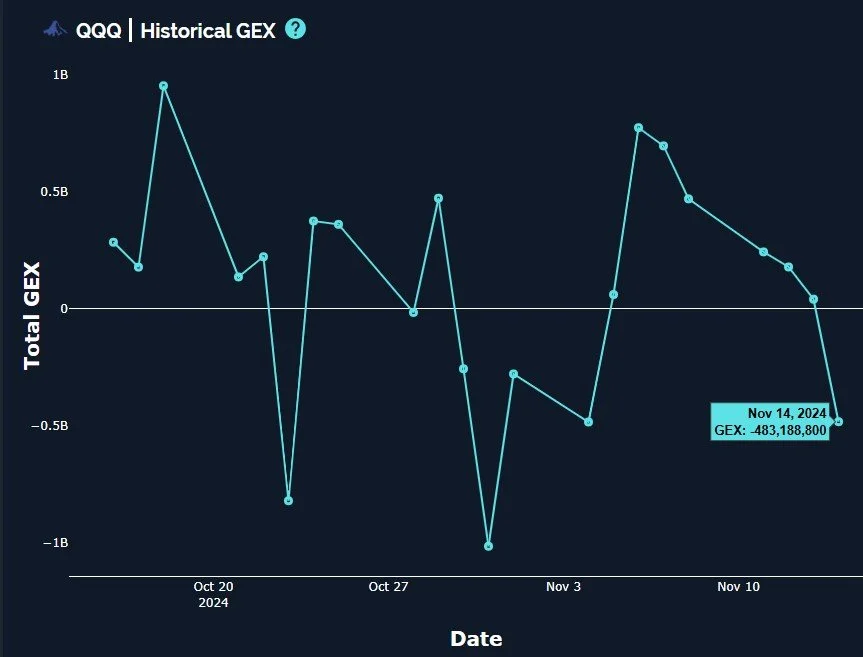
QQQ Historical GEX Chart: www.geeksoffinance.com
Yesterday, we did point out that 515 was still a positive cluster visible as a potential target if QQQ could turn things around, and NVDA also had a favorable setup for potentially reaching 150. Well, the 515 cluster is still there, but it is now dwarfed by a very large negative cluster for tomorrow at an interesting 500. 500 is fairly close to the middle Keltner we looked at a couple of charts back at 498. It’s also almost 2% lower, so tomorrow might be interesting. Will -2% finally get the VIX to come alive? I’m not sure about that, perhaps a vol wiz crunching numbers in their basement as they chug on a Celsius could give us the math, but otherwise, we just have to wait and see what happens.
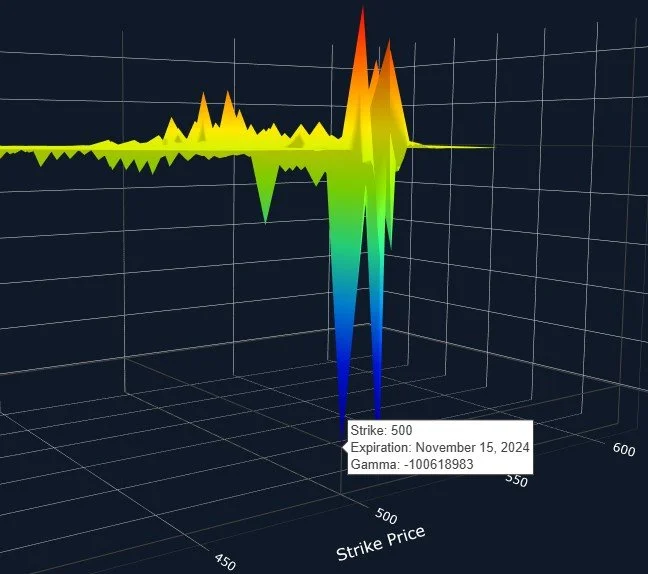
QQQ 3D GEX Graph: www.geeksoffinance.com
Join the conversation in Discord tomorrow where you’ll see what we’re doing as well as other successful and experienced traders who are part of our community. Today we had some successful shorts after discussing the early 0 DTE GEX positioning on QQQ and SPX. We’d love to have you with us!
If you’re interested in accessing our tools and analytics or taking advantage of our promotion (see the top of this newsletter), be sure to check out our website.
If you’re interested in learning more about our strategy and approach, we address all of these topics in our Geek University course which is included in all memberships.
Thanks for being part of our community and know that we invite your feedback!
We recently posted a YouTube video and we have many short videos for you to review where we cover a variety of predictions and educational topics.
The information provided by Geeks of Finance LLC is for educational purposes only and is not intended to be, nor should be construed as, an offer, recommendation or solicitation to buy or sell any security or instrument or to participate in any transaction or activity. Please view our Investment Adviser Disclaimer and Risk Disclosure.