
Building Negative Divergences
Markets started out higher on the CPI report this morning as the cash session opened, but QQQ immediately faded, while SPX and IWM held their gains for the most part and didn’t top out until the lunch hour. There were times when IWM seemed to be a better hedge to QQQ than the VIX, with the VIX seemingly falling no matter which way the market squiggled, while IWM seemed to ebb and flow opposite QQQ. In today’s YouTube video, we discuss SPY, SPX, SMH, NVDA, and more, so check out the shared link for additional insights.
Looking at the big picture, it’s not necessarily bullish for the VIX to get completely demolished while the market starts printing doji candles at all-time highs. Where is the market supposed to go after moving sideways for days while the VIX finally bottoms? Continuation higher while the VIX goes from zero to negative, like oil in 2020? That was a sight to see. I’ll leave the non-comedy conclusion to your own Beautiful Minds.
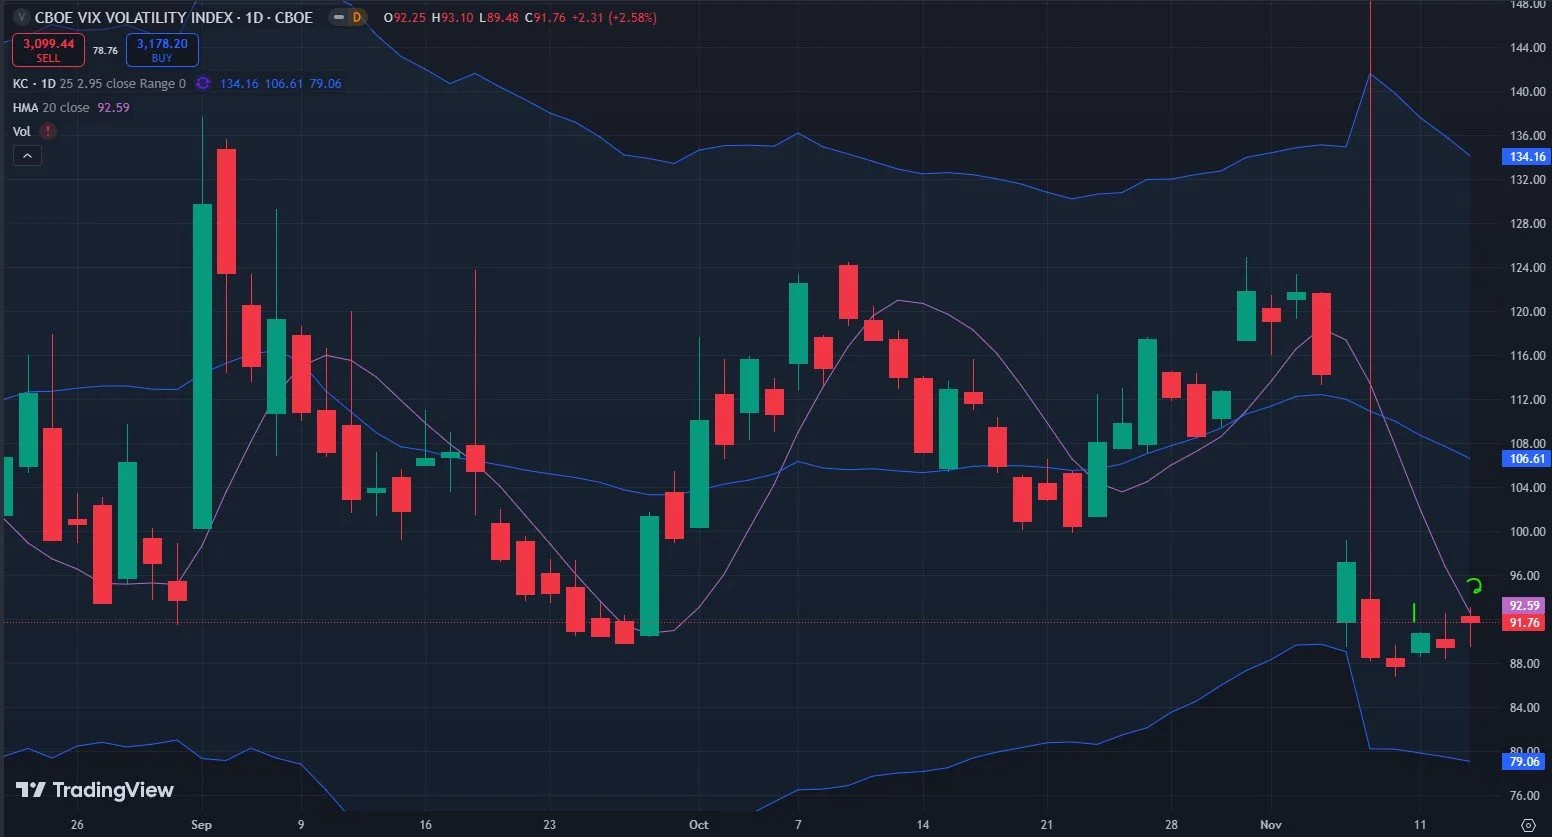
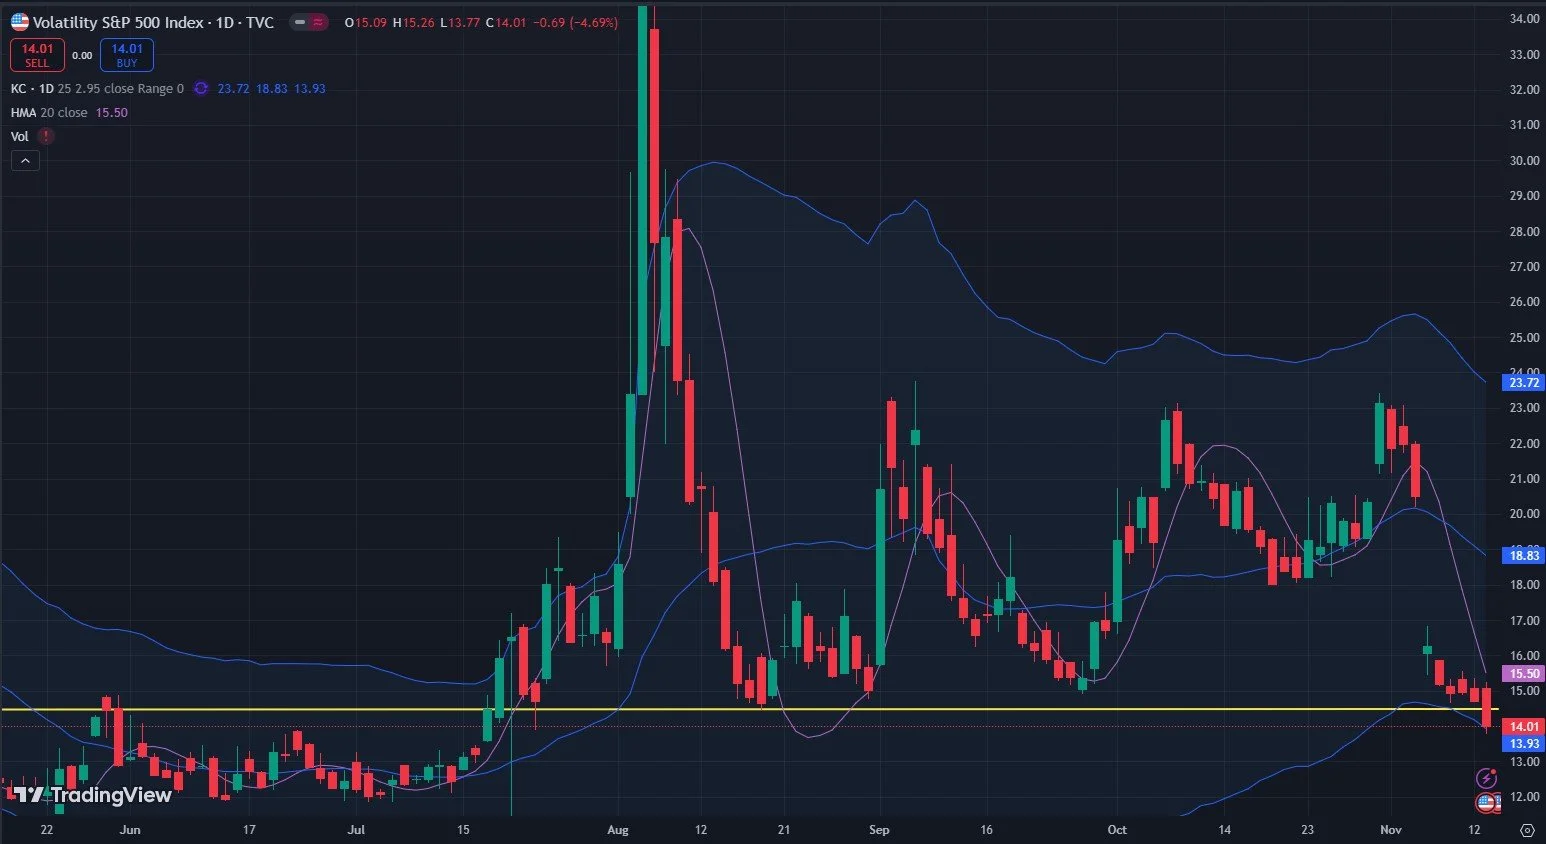
A divergence that has worked very well in the past is when the VVIX (chart shown above), the index measuring future expected volatility of the VIX, is negatively correlated to the VIX itself. String a few days together where they are moving in opposite directions, and you get a pretty good indication of a VIX spike within a few weeks’ time. It’s not an immediate or exact indication necessarily, but in general, such occurrences are a red flag for market bulls. This indicator can occur during bull markets, so it may or may not be signaling an upcoming market pullback instead of a full-blown bear market, so don’t draw conclusions that are too wild from this. But looking at the VVIX above, 2 of the last 3 days have seen higher closing prices than the prior day, while the VIX (chart shown below) has closed lower every day. 2 out of the last 3 days starts to become a trend to watch. Keep in mind the VIX just overshot the support/resistance line I’ve been watching and now sits at the lower Keltner channel, a logical place to expect a volatility reversal as well.
The sharply rising Hull Moving Average is right up against QQQ’s price, which doesn’t leave a lot of room for QQQ to wiggle before breaching the Hull to the downside, or a rally to the upside will once again put QQQ above the upper Keltner channel, a possible outcome though unlikely to stick as a lasting condition. So we’re left with a fairly high likelihood that QQQ will be below the Hull in coming days, triggering a short signal according to my chart indicators.

QQQ’s gamma (GEX) continues to decline, closing neutral but almost to the zero line today.

QQQ Historical GEX: www.geeksoffinance.com
QQQ still leaves the possibility of not declining significantly immediately, which would be understandable in general given that this is monthly option expiration week, and the VIX monthly options expire next Wednesday morning. In addition to the premium killing tendencies of many OpEx weeks, we can see the 3D GEX graph demonstrating the large GEX cluster at 515 for Friday, the largest cluster outside of today’s expiration, which will disappear before tomorrow’s open. The current GEX picture suggests 515 may still be a magnet for Friday, so any attempt to decline tomorrow may be met with the same “stick save” behavior we saw today, though that’s yet to be seen.
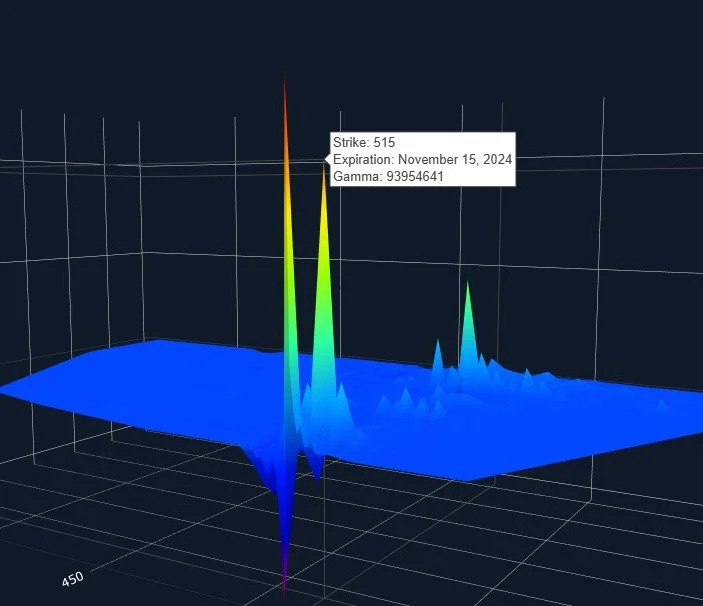
QQQ 3D GEX Graph: www.geeksoffinance.com
Another negative sign for QQQ is SMH, which we discussed yesterday, and today SMH gapped below the middle Keltner and followed through to the downside. The GEX picture is still unclear and we discuss a potential short-term bullish play with NVDA into Friday, so this is no slam dunk either. But the big picture for SMH lends reason to be cautious about QQQ as well, at least for the possibility of a pullback soon.

IWM was looking more bullish earlier in the week, with 245 in focus, but today saw a meaningful drop back to the top of the daily Keltner channel. One potential positive is that IWM is now in a G1 dealer cluster zone, so the current price may represent a spot where IWM will attempt a rebound. At this point in the short run, it’s hard to count on more than 240 as a rebound target, but this can change just like it did yesterday.

IWM GEX Levels: www.geeksoffinance.com
Even with all of the uncertainty, including the PPI report tomorrow morning, we are still managing to find trades during the day using same-day expiration GEX data on index ETFs and some individual stocks. Today we had a fairly good broadcast from QQQ and SPX that the bias would be lower in the morning, and we reached lows that were pretty close to what GEX was indicating. Join the conversation in Discord tomorrow where you’ll see what we’re doing as well as other successful and experienced traders who are part of our community.
If you’re interested in accessing our tools and analytics or taking advantage of our promotion (see the top of this newsletter), be sure to check out our website.
If you’re interested in learning more about our strategy and approach, we address all of these topics in our Geek University course which is included in all memberships.
Thanks for being part of our community and know that we invite your feedback!
We recently posted a YouTube video and we have many short videos for you to review where we cover a variety of predictions and educational topics.
The information provided by Geeks of Finance LLC is for educational purposes only and is not intended to be, nor should be construed as, an offer, recommendation or solicitation to buy or sell any security or instrument or to participate in any transaction or activity. Please view our Investment Adviser Disclaimer and Risk Disclosure.