
Onward & Upward- For Now
Thursday evening, we mentioned some reasons why SPX might not hit 5900 on Friday. While 5900 was a possibility, the largest gamma (GEX) cluster expiring Friday the 18th was 5875, with most of the 5900 GEX clustered around the 10/25 area. I present this data (and other similar moments in prior newsletters) not so much to pat ourselves on the back, but rather to illustrate the many examples of GEX helping us to form a more accurate picture of how things are likely to play out, positively influencing our own decision-making processes. We hope our service can become useful to your process as well!
We recorded a brief YouTube video chock full of analysis of some new ideas that you may want to research for yourselves as we get started in the new week. We cover SPY, IWM, NVDA, AAPL, AMZN, NFLX, and SHOP. Some of these we’ll address now as we take a look at where things stand as of Friday end of day (EOD). You can find the video by clicking here.
Let’s jump right into SPY specifically, whose chart appears virtually the same as SPX, but we will highlight a couple of divergences for the sake of making a point. Ever since October 8, SPY and SPX have been above their Hull Moving Average, which is one signal I use to help shape my overall long or short bias. Since we’re above, we’re bullish. Of course GEX matters too, and (especially for SPX) GEX has been bullish as of late. Two important boxes checked off. Looking at the Keltner channels, SPX is finally reflecting 5900 as the top Keltner, with time having been the important factor allowing the Keltners to catch up with what GEX had already told us was a viable upside target. We now see SPY’s largest GEX (excluding Friday’s expiry, which is gone by tomorrow morning) at 590, so the Keltners are catching up for SPY, too.
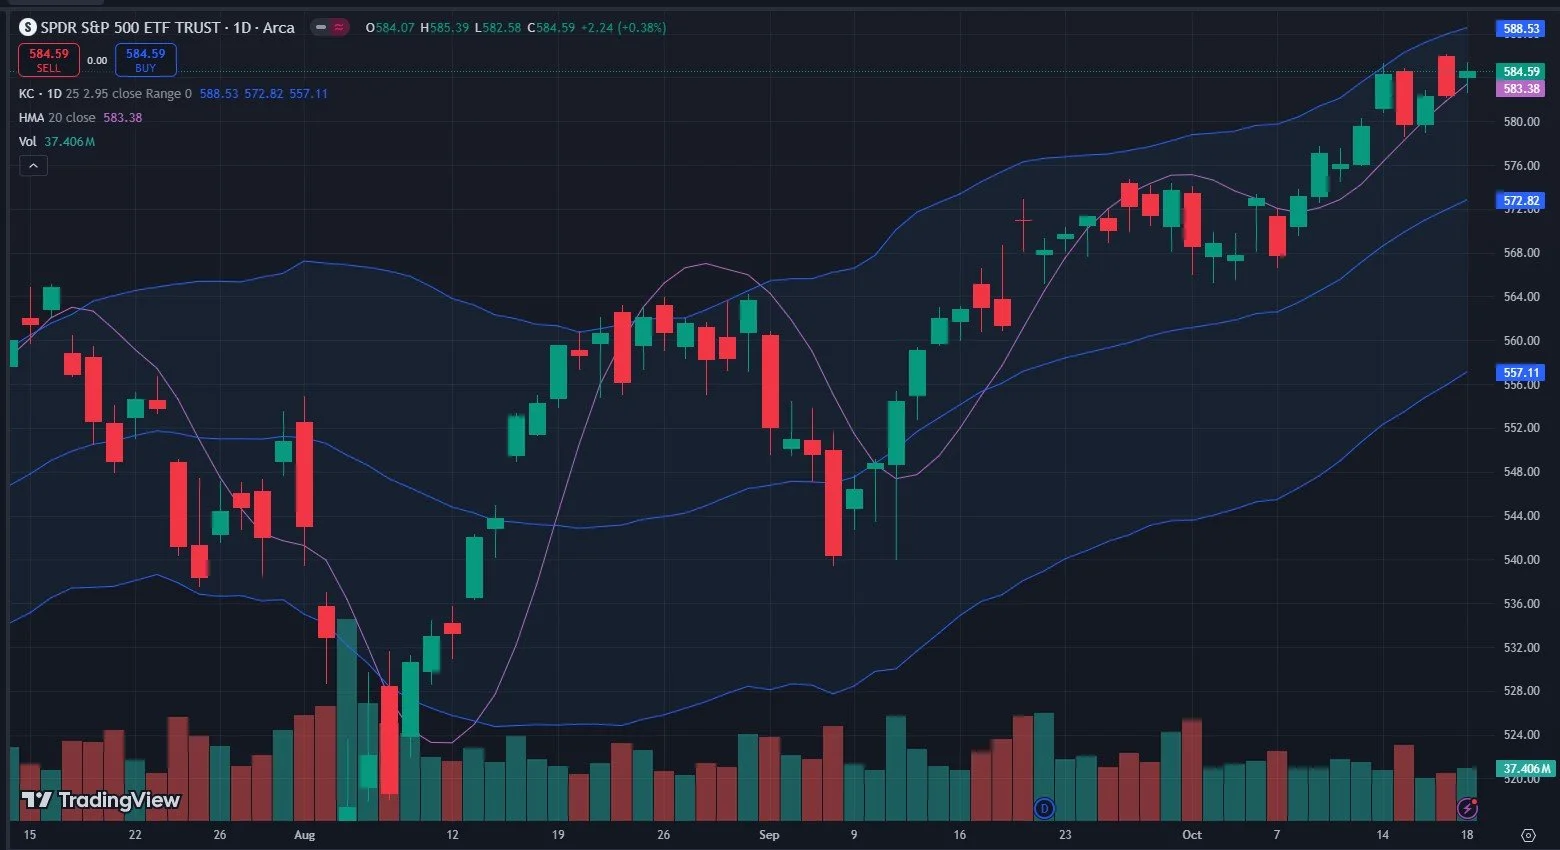
While we are up against the red upper Dealer Cluster Zone, we’ve bumped up against the lower edge a few times, so we believe the likelihood is even higher that we delve further into that zone. GEX resetting this week should also give us a clearer picture as to how this zone is reshaped around the 590 level.
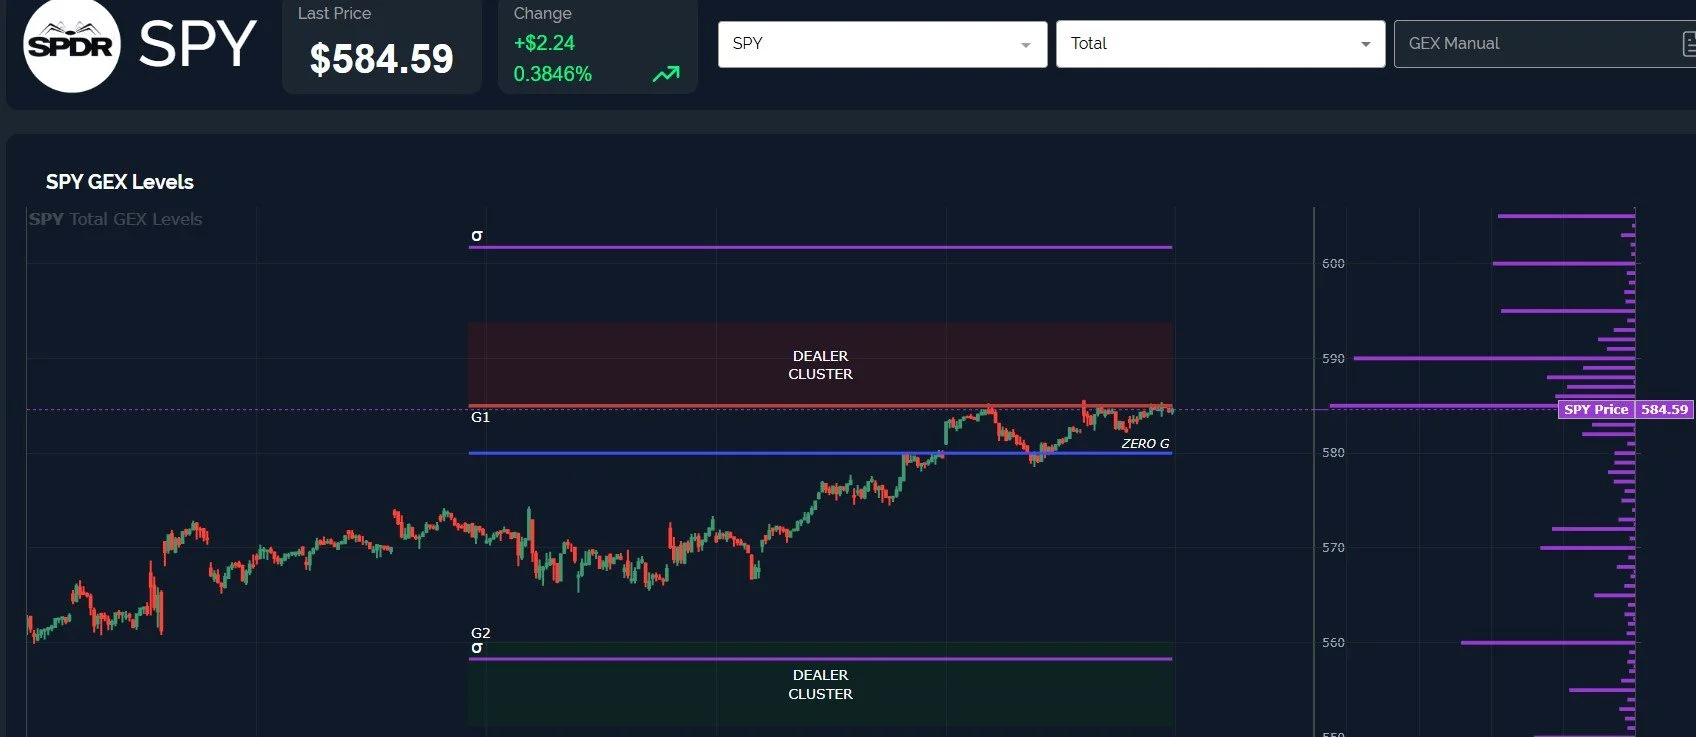
SPY GEX Levels: www.geeksoffinance.com
This is where we start to notice some nuanced differences in SPY versus SPX. I believe a lot of the difference stems from the different crowds trading the two vehicles. Keep in mind that you can’t buy SPX as an index, you can only trade the underlying derivatives in the form of options, whereas SPY has a lot of retirement account and retail influence. SPY total GEX has been vacillating back and forth fairly dramatically, more so than SPX, which has more institutional and professional trader influence. So below, we see SPY rising further, close to previous GEX highs, while SPX actually dropped.
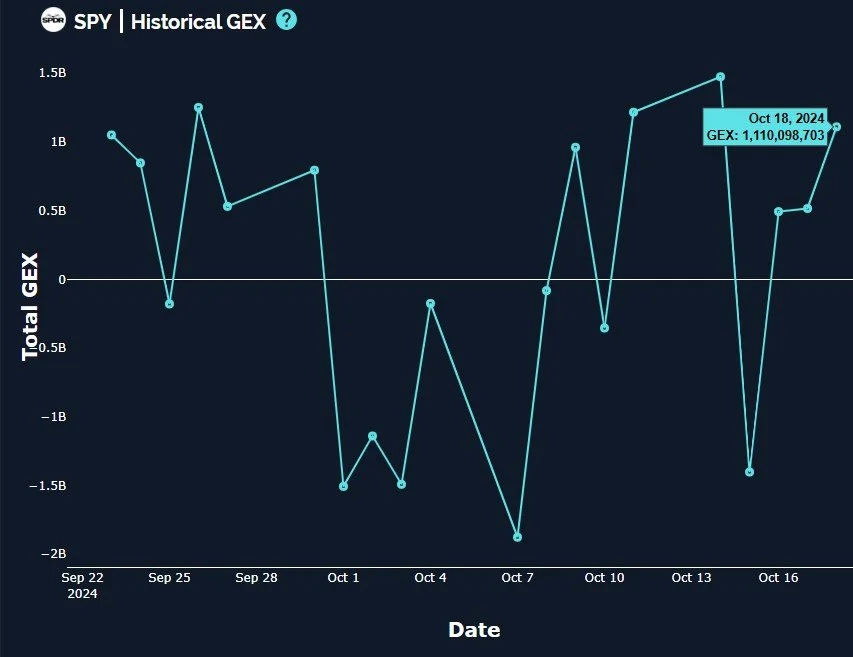
SPY Historical GEX: www.geeksoffinance.com
Is this some sort of early warning signal from SPX, while SPY retail participants have created more of a contrarian signal? I think regardless, any usefulness from such signal may still be early, and SPX at +1.1B is still in solid bullish territory. We’ve highlighted the possibility of the two showing different results for the sake of important inflection points in the future. One specific moment I remember was after that first big selloff into Spring of 2023, when Silicon Valley Bank collapsed. SPY signaled big negative GEX…Right at the bottom. SPX was completely opposite and led us to initiate some profitable bullish positions as we approached the Summer.
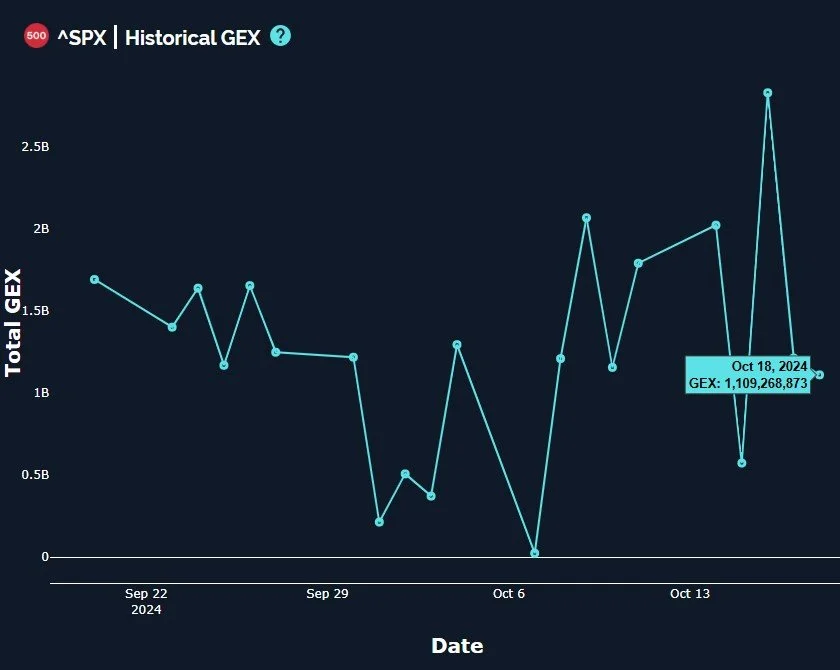
SPX Historical GEX: www.geeksoffinance.com
It’s no secret that I like to use the 2-hour and 4-hour Keltner channels for the VIX, which are currently turning lower. Last week, the VIX GEX picture really caught my attention with the big shifting of levels downward, with the G1 cluster now in the 15 area. And look at the volume at lower strikes as of Friday. Not the most bullish sign for volatility in the short run! However, in the very short run, with the VIX at the zero GEX line and the chart showing an area of logical support, We may still see a mini volatility spike that I’m expecting will be sold until the VIX reaches 15. Volatility is tricky to predict, if not, a lot of short volatility funds would still be around that went belly up in recent years, but this appears to be a viable picture. 15 has been support since July, so I would be surprised to see the VIX lower than that, though.

VIX GEX Levels: www.geeksoffinance.com
IWM looks bullish, holding above the Hull and the upper Keltners are close to 230. GEX is positive, and 230 is also a big GEX cluster, so as long as we hold 224, this looks realistic. A more speculative view is that IWM may have more upside into year end, too, but we will take it one step at a time as GEX adjusts and gives us better shorter term visibility.

AMZN is also holding the Hull since October 9, and the upper keltner at 198 is very close to the GEX G2 Dealer Cluster Zone overhead at 200. That’s a fairly big move and the stars seem aligned for more upside. My personal preference would be for AMZN’s price to hold above 187 to keep 200 in view.

AMZN total GEX looks…Excited, to say the least. One chart I don’t share here is our GEX Data Graph, which also shows that AMZN’s GEX is not at a historical extreme, there’s room above for GEX to increase before it would become a potential contrarian signal, so this is a solid sign that the bulls may maintain control for the time being.

AMZN Historical GEX: www.geeksoffinance.com
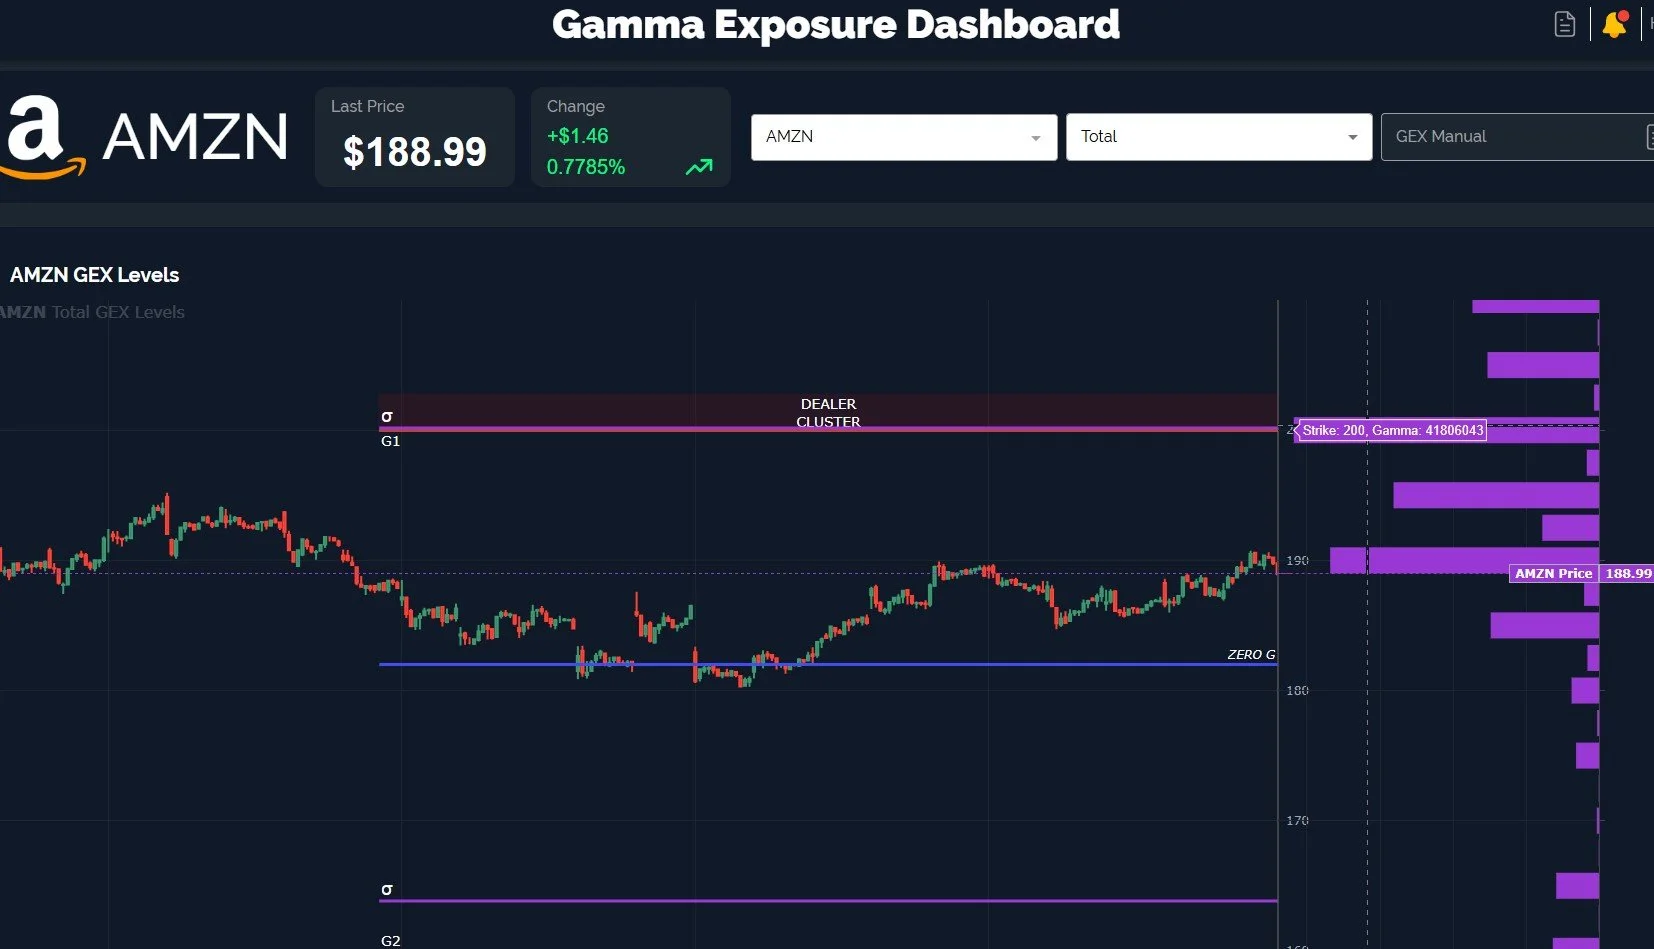
AMZN GEX Levels: www.geeksoffinance.com
Win, lose, or draw, we try to avoid the pretzel-twisted mental gymnastics of trying to appear right no matter the outcome. We just try to share straight-forward ideas with our own view of what we want to see, and hopefully that stimulates some research on your end. We have earnings reports kicking into full gear, which we’ll spend some time on tomorrow evening as we look at the calendar for the full week. In the meantime, we hope you’ll join us in Discord for real-time insights throughout the day and we look forward to interacting with you!
If you’re interested in learning more about our strategy approach, we address all of these topics in our Geek University course which is included in all memberships.
If you’re interested in accessing our tools and analytics, be sure to check out our website!
Thanks for being part of our community and know that we invite your feedback!
We recently posted a YouTube video and we have many short videos for you to review where we cover a variety of predictions and educational topics.
The information provided by Geeks of Finance LLC is for educational purposes only and is not intended to be, nor should be construed as, an offer, recommendation or solicitation to buy or sell any security or instrument or to participate in any transaction or activity. Please view our Investment Adviser Disclaimer and Risk Disclosure.