
Approaching Earnings…And Resistance
Not only do we have monthly option expiration for markets and the VIX between Wednesday morning and Friday, but we also have earnings season beginning, with some big-hitter financials, a few industrials, and some tech names worth watching as we step into Tuesday onward. And, fittingly for OpEx, the Fed stacked up their circus performers for Friday, with four speeches before lunchtime (the first and last being conducted by Bostic).
We posted a YouTube video this evening where we discuss the market as of today’s close and a few possible opportunities to evaluate on the long side, including SMH, TSLA, INTC, GOOG, and even the VIX (we also hedged our Educational Portfolio today, FYI). You can watch the short video by clicking here.
I thought it was sort of a boring day personally, but opportunity still came knocking. It’s not always easy to trade gap ups or gap downs, even if the prevailing direction of the gap continues, because there can often be a lot of waiting around or even retracement before proceeding down the indicated premarket pathway, if we even continue the same direction. When we indicated 5865 was the largest intraday gamma (GEX) cluster at 10:05AM ET in Discord, 15-20 points of profit remained to be taken, but it took the rest of the day to see it. Busy bodies who enjoy placing lots of trades back and forth might not be happy with the simplicity of one trade, but we deal with what the market gives us, and this meant making money the lazy way. Technically, you wouldn’t have needed a chart, just the GEX data graph, though I know that’s a mindset change some of you might not be ready to make (“I need my chart squiggles!). GEX didn’t indicate much happening beyond 5870, and nothing did happen beyond 5870.

SPX GEX Data Graph: www.geeksoffinance.com
SPX reached the 5850 GEX target and then some, and in fact, the entire structure shifted a bit to indicate more upside toward the 5900 area. The Keltners are appearing blow-off uber bullish with an extreme upside bias, sort of scary for a contrarian like myself, but that’s why we have data points to consider to mitigate the fear. And those indicators aren’t telling me to short just yet. The current Keltner upper boundary is now 5862, and the largest GEX cluster is now at 5900, so if these two end up converging (not a requirement by any means), it might signify another few days until the top, or perhaps an overshoot while QQQ tackles 500+. Maybe that’s why Bostic has two speeches Friday…Just kidding. Sort of kidding.
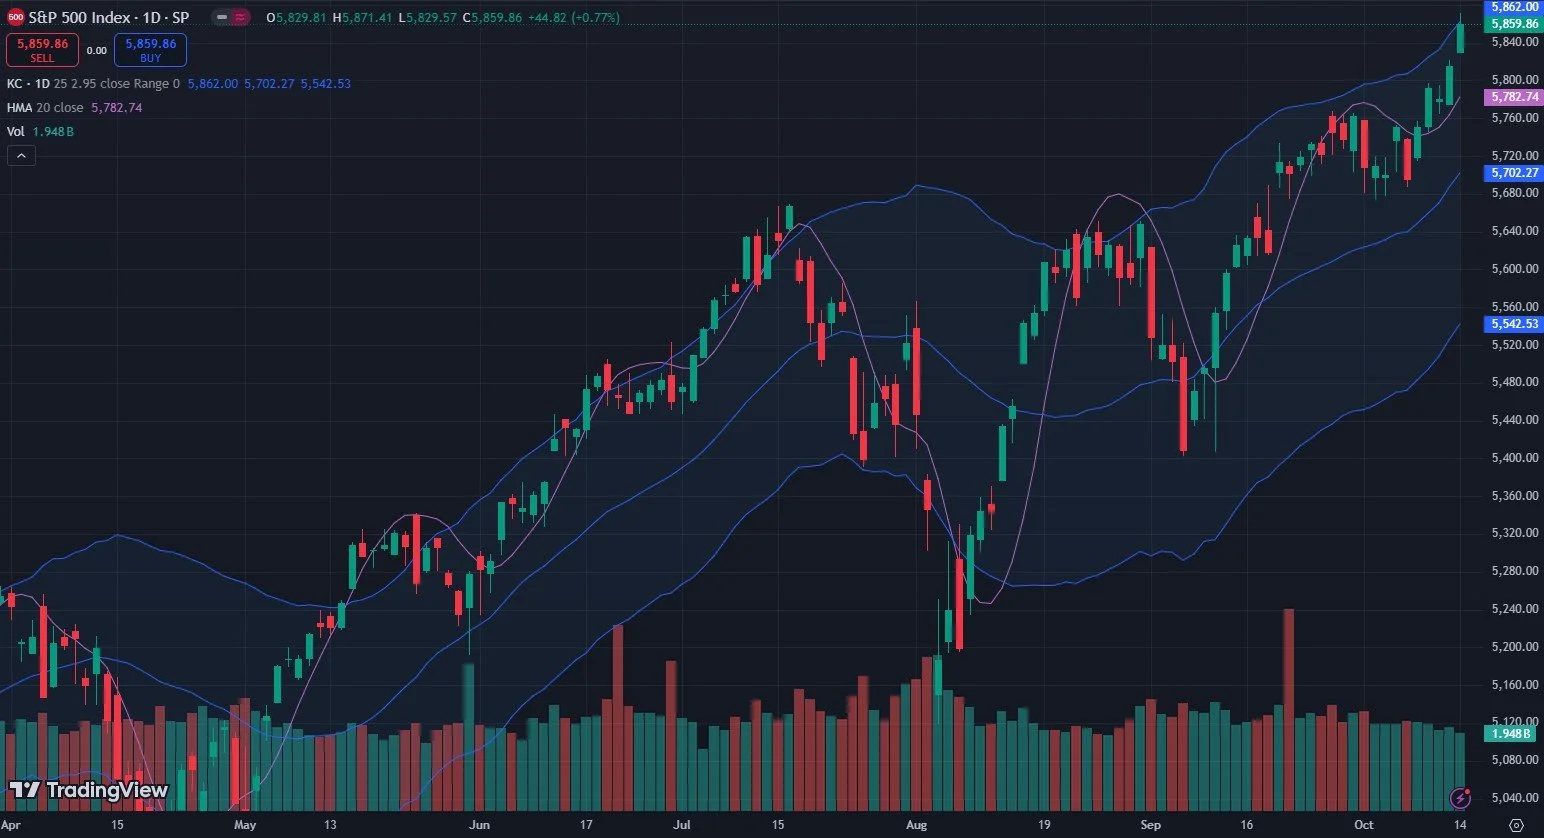
As mentioned above, the upper SPX Dealer Cluster Zone shifted to 5900. This juggernaut might be more like the Hindenburg, but hey, we still have plenty of hydrogen, so give us more altitude, baby! As a sidenote, the Hidenburg was originally designed to use helium, but helium was rare at the time..Sort of like finding any fundamental value as a support for this market.
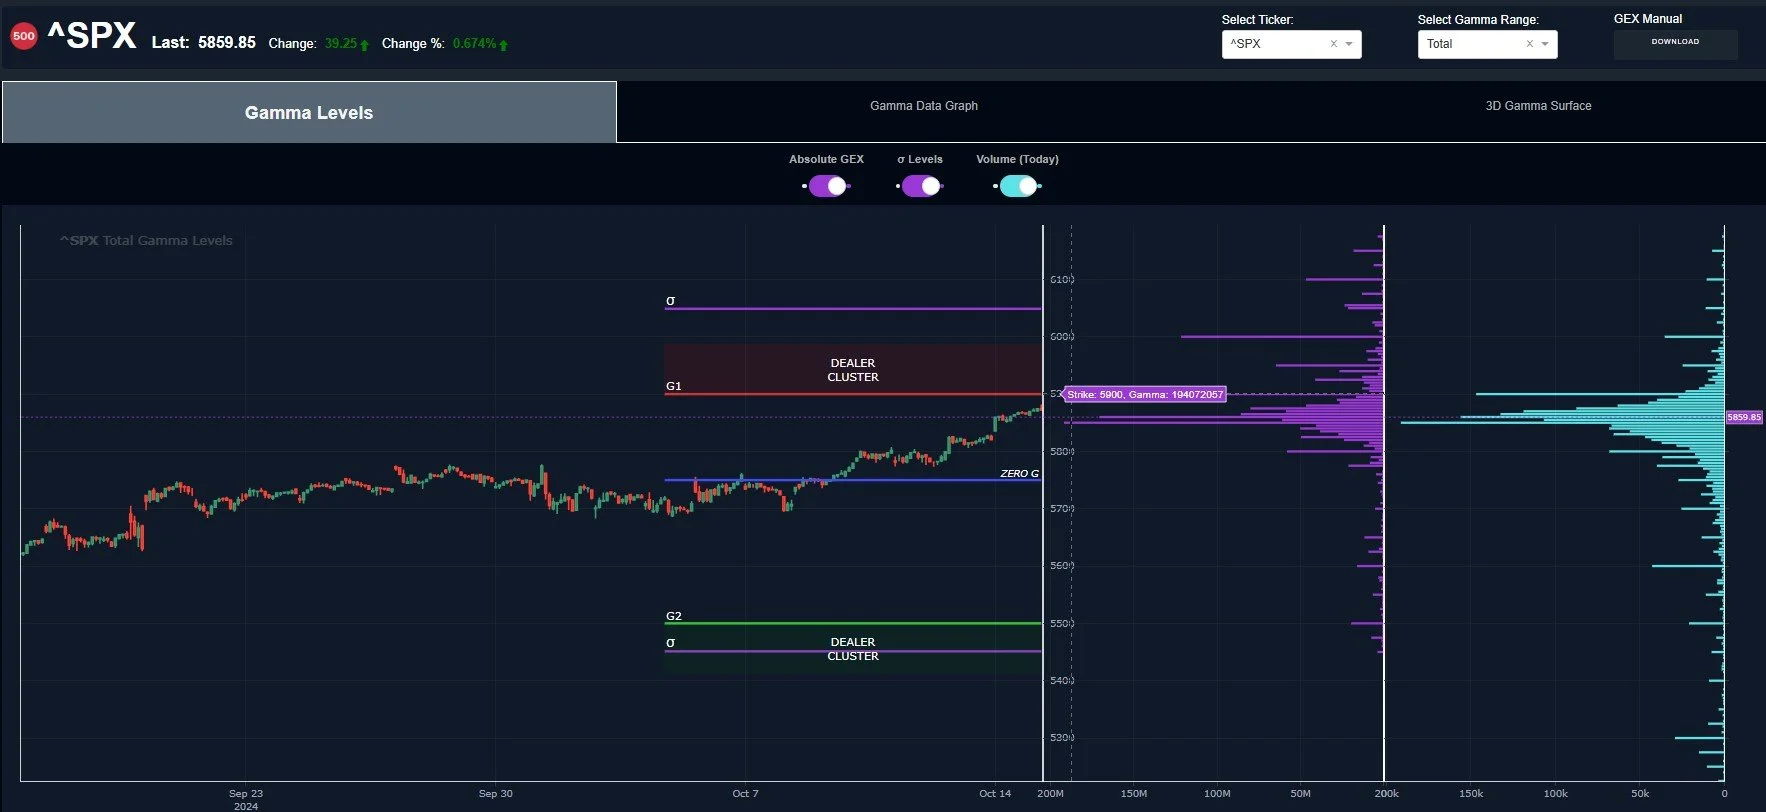
SPX GEX Levels: www.geeksoffinance.com
SPX total GEX is getting closer to the extreme, phoning in an impressive 2B positive. We typically consider over 1B to be solidly bullish, but oftentimes, these extremes end up being better signals of reversals as opposed to continuation higher, something you might have noticed being repeated fairly often as of late in our newsletter.

SPX Historical GEX graph: www.geeksoffinance.com
QQQ keltners also decided to go full parabolic, with 502 now the upper limit. At this point, with the Keltners moving higher and price floating higher, we need a set of solid indicators to go short before attempting to catch the inverted falling knife, which we’ll call the “stranded on the international space station gravity-defying knife,” for lack of a better term.

Removing the 498 0 DTE GEX that expired today, 500 is the clear largest GEX cluster for QQQ. This may shift similar to SPX, but also keep in mind the Dealer Cluster Zone extends above 500 already, so momentum carrying us through 500 doesn’t mean we simply keep going up forever. We can still see a reversal from the general area, as no indicator or market positioning can be taken as an exact target that works 100% of the time.
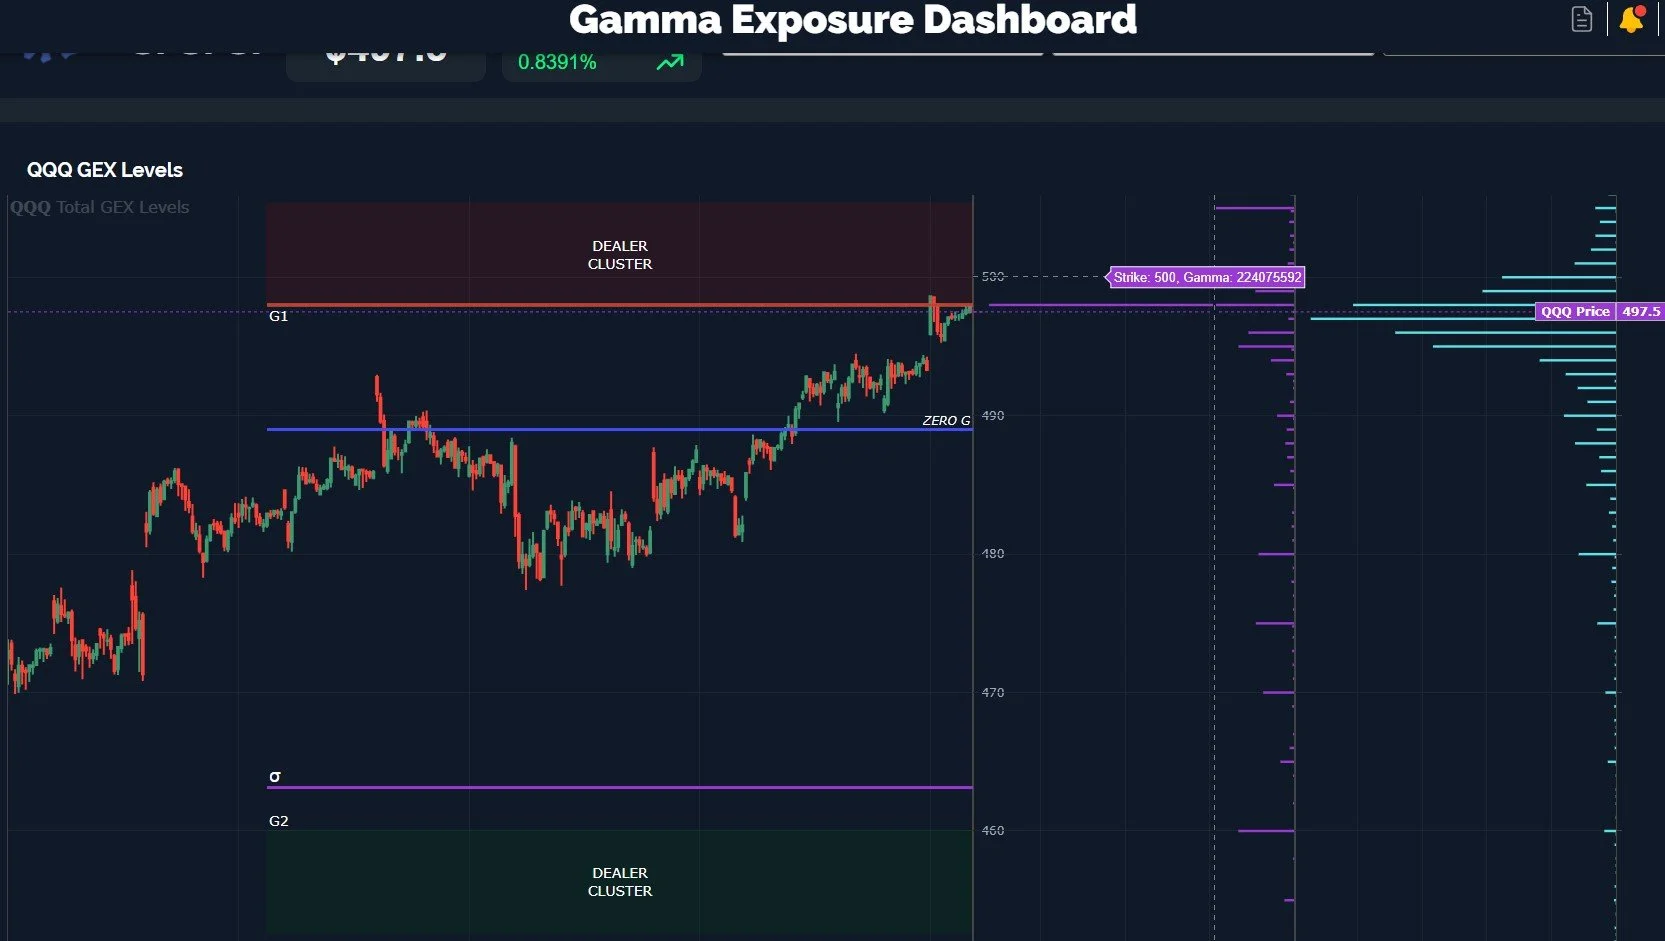
QQQ GEX Levels: www.geeksoffinance.com
Before we wrap up this masterpiece of the worst jokes and misplaced analogies you’ll read all week, perhaps even all year, we’ll delve into one of our YouTube observations, namely GOOG (or take the “L” if you prefer, GOOGL). Looks like a nice inverted head and shoulders, Keltners are starting to point higher, and we are now above the Hull Moving Average.
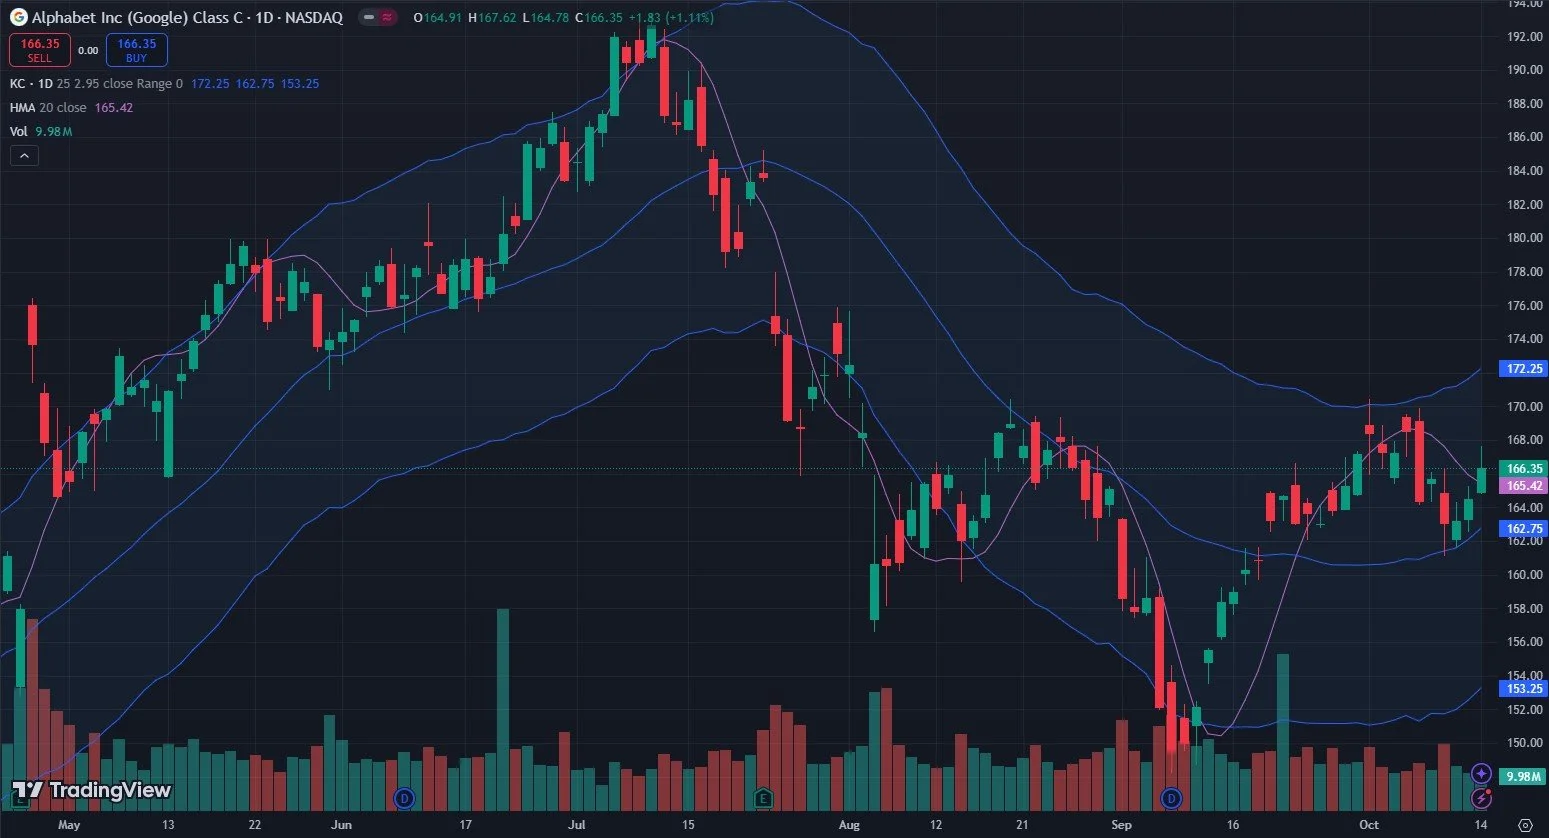
GEX is positive, and we have viable targets between 170-180. Yesterday we mentioned the rotation game played with the biggest indices top holdings, highlighting AAPL and the potential for AAPL to reach 135 (it almost made it to 132 today), so it’s not out of the realm of possibility that GOOG becomes the focus of a GEX squeeze later this week to help propel the markets toward an OpEx high..Or even sooner, if VIX expiration Wednesday ends up becoming the bulls high target instead. Stay tuned for more, and keep this on your radar.

GOOG GEX Levels:www.geeksoffinance.com
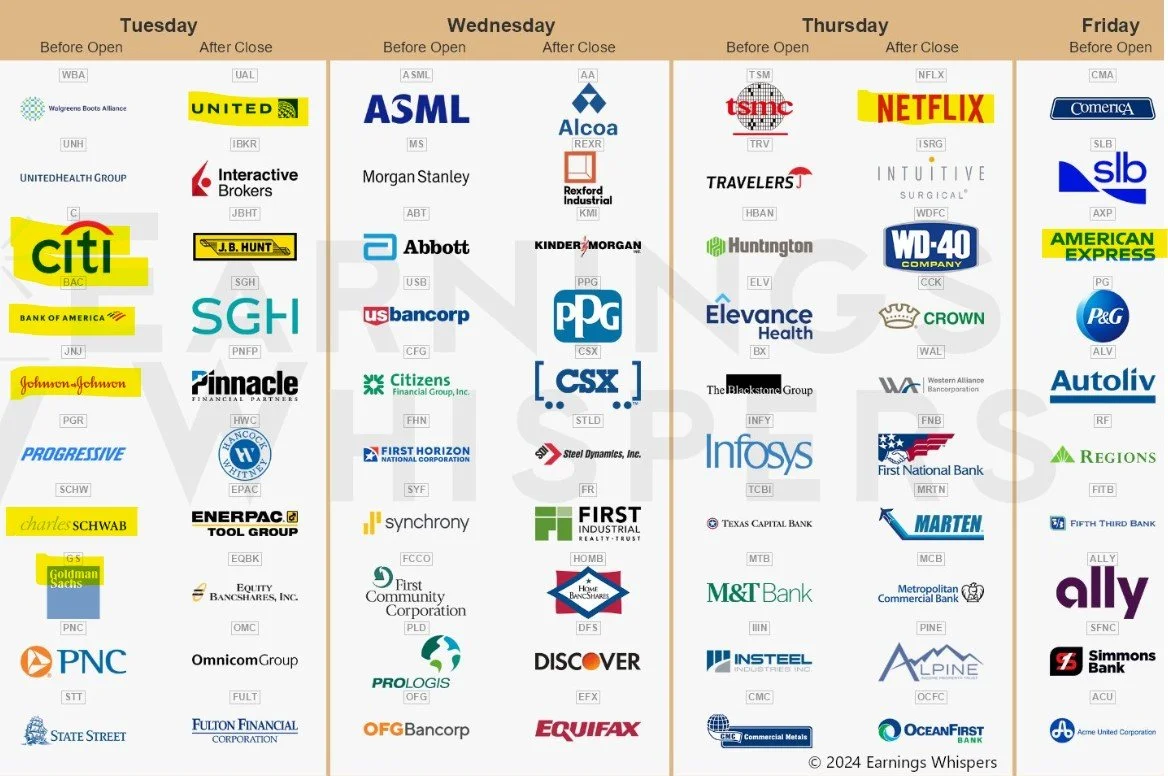
Lastly, we highlighted a few of the upcoming earnings reports that quickly stood out as being important, including GS, C, and BAC tomorrow (and more financials), JNJ, and more as the week goes on, with TSMC and NFLX as the only big tech names that jumps out for this week. We tend to stay away from earnings speculation, but we will still be watching shifts in GEX and opportunities that arise post-earnings for many of these names. We have an interesting week ahead to navigate, and we hope you’ll join us in Discord, where we’ll be alerting our guests and subscribers to any meaningful development we see.
If you’re interested in learning more about our strategy approach, we address all of these topics in our Geek University course which is included in all memberships.
If you’re interested in accessing our tools and analytics, be sure to check out our website!
Thanks for being part of our community and know that we invite your feedback!
We recently posted a YouTube video and we have many short videos for you to review where we cover a variety of predictions and educational topics.
The information provided by Geeks of Finance LLC is for educational purposes only and is not intended to be, nor should be construed as, an offer, recommendation or solicitation to buy or sell any security or instrument or to participate in any transaction or activity. Please view our Investment Adviser Disclaimer and Risk Disclosure.