
Nearing An Inflection Point
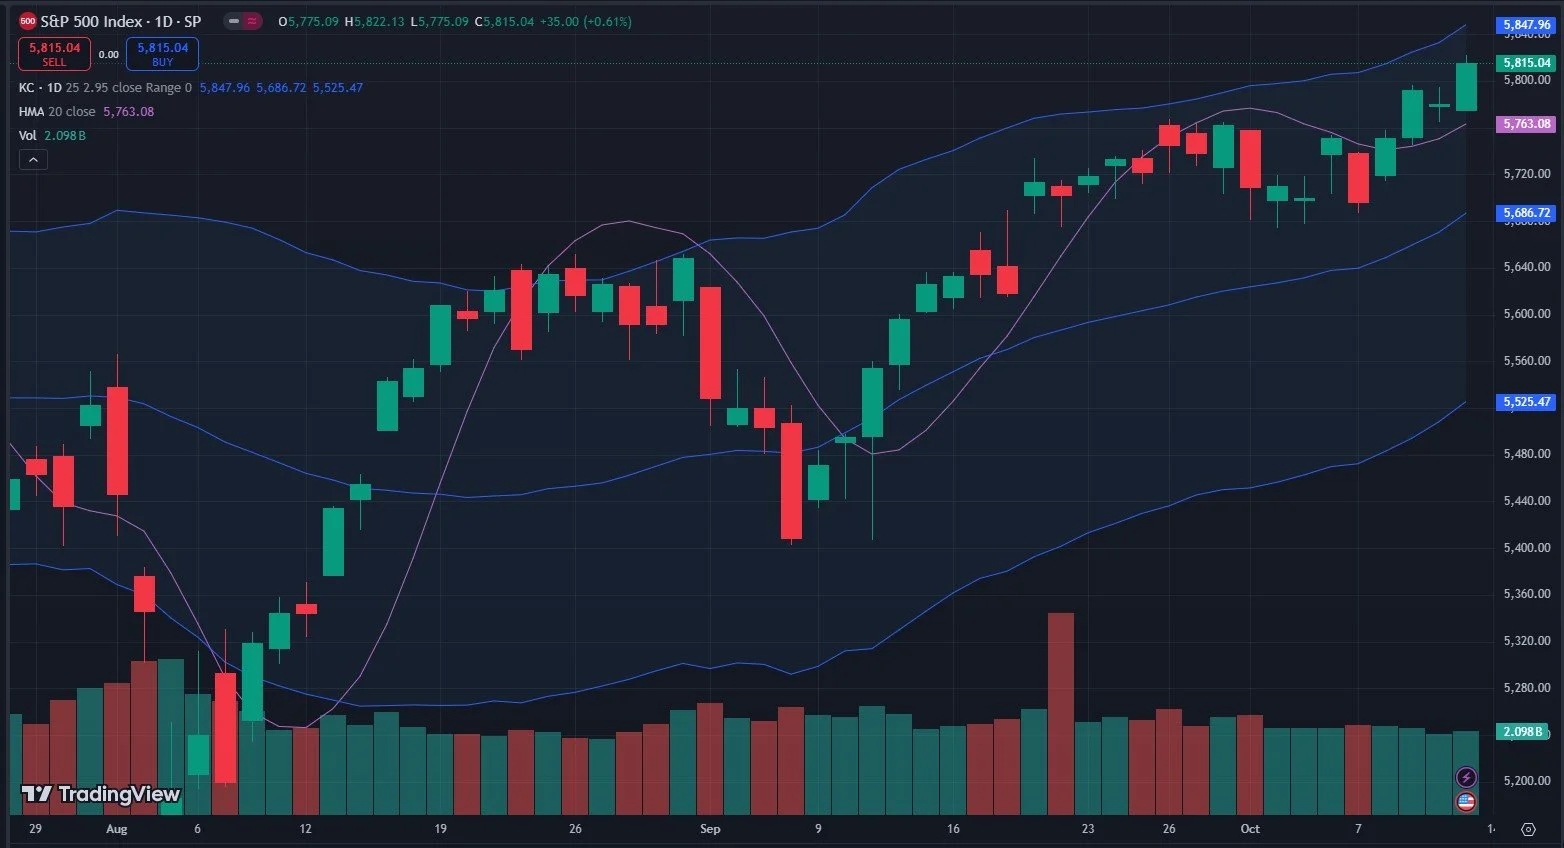
Once we crossed above the Hull Moving Average (and closed above it) on the daily chart last Tuesday, we signaled belief that the market had chosen a direction higher in the short term. This proved correct as the market climbed the rest of the week, making a new all-time high on Friday. Interestingly, the VIX hasn’t dropped much with this move higher, which may be at least partially explained by event hedging as the U.S. Presidential election is right around the corner.
This week may be interesting, as we have monthly VIX options expiring Wednesday and regular market option expiration on Friday. VIX expiration sometimes falls on the week after OpEx, removing any VIX expiration impact from the equation on OpEx week. Could we see a potential market turn before we even get to Friday? It’s at least a possibility, given a few factors we’ll review below.
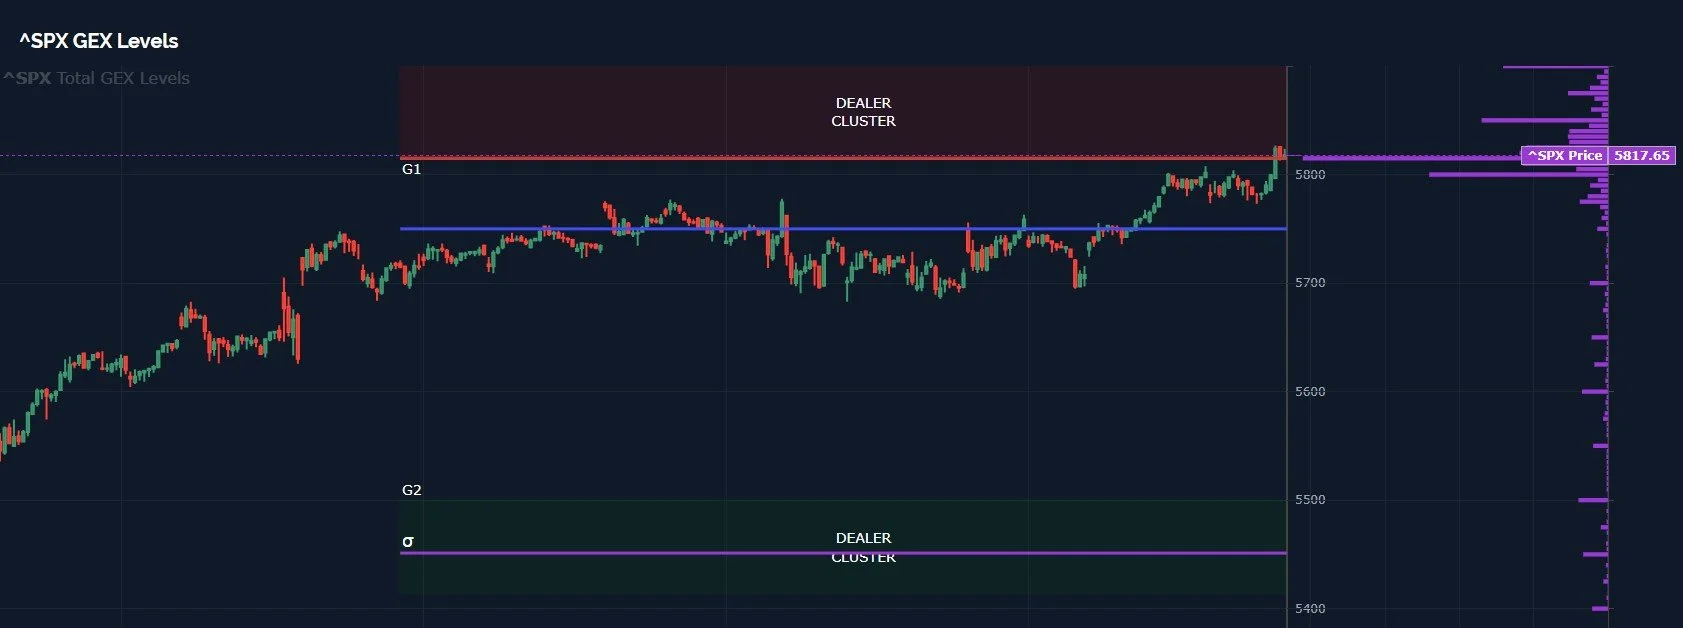
SPX GEX Levels: www.geeksoffinance.com
The chart above shows that SPX is within the upper Dealer Cluster Zone, which does have some room overhead, allowing the market to potentially push even higher, but this area is where we generally expect resistance and potential reversal, based on gamma (GEX) positioning.
The chart below is overlayed with the 3 largest GEX clusters, both positive and negative. With total GEX currently positive, the positive clusters (5850 the only untouched remaining one) are higher probability targets, in our view..At least we believe they’re more likely to be touched before any serious reversal. A reversal can happen for any number of reasons, including positive GEX reaching an extreme, a condition that serves as more of a contrarian signal. We are definitely flirting with levels near prior extremes that marked reversals. Even with 5850 as a likely target, another way to assess risk/reward is to look at what might be gained on the upside versus the downside, which is almost comical, with less than 1% upside and almost 7% downside.
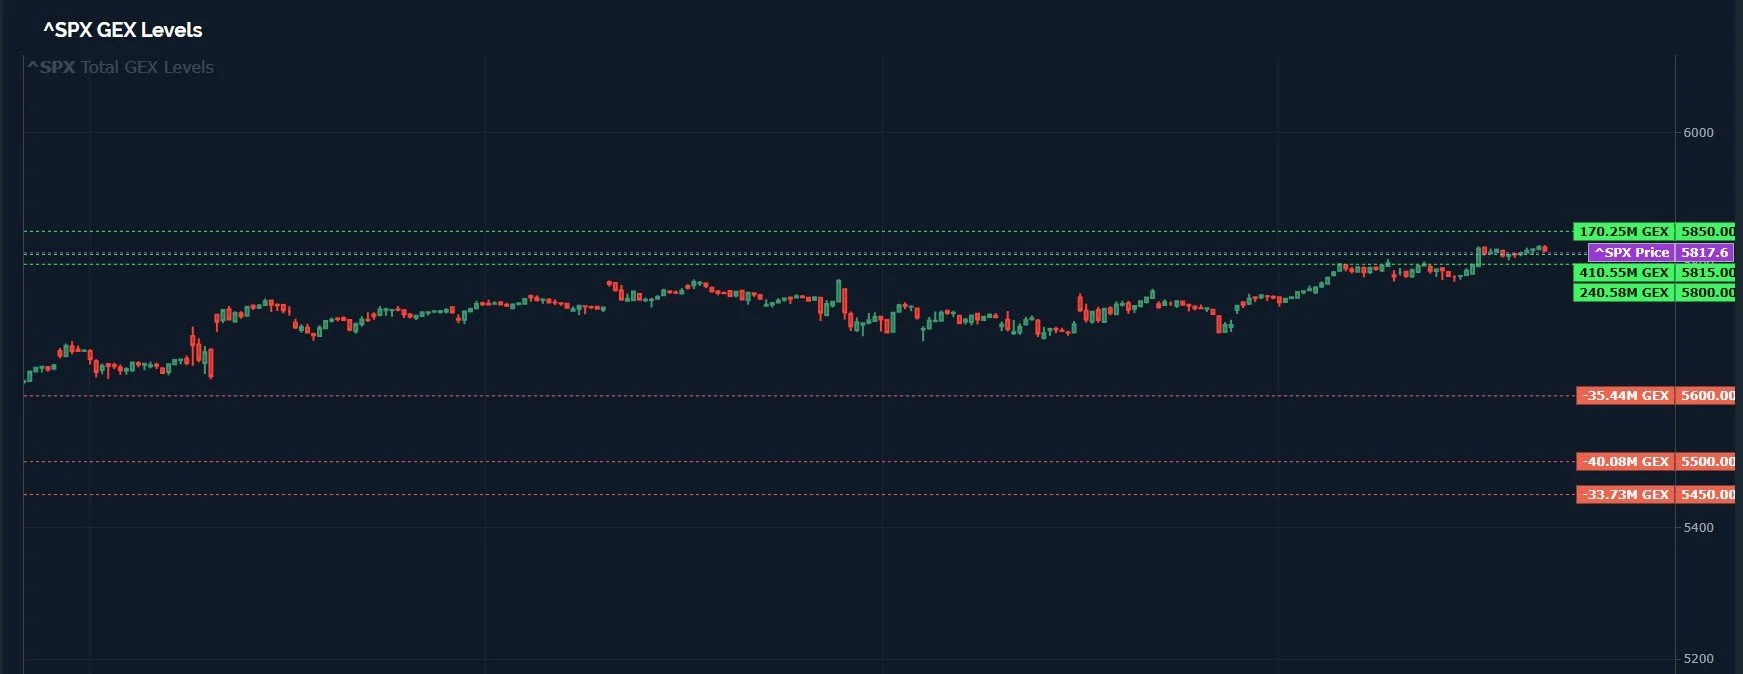
SPX Top 3 GEX Clusters: www.geeksoffinance.com
The Keltner channels seem to agree with GEX data, with approximately 5848 as the top of the daily Keltner channel using my settings. Keltners are pointing sharply higher, a bullish configuration, but we can still look for buyers to become exhausted and a drop to unfold, even if it’s in the context of a continued rally. We do have bearish seasonality leading into the election, but then historically a rally into year-end. I will not be taking any trades based on historical seasonality, but it’s good to know what other traders may be looking at as we consider GEX positioning and other indicators to make decisions. Perhaps the seasonality may sway you if the data appears inconclusive?
We’ll only briefly touch on QQQ in order to point out that it looks very similar to SPX, with 500-501 QQQ as an upside target if this move continues higher before reversing lower.
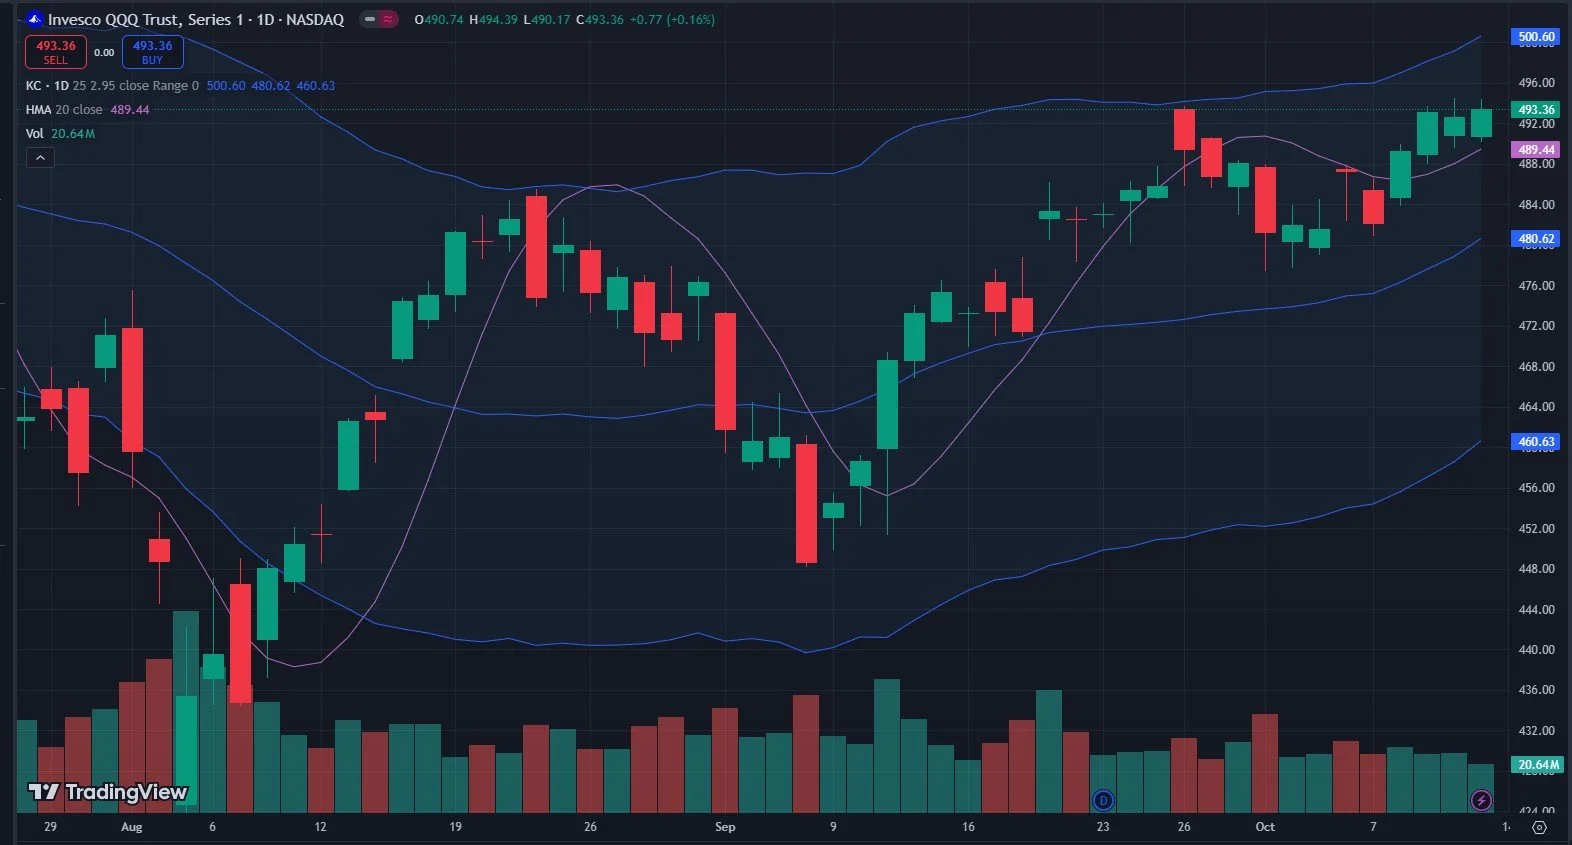
QQQ also saw some volume at the 500 strike Friday, which coincides not just with the Keltners, but with QQQ’s upper Dealer Cluster Zone. So 500 makes sense to us as a magnet before this phase of the rally is done. If you do math, you realize QQQ has slightly better risk/reward (as far as the percentage gain to get to 500) compared to SPX at this stage. But SPX may overshoot to the upside, time will tell.
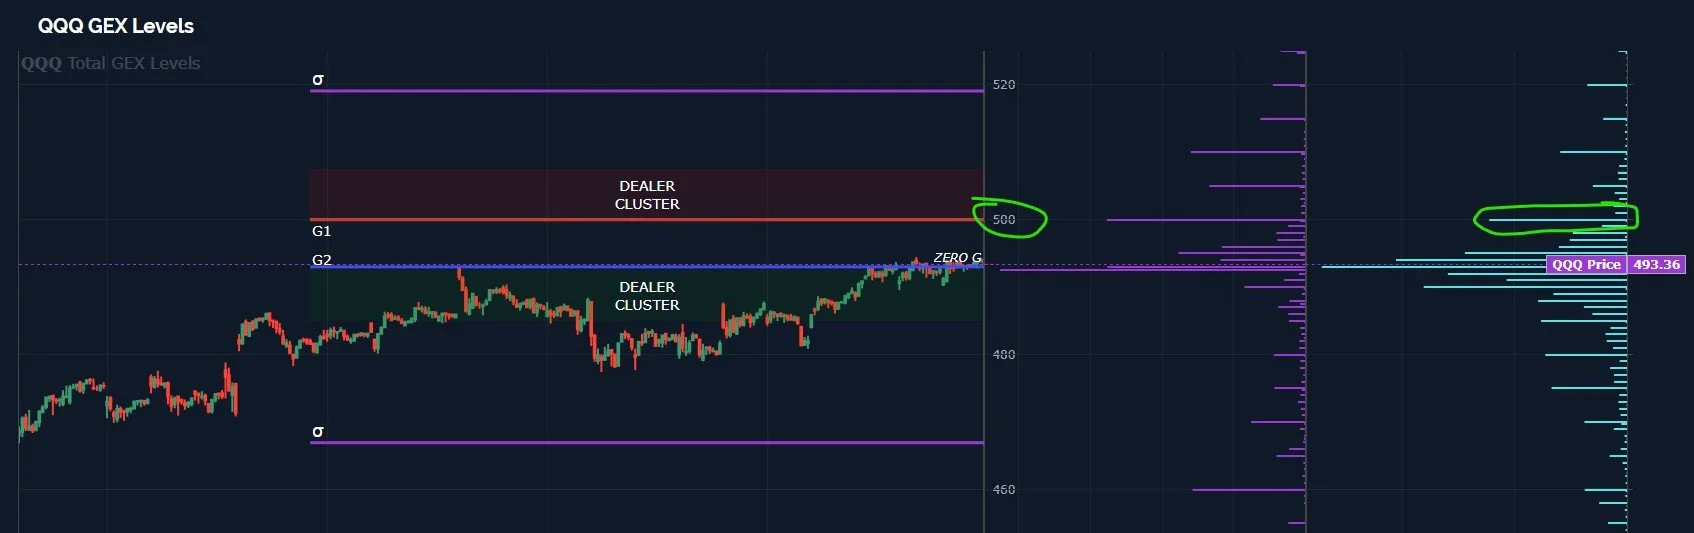
QQQ GEX Levels: www.geeksoffinance.com
While signals from indices can be difficult to interpret sometimes, we can often look to major individual holdings and find opportunities within the index, such as AAPL below. AAPL has been consolidating, dropped Friday, but it remains above the middle Keltner channel as well as the Hull Moving Average.

235-240 look possible for an upside move, and from a GEX perspective, we have positive total GEX, volume Friday at higher strikes, and price consolidating just above the zero GEX level, which checks off a few boxes I like to check off before taking a position. We’ve certainly seen rotation on certain days within SPY and QQQ that has helped offset top holdings that aren’t performing as well, so perhaps this week will be AAPL’s turn to carry the water.
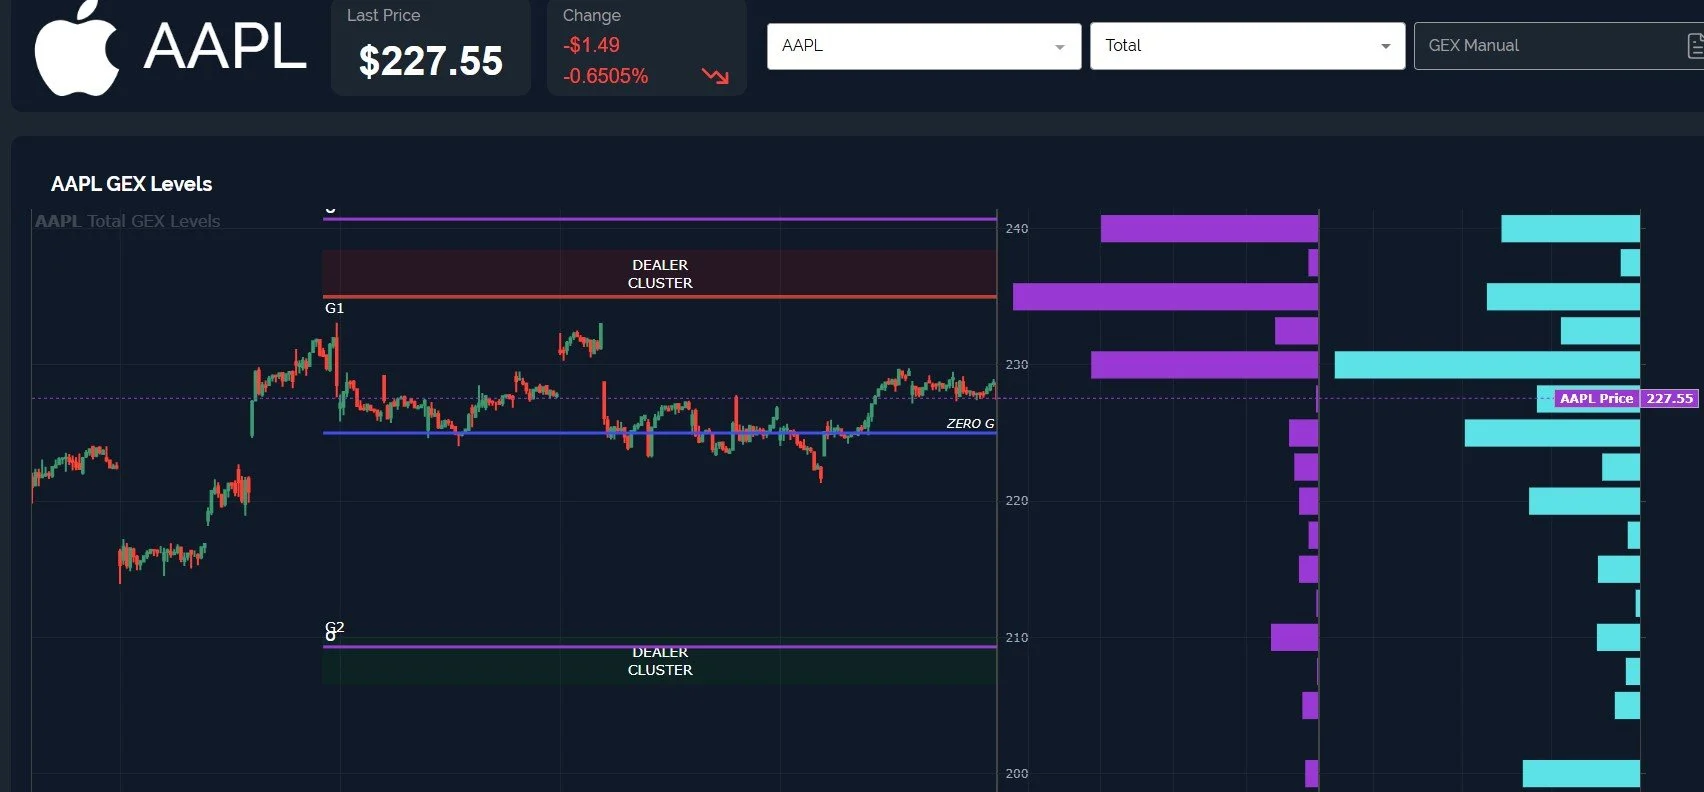
AAPL GEX Levels: www.geeksoffinance.com
Lastly, as we approach VIX expiration Wednesday morning, note that we were looking for a drop in the VIX to 18-19 before another spike higher. The lower Keltner is now at 19.51, so we are still in the ballpark. One noticeable shift I notice on Friday’s GEX Levels chart is that GEX levels all shifted higher, with the Dealer Cluster Zone overhead at 25 now instead of the low 20s, and option volume at 25, far more significant than at most other strikes. This might be explained by election hedging activities, but regardless of the reason, the appearance is that the VIX may have more upside in store before we return to lower VIX levels. We may see Wednesday or Friday as a key pivot as underlying positioning shifts post-expirations.

VIX GEX Levels: www.geeksoffinance.com
We have an interesting week ahead to navigate, and we hope you’ll join us in Discord, where we’ll be alerting our guests and subscribers to any meaningful development we see.
If you’re interested in learning more about our strategy approach, we address all of these topics in our Geek University course which is included in all memberships.
If you’re interested in accessing our tools and analytics, be sure to check out our website!
Thanks for being part of our community and know that we invite your feedback!
We recently posted a YouTube video and we have many short videos for you to review where we cover a variety of predictions and educational topics.
The information provided by Geeks of Finance LLC is for educational purposes only and is not intended to be, nor should be construed as, an offer, recommendation or solicitation to buy or sell any security or instrument or to participate in any transaction or activity. Please view our Investment Adviser Disclaimer and Risk Disclosure.