
Dropping From Resistance
2024 HOLIDAY SUBSCRIPTION SPECIAL- $300 off of the annual Portfolio Manager subscription! We JUST rolled out 500+ new stock and ETF tickers on the dashboard. Check it out for yourself! Enter code HOLIDAYS at checkout! This promo will END soon!
I hate to be a contrarian every day, projecting down after we’re up, and up after we’re down, but you can see that this tendency has actually worked since Friday. I partly attribute this to the “too easy” phenomenon: if something in investing or trading seems too easy, it probably won’t play out that way, or else everyone would end up too rich and lazy (I kind of said the same thing yesterday). Perhaps the same is true of this decline: Are we just going to drop all year long, starting from January? It’s certainly possible, especially in this market of statistically rare events and patterns, but if it seems too easy, count me out. Going back to yesterday’s newsletter, we addressed the possibility of a decline from middle Keltner resistance, and that has become a reality. But we also addressed some bullish factors that may signal upside ahead in context of the big picture. Let’s look at a few factors that reiterate the possibility of a ripper to the upside following the conclusion of the current decline.
We also posted our customary daily YouTube video, which you can access by clicking here. We discuss individual tickers such as PLTR and NVDA as well as SPX and more.
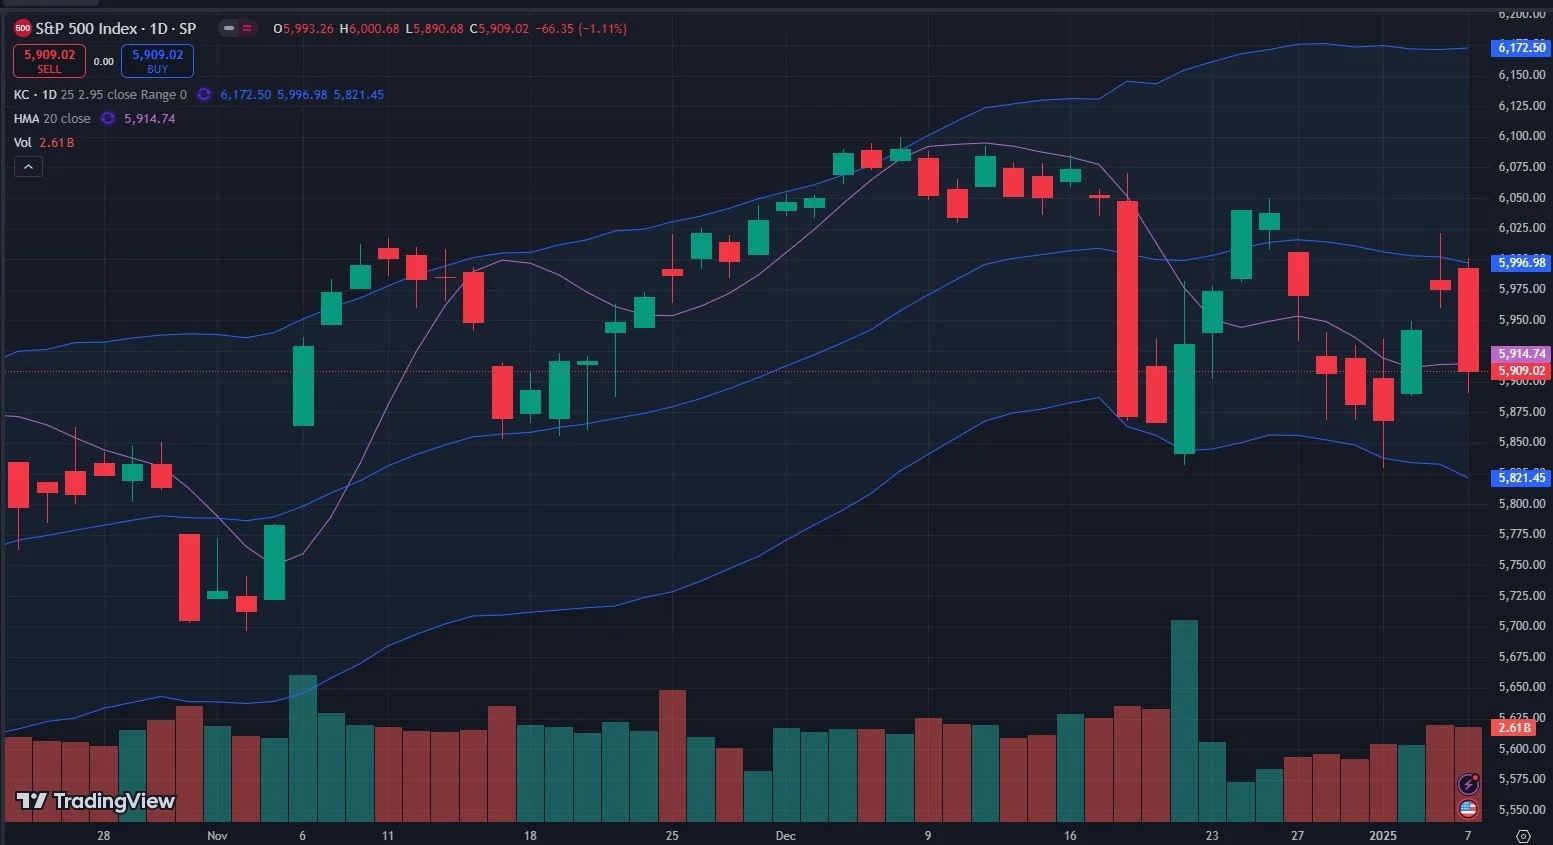
SPX printed one big red candle today, as shown on the TradingView chart above. This move spanned the entirety of the middle Keltner channel and the Hull moving average, closing just below the Hull, but not enough to convince me we’re going to the lower Keltner immediately at 5821. Note that intraday in Discord we highlighted the initial bullish gamma (GEX) reading that pointed to 6005-6010 SPX, which failed, and GEX gave us a timely pivot for the 2nd indication, which was negative with a 5945 target. This change allowed us to alert subscribers as well as our guests in Discord in a timely fashion roughly 25-30 points before the target was hit.
The historical GEX graph below shows a big swing from positive GEX to negative GEX, a huge -1.6B swing, indicative of this fast market we’ve been experiencing especially since the Spring of 2023. While we consider 1B or greater GEX on SPX to be a bullish signal, we note that short term tops have recently been made when we see GEX reach levels between 1B-2B, and we’ve mostly stayed on the right side of the trade by incorporating other indicators and observing recent GEX trends.

We still see the possibility of a larger rally sometime soon, and the GEX Levels chart gives support (no pun intended) to this notion. SPX is almost to the 5800-5900 G2 Dealer Cluster zone, where we expect dealers to potentially become buyers. We also see GEX from 6200-6400 that is worth noting given the growth of GEX at those areas as well as the absolute GEX levels compared to other strikes.
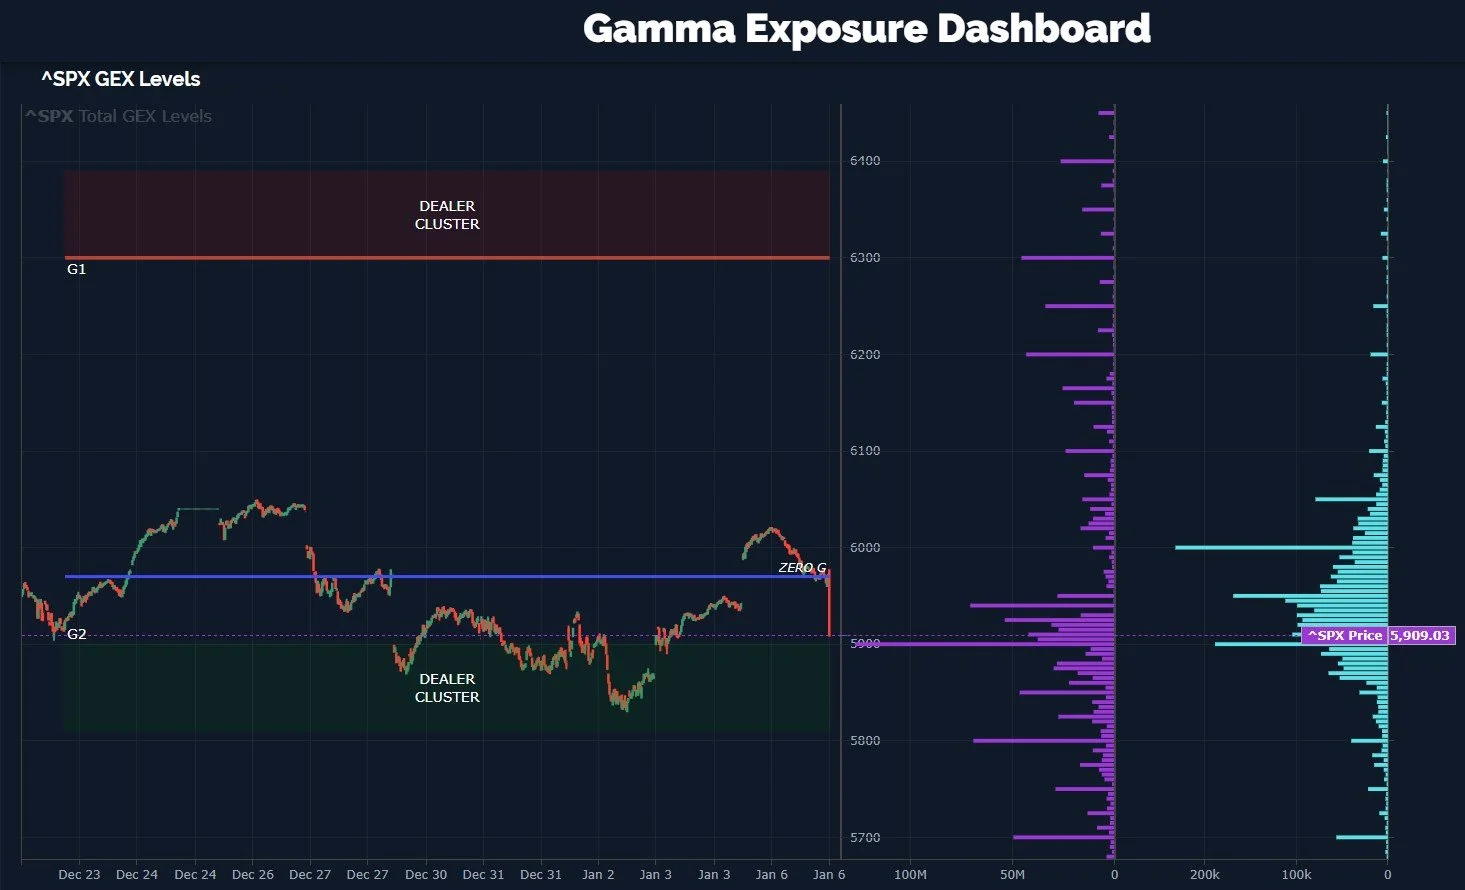
A note of caution is that the VIX still shows 20 to be the upper Dealer Cluster, and we haven’t reached that level just yet, and we also see unusual volume at the 30 strike. So even if we do rebound from this area, the VIX may not be done with its spike, and thus the market may still have some downside to go. It’s not a requirement, but it’s a distinct possibility.

We won’t beat a dead horse by covering DIA completely again tonight, but do note that while DIA was down, it still closed above its Hull moving average, and it dropped by a lower percentage than QQQ or SPX. This is outperformance, though not as starkly contrasting as if DIA was positive and the other indices were down. The big picture chart actually looks bearish to me, with the Keltners in a downtrend and price consolidating sideways while unable to mount any significant rally (yet), but holding around 425 gives DIA a good shot to rebound toward 440 or higher, if GEX indications hold predictive power this round.

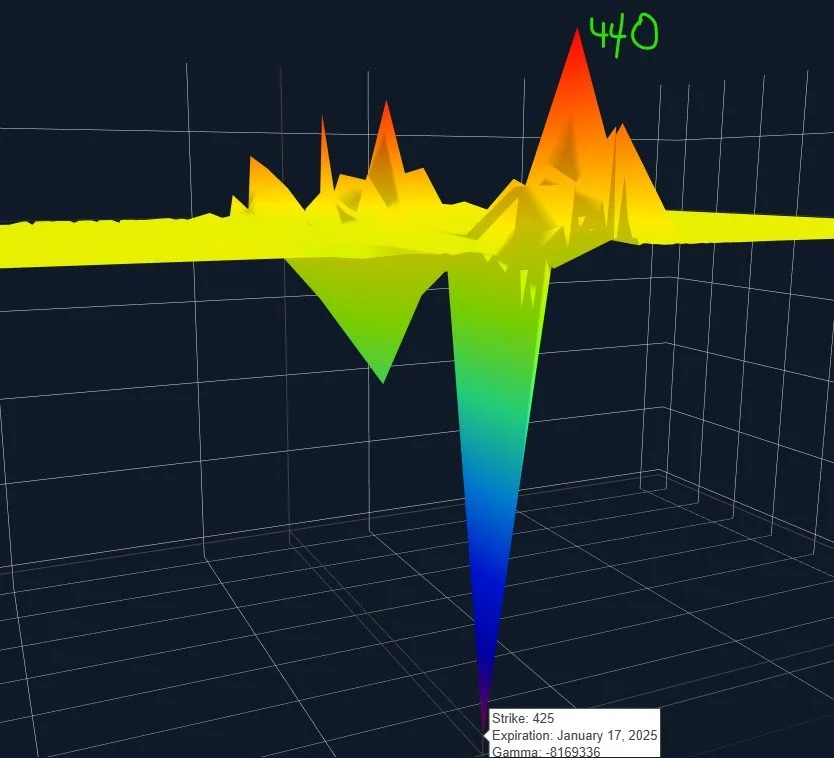
One last comment on DIA- the 3D graph below shows the largest cluster to be a negative GEX cluster at 425, with another meaningful positive GEX cluster at 440, both expiring January 17. Since we’re already basically at 425, without substantially meaningful negative GEX below 425, 440 seems to be the risk/reward favored area at the current moment. If DIA heads toward the 422 lower Keltner channel, we’ll want to revisit the GEX picture to make sure GEX is still supportive of a move higher then, which may be to a lower high than 440 or 450, for example.
Let’s end by looking at MSFT, obviously one of the major holdings in both SPY/SPX and QQQ. MSFT looks bullish based on the proximity to the lower Keltner channel, holding above the Hull moving average, and the upper Keltner not turning down, almost at 460.

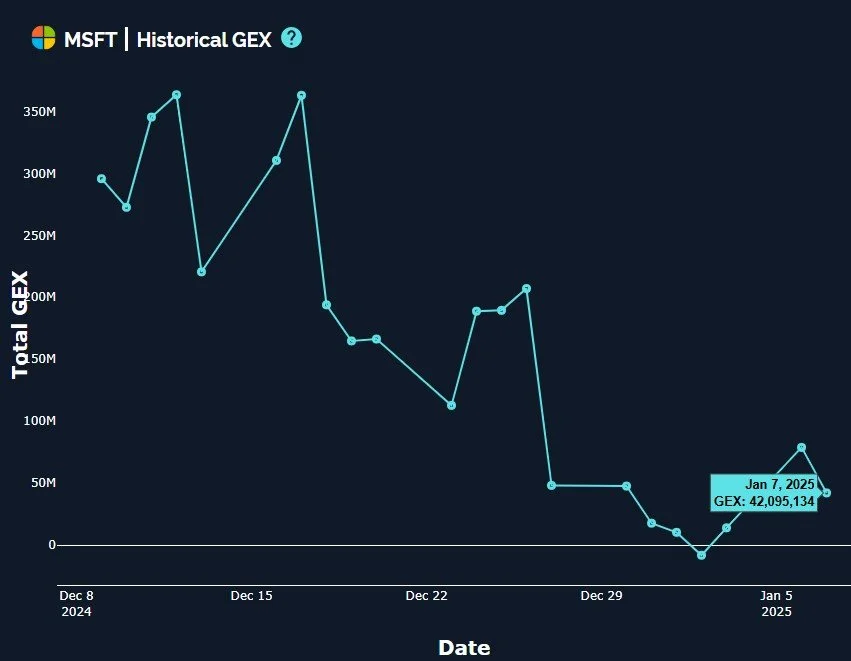
GEX is still positive, despite trending lower as MSFT’s price declined. Based on MSFT’s recent history, the depressed (yet positive) GEX is not a strong indication for lower prices.
GEX Levels do show potential for more downside toward the 410 area, but most of the volume was higher. The upper Dealer Cluster is also relatively far away, presenting an interesting risk/reward opportunity for the speculators amongst us. If MSFT rises, I presume QQQ and SPX will also be inclined to rise or at least show support for the index if other tickers are declining, so MSFT may be an interesting name to keep an eye on.

Join us tomorrow in Discord as we look for good setups intraday and share some market analysis!
If you’re interested in accessing our tools and analytics, be sure to check out our website. We just rolled out 500 new tickers and speed enhancements!
If you’re interested in learning more about our strategy and approach, we address all of these topics in our Geek University course which is included in all memberships.
We recently posted a YouTube video, and we have many other short videos, so give our channel a look if you’re curious about recent market commentary and ideas as well as gamma (GEX) concepts explained.
Thanks for being part of our community and know that we invite your feedback!
The information provided by Geeks of Finance LLC is for educational purposes only and is not intended to be, nor should be construed as, an offer, recommendation or solicitation to buy or sell any security or instrument or to participate in any transaction or activity. Please view our Investment Adviser Disclaimer and Risk Disclosure.