
Approaching A Possible Pivot
2024 HOLIDAY SUBSCRIPTION SPECIAL- $300 off of the annual Portfolio Manager subscription! We JUST rolled out 500+ new stock and ETF tickers on the dashboard. Check it out for yourself! Enter code HOLIDAYS at checkout! This promo will END tonight!
We cover a broad overview of what happened today in our daily YouTube video, which you can access by clicking here. This includes some individual tickers, including META and AIG as well as others. We saw another fairly volatile day, with markets trying to break lower but recovering toward the flatline by day’s end. It’s noteworthy that DIA did outperform other indices, something we’ve been watching as a possibility given the gamma (GEX) picture as well as several contrarian oversold metrics. Will this continue isolated from other indices? Is DIA a signal for what lies ahead for all indices? It’s certainly possible that indices can move in different directions short term, and we’ve seen that in recent past. Perhaps SPX and DIA have enough overlap than DIA and QQQ, though.
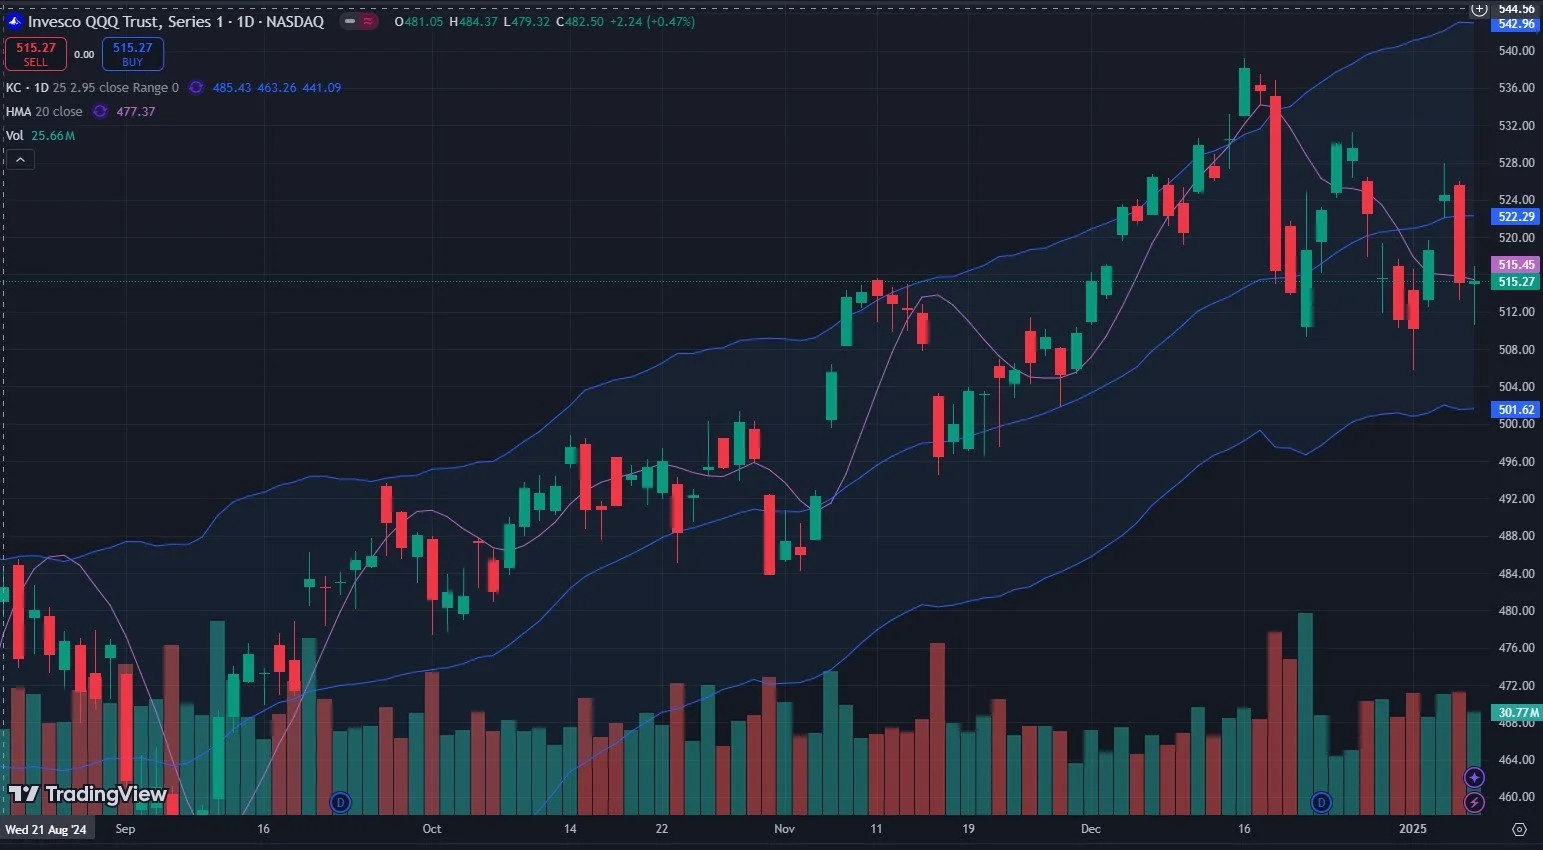
Glancing at QQQ’s chart above, we see a trendline break as well as today marking the 2nd day in a row of closing below the Hull moving average. I don’t consider this outcome to be bullish, strictly according to my own methodology, which counts a daily close below the Hull as a short signal. We’re still really close to the line though, and with OpEx week next week, it’s probably wise to at least consider the possibility of an upside whipsaw.
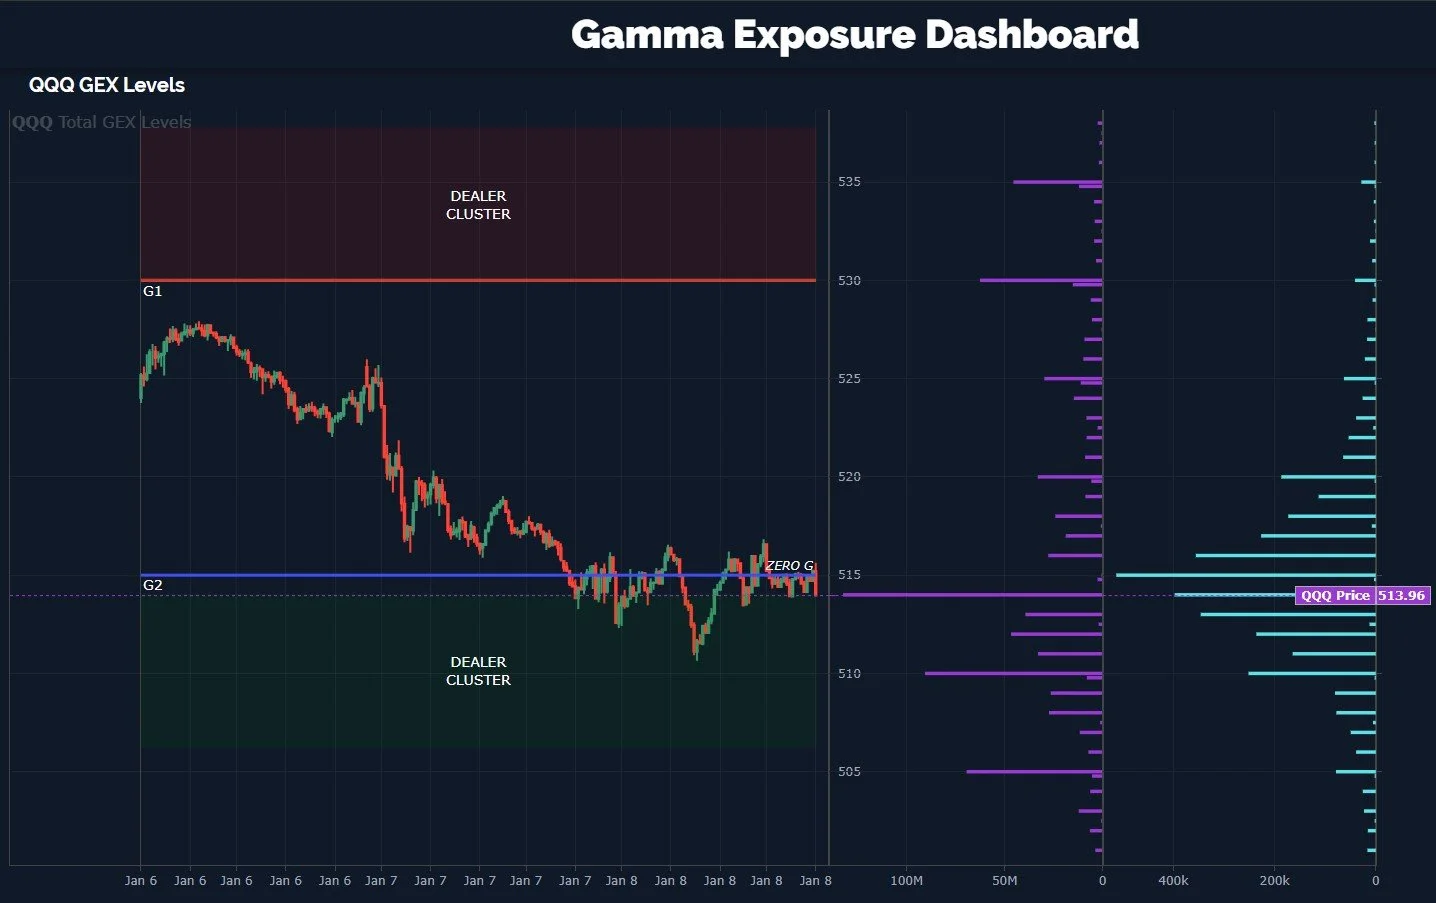
It’s been two weeks or more now that we’ve highlighted 500 as an area of interest for QQQ, which still almost marks the lower Keltner channel on the daily chart (currently just below 502), and we still see a big GEX cluster at 500. It’s certainly possible that we still test that area, and I would actually view that as a potential opportunity for a long trade. What we’d like to see in that scenario is the negative GEX reaching such an extreme to the downside that it represents “peak pessimism.” Our GEX Intensity Gauge compares GEX to GEX readings over the prior 52 weeks, so being at the -3B or greater level of negativity would match the desired criteria. We will definitely want to consider other factors as well, but that’s a big one.

QQQ does show itself to be within a lower G2 Dealer Cluster, but keep in mind this does extend down toward the 505 area, within reach of the 500-502 area that represents the lower Keltner zone. If we see a powerful reversal off of this area, we’ll look toward 530+ as the target, based on current GEX.
The VIX does raise concerns for an immediate bullish turn. With price above the Hull, my bias is long volatility, and the Keltners are angling higher. With GEX showing 20 as the upper Dealer Cluster zone, we may see another mini-spike before vol gets crushed, or perhaps a larger spike beyond 20. VIX spikes are difficult to predict both in terms of timing and intensity, though we have some signals that at least help us to anticipate the correct direction over an intermediate timeframe. Experiencing a VIX spike Friday does not preclude us from seeing an OpEx rally in stocks next week, though we could also see downside accelerate next week for a mid-month low, so we need to keep an open mind. If QQQ is up a lot Friday, I will certainly be cautious next week, similar to last weeks Friday relief rally.

DIA has given us some encouraging signals today, continuing to maintain levels above the Hull while also closing almost .5% higher than yesterday’s close, a feat neither SPX nor QQQ were able to accomplish. I don’t know that we can count on DIA entering a new bull market advance, but we at least appear to be setting up for some sort of relief bounce.

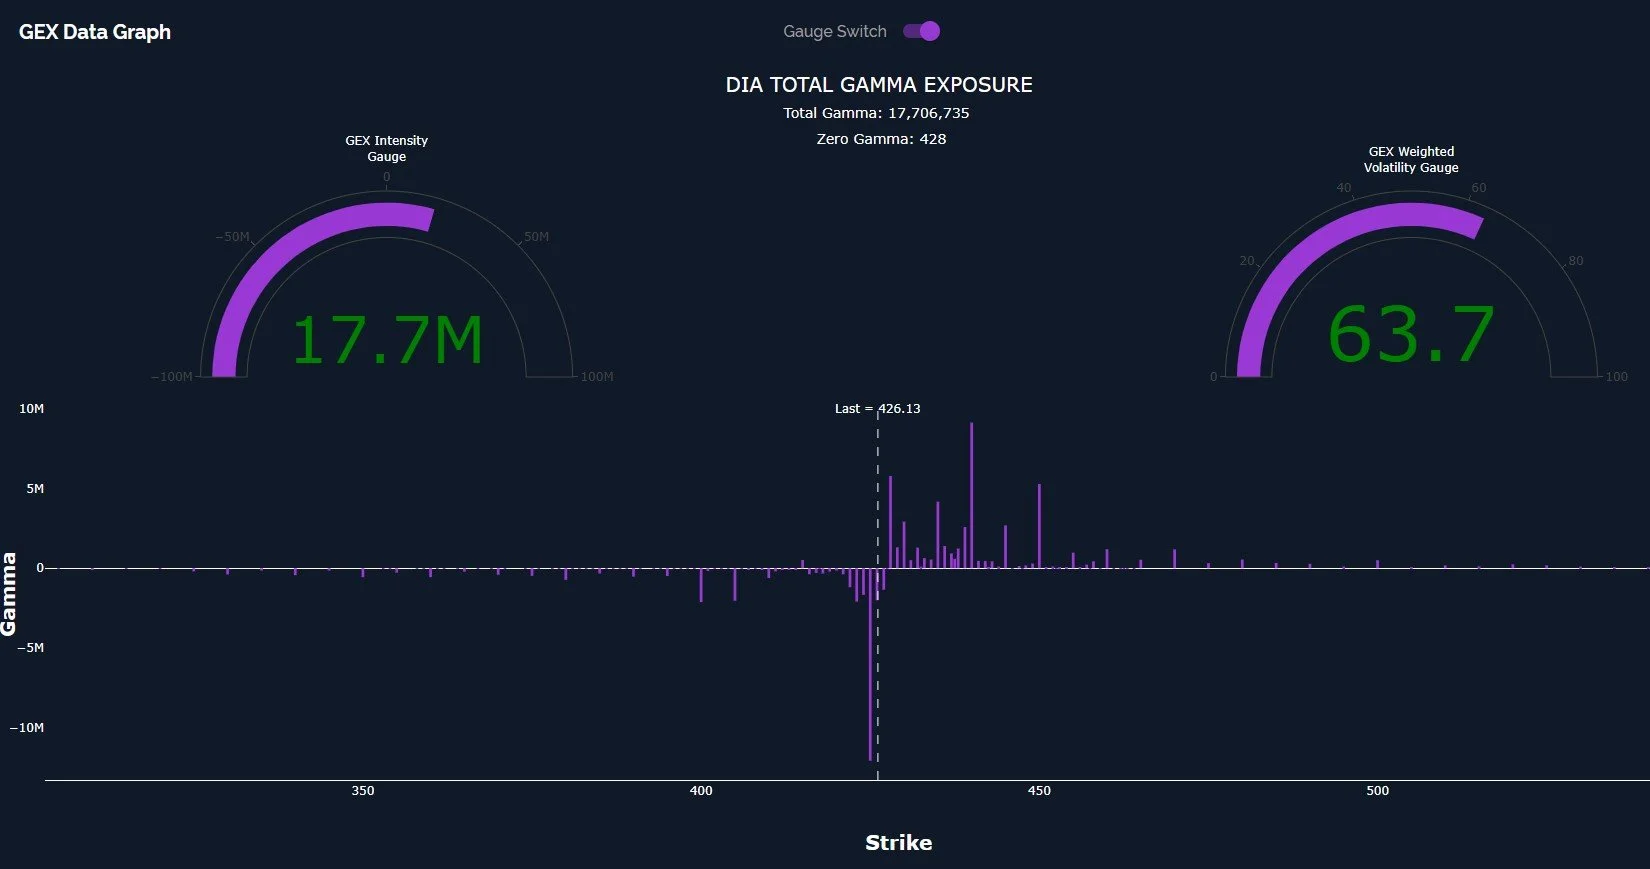
GEX actually increased slightly from yesterday’s reading, maintaining positive GEX, an outlier compared to QQQ and SPX, which show negative total net GEX.

DIA appears to be turning up from the lower Dealer Cluster zone, and volume was elevated at 435. 440 continues to be a major GEX cluster of interest to the upside, and we don’t see much interest in lower prices below 425.

The GEX graph below illustrates the above points differently: GEX is positive, we see a big negative GEX cluster right at 425, but no meaningful downside targets below 425, which is pretty close to where we see DIA now. The upside GEX clusters are obviously more meaningful, though we are still left with uncertainty of timing and whether or not DIA maintains above 425.
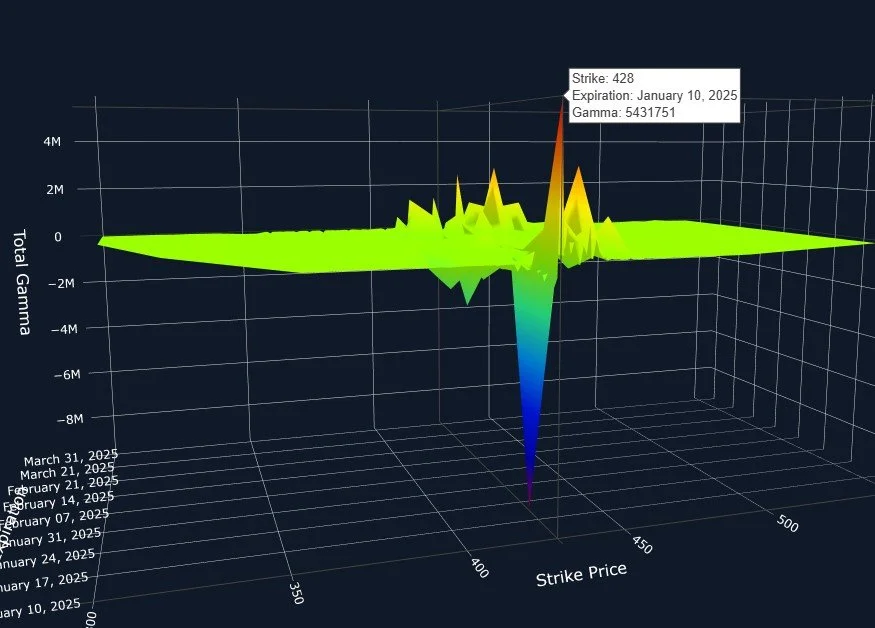
DIA’s 3D graph below shows 428 is Friday’s largest GEX expiry, which is a fairly nice increase from today’s close, if it can happen intraday Friday. The next largest positive cluster is 440 for January 17 and the large negative cluster is 425 for January 17. Where does a large negative cluster near the current price and a large (though lesser in size) positive cluster at 440 tilt risk/reward? I know some of you are very good at math…Even though nothing is guaranteed with trading/investing!
Join us Friday in Discord as we finish out the week strong and look ahead toward the following week. We’ll be sure to share some data regarding updates we see before the weekend!
If you’re interested in accessing our tools and analytics, be sure to check out our website. We just rolled out 500 new tickers and speed enhancements!
If you’re interested in learning more about our strategy and approach, we address all of these topics in our Geek University course which is included in all memberships.
We recently posted a YouTube video, and we have many other short videos, so give our channel a look if you’re curious about recent market commentary and ideas as well as gamma (GEX) concepts explained.
Thanks for being part of our community and know that we invite your feedback!
The information provided by Geeks of Finance LLC is for educational purposes only and is not intended to be, nor should be construed as, an offer, recommendation or solicitation to buy or sell any security or instrument or to participate in any transaction or activity. Please view our Investment Adviser Disclaimer and Risk Disclosure.