


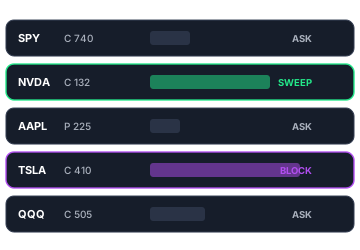
Unusual options activity refers to options trades that look out of character for a given underlying, often signaling that a large, informed buyer or seller has taken a position they expect to pay off soon. Spotting it is a recognition skill: You learn the five signals that distinguish a meaningful print from background noise, you learn the false positives to filter out, and you let a calibrated scan handle the volume once you know what you are looking for.
What "Unusual" Actually Means in Options
Unusual is not a synonym for large. A $2 million trade in SPY weekly calls is not unusual. SPY trades that kind of premium thousands of times a session, and most of it is dealer hedging, ETF rebalancing, or one leg of a multi-leg position someone is using to do something other than make a directional bet. The same $2 million dropped into front-month calls on a midcap that normally clears $300,000 of options notional in an entire day is a different story. The number is the same. The context is what makes the trade visible.
That context is what experienced flow readers spend their morning building. Before they look at a single print, they have a sense of what an underlying's normal options behavior looks like: Typical daily volume, typical open interest at the near strikes, the usual mix of calls to puts, and which expirations actually attract liquidity. Unusual is a violation of that baseline, not a number on a screen. A 500-contract trade on a stock that trades 80 contracts a day is unusual. The same trade on Tesla is a rounding error.
This is also why trying to spot UOA without first learning the underlying concept of What Is Options Flow and Why Do Institutional Traders Watch It? and the field-by-field mechanics of How to Read Options Flow: A Beginner's Guide is hard. The recognition skill assumes you already know what each field on a print line is telling you. What follows builds on that floor, and it is the same recognition logic the GOF Options Flow feed runs against every print in real time. We come back to the tool once the criteria are on the table.
The Five Signals of Unusual Options Activity
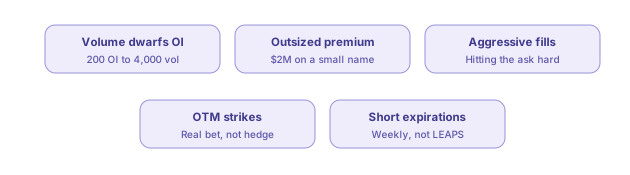
When a print catches an experienced flow reader's eye, it is usually because more than one of these five signals fired at the same time. Any one of them in isolation is suggestive. Two or more is when people lean in.
Volume That Dwarfs Open Interest
Open interest tells you how many contracts already exist at a given strike and expiration. Volume tells you how many traded today. When today's volume at a strike is several multiples of the prior open interest, someone is opening new positions in size, not closing old ones. The clearest version: A strike sits at 200 contracts of open interest at the open, trades 4,000 contracts before lunch, and closes with 4,100 of open interest. That is not rotation. That is a new bet of a specific size, at a specific price, with a specific timeline.
Premium Spend That Is Large Relative to the Underlying's Normal Flow
Dollars committed is the truer measure than contracts. A 5,000-contract trade in a penny call is a coin flip with a low entry price. A 500-contract trade at $4.00 of premium is $200,000 of conviction on a position that has to move meaningfully to break even. When the premium spend on a single name approaches or exceeds the underlying's typical full-day options notional, the trade is doing more than fitting into normal flow. It is the flow.
Aggressive Fills on the Ask, Especially in Size
Buyers who lift the offer in size are telling the market they want the position now, not in the next hour. Sellers do not pay the spread to get short. The pattern that catches attention is a string of buy-side prints at or above the prevailing ask, often crossing multiple market makers within a short window. That behavior is inconsistent with anyone closing a hedge or rolling a position. It is consistent with someone who has a thesis and a clock..
Strike Selection That Is a Real Bet, Not a Hedge
Hedges hug the money. A portfolio manager protecting a long position usually buys puts at strikes near the current price, where the protection actually engages quickly. Directional bets do the opposite. A trader who believes a stock is about to move 15% buys strikes that sit 10% to 12% out of the money, because that is where the leverage on a correct call is highest. When you see size flowing into strikes that have zero intrinsic value today and only pay if the underlying moves, you are looking at conviction, not protection.
Time to Expiration That Signals Urgency
LEAPS positions reflect long horizons. Weekly and two-week expirations reflect the opposite. A trader willing to pay full premium for an option that loses value every day and expires in eight trading sessions has decided something is happening soon. Combine short-dated expirations with the other four signals and the position reads as informed rather than speculative.
Unusual vs. Normal: Two Prints Side by Side
The cleanest way to internalize the five signals is to look at two prints that share surface features and differ underneath.
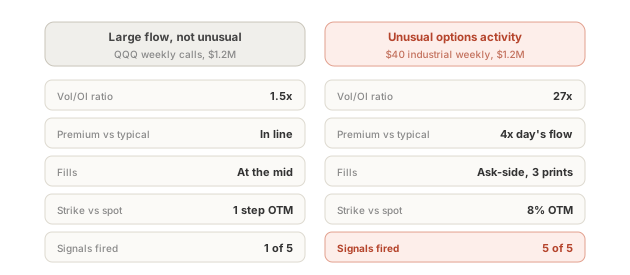
Take a $1.2 million print in weekly calls. On its own, that number is a headline. Look at the underlying. If the ticker is QQQ and the strike is one strike above where QQQ closed yesterday, the trade fits inside QQQ's normal flow profile. Open interest at that strike is already 30,000 contracts. The fills come in measured size at the mid-market. Volume-to-open-interest ratio: About one and a half. The trade is large. It is not unusual. It is more likely to be a portfolio adjustment than a directional bet.
Now take the same $1.2 million in weekly calls on a $40 industrial name that trades 800 contracts on a typical day. The strike is 8% above spot. Prior open interest at that strike is 150 contracts. The fills hit the ask in three separate aggressive prints across five minutes. Volume-to-open-interest ratio: 27x. Same premium. Different reading. Four of the five signals fired, and the fifth (the short expiration) is implicit in the weekly. This is the print that ends up flagged on a flow reader's screen and circled on a Discord post.
The first print is large flow. The second is unusual options activity.
What Looks Unusual but Isn't
The trap most retail readers fall into is treating every large or aggressive print as a signal. The flow feed is full of large prints that look directional and are not. Four common false positives:
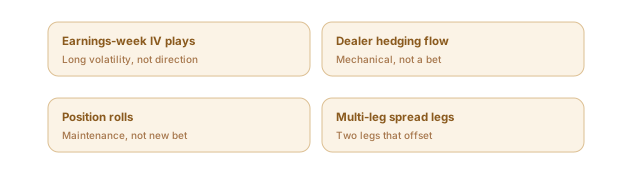
Here are some details on the four primary false positives.
- Earnings-week IV plays. During earnings season, traders take positions in both calls and puts to bet on the size of the move rather than the direction. These show up as large, aggressive prints, often at multiple strikes within seconds of each other. The premium is real. The directional signal is not, because the trader is symmetrically long volatility, not long the stock.
- Dealer hedging flow. Market makers who get filled on one side of a customer order have to hedge that exposure in the open market. The resulting prints are mechanical. They are large because the original customer trade was large, but they carry no information about anyone's directional view. They are the consequence of someone else's bet, not a bet themselves.
- Rolls of existing positions. A trader closing a near-expiration position and reopening it further out shows up as two large prints, often close in time. From a single-print view, the new position looks like a fresh, aggressive bet. In context, it is a maintenance trade by someone who already had conviction and is simply extending the timeline.
- Multi-leg spread components. A trader selling a call spread or buying a put spread executes two legs that, viewed individually, look like an outright bet. The legs offset. Treating either one as a directional signal misreads the position entirely. The defenses are matching contra-flow at a nearby strike and trade size that matches across both legs.
The deeper skill of separating meaningful flow from background hedging and earnings-season noise belongs to its own piece. What matters here is the recognition layer: A print that survives all four false-positive filters and still hits the five signals is what flow readers actually mean when they say unusual.
Why Retail Investors Care About UOA
When a large, informed trader bets aggressively on a specific direction within a specific time window, that conviction is data. It is not a guarantee. Any single UOA print is wrong some of the time, sometimes badly wrong, and the trader who placed it may be operating on information you do not have access to, may be running a sector pair trade where one leg looks like a standalone bet, or may simply be making a different read of the market than you would. None of that erases the value of seeing the position taken.
The more useful frame is aggregation. When dozens of unusual prints across an index or sector point in the same direction over a few sessions, the signal becomes positioning data: A window into how the largest players are leaning, and how that leaning is changing. That is the information retail traders could not see before institutional flow tools became publicly available.
Where GOF Surfaces Unusual Options Activity
The five signals are easier to act on when something runs the scan for you. The Options Flow Tool applies the recognition logic to every print that crosses its feed in real time, flags the prints that hit multiple signals at once, and shows the fields that drove the flag. A flagged row will display volume against open interest, the premium committed in dollars, the fill side, the distance of the strike from spot, and the time to expiration, with each field marked when it crosses the threshold the algorithm uses for that specific underlying.
The threshold is the part that matters. A 1,000-contract trade is not unusual on AAPL and very unusual on a $40 industrial name that trades 800 contracts a day. A static "flag if volume exceeds 1,000 contracts" filter misses both ends. The GOF tool calibrates its thresholds to each underlying's own historical baseline, which is the same approach experienced flow readers do in their heads. You see a flagged print and you already know it is unusual relative to that specific stock, not relative to an arbitrary number.
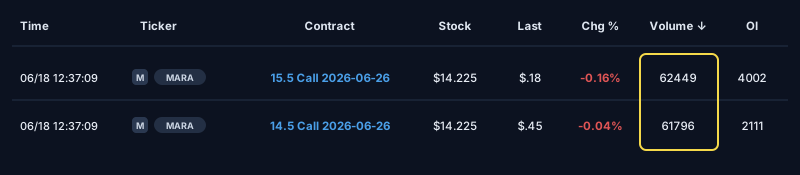
Below is an example from the GOF Options Flow tool. On Friday 6/18 MARA saw unusual volume in 2 specific contracts:
- 61,796 contracts were traded in the 6/26 MARA 14.5 calls, with open interest of only 2,111 contracts - a Vol/OI ratio of 29.27X
- 62,449 contracts were traded in the 6/26 MARA 15.5 calls, with an open interest of only 4,002 contracts - a Vol/OI ratio of 15.6X.
Drilling down further, we can identify this as a large call credit spread position, meaning the trader was looking to collect premium (likely due to elevated IV) with a view that price would remain below $14.5 through the following week. Our “Bullish/Bearish” indicator showed the $14.5 calls were aggressively sold while the $15.5 calls were aggressively bought.
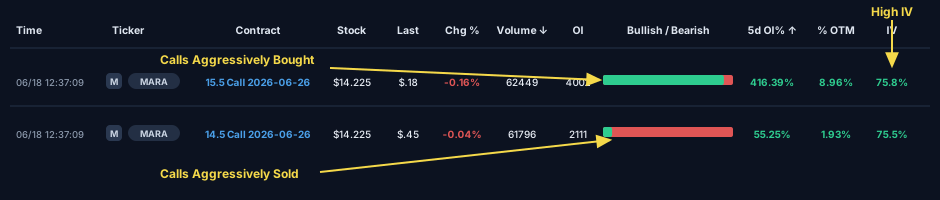
With this information we are able to identify a specific position taken in MARA, the fact that it is indeed “UOA” and not normal flow, as well as the trader’s directional view and IV strategy. That type of analysis has the potential to transform an average trading style into a powerful, repeatable institutional-level strategy.
What to Do Next
Recognition is the first half of the skill. Deciding what to do with a flagged print, whether to follow it, fade it, or set it aside as ambiguous, is its own discipline that the rest of the GOF Options Flow library covers. The highest-value next step right now is putting the five signals on a live feed. The GOF Options Flow tool runs the scan in real time across the names that are actually moving today, and seeing the flags fire on real prints is the fastest way to calibrate the recognition you have just learned.