


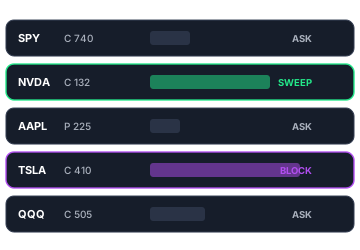
Reading options flow boils down to parsing one row at a time in a live feed of executed options trades. Focus on six fields: Ticker, contract type, strike, expiration, size, and whether the trade hit the bid or the ask. At GOF, we view a fill at the ask as potentially aggressive buying. A fill at the bid suggests aggressive selling. Geeks of Finance gives traders access to proprietary options flow tools that displays aggregate flow in a way not seen on other sites, just in case you don’t quite feel like you’re ever going to read shifting numbers on the screen like Neo in The Matrix.
Before You Start: What This Guide Assumes
This piece is for someone who already knows what options flow is and wants the next step: How to actually read it. If that prerequisite is shaky, start with What Is Options Flow and Why Do Institutional Traders Watch It?. That piece covers the why. This one covers the how.
The how is mechanical. You are looking at a screen with rows of executed options trades and trying to extract meaning from them in real time. The skill is not memorizing every field. The skill is knowing which fields matter, which ones lie, and which combinations are worth a second look.
The fields and patterns we look for at GOF live in every serious option flow feed. The conventions are not unique to any one product. That said, we built the GOF Options Flow feed to surface these signals in the cleanest way we could, and the examples we walk through here come from how the data appears in our feed. Our members’ feedback has been overwhelmingly positive, especially from those who are able to compare to what they once had on another platform.
The Anatomy of a Single Print
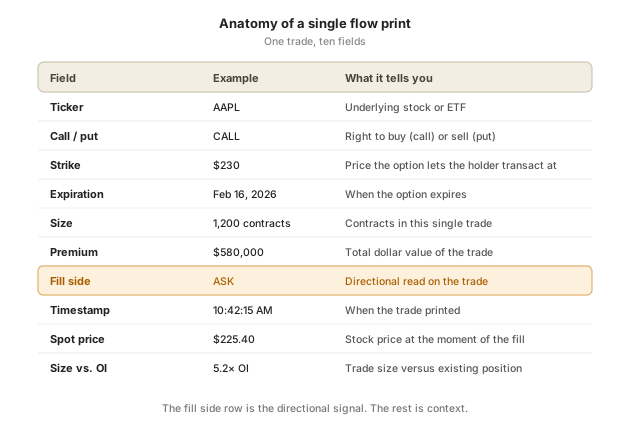
A single option flow print is a record of one trade. Before you can read a feed, you need to be able to read one row. Here are the ten primary fields you will see, in roughly the order they are likely to appear:
- Ticker. The underlying stock or ETF.
- Call or put. Calls give the buyer the right to buy at the strike. Puts give the buyer the right to sell. Familiar territory if you have worked through Options Trading for Beginners: Complete Guide.
- Strike price. The price the option lets the holder transact at. A $200 call on a $150 stock is a very different bet than a $155 call on the same stock.
- Expiration date. When the option ceases to exist. Whether the option has value or not at expiration depends on where the stock price is relative to the strike price.
- Size. The number of contracts that filled as bought or sold in this single trade. One contract represents 100 shares of the underlying.
- Premium. The total dollar value of the trade (size × price per contract × 100). Anchor on this number. A 500-contract trade can cost less capital than a 200-contract trade if the option price is low.
- Fill side. Whether the trade filled at the bid, at the ask, or somewhere in between. This is the most important field for inferring direction, and it gets its own section below.
- Timestamp. When the trade printed. Useful for spotting clusters of activity within a tight window, which often signal coordinated buying.
- Spot price. The price of the underlying stock at the moment the trade filled. You cannot tell what a strike means without context of knowing where the stock is.
Bid vs. Ask: The Single Most Important Signal
Every options contract has two prices at any moment. The bid is what a buyer is willing to pay. The ask is what a seller is asking. The gap between them is the spread.
When a trade prints at the ask, it almost always means a buyer was aggressive enough to cross the spread and take the offered price. They did not want to wait. When a trade prints at the bid, the opposite is true. A seller crossed the spread to dump the contracts at the bid price. They did not want to wait either.
This single piece of information tells you something the rest of the data cannot. Size tells you how big. Strike and expiration tell you what they are betting. The fill side tells you who was in a hurry, and which side they were on.
A trade at the mid is harder to read. It often signals a negotiated trade between two large parties, an algorithmic order that split the spread, or a multi-leg strategy. Mid-fills are not useless, but they do not telegraph direction the way ask-side and bid-side fills do.
The four cases stack like this.
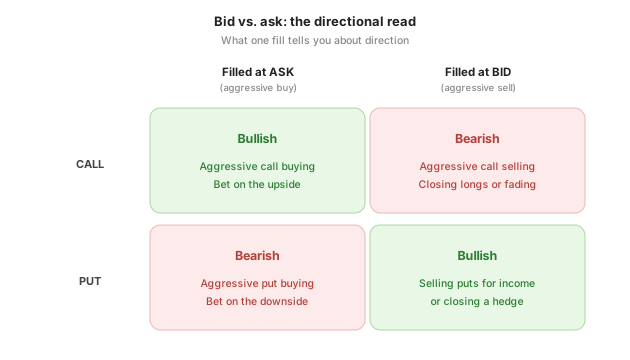
Memorize the four cases and the rest of flow reading gets faster. Beginners often get tripped up by the put-side reads. A put bought aggressively at the ask is bearish, not bullish. A put sold at the bid is bullish, not bearish. The position the trader is taking and the direction they are betting are not always the same thing.
Wal-Mart (WMT) is a great recent example of flow in action: The stock gapped down after earnings, and Gamma Exposure (GEX) flipped negative. Option volume at the 110 and 115 strikes was high on both May 21 and May 22, with an accompanying large increase in open interest at the 110 strike over the previouspast 5 days. Even after the gap down, WMT moved from a high of over 125 to just under 11914 by 6/1Friday, a nice move after noticing the large put flow activityactivity at the 110-115 strikes., particularly in the August expiration.
What Counts as Significant Size
There is no universal answer to the question of how big is big. A million-dollar premium trade in Apple is barely a blip. A million-dollar trade in a $40 mid-cap is a major event. Context is the whole game.
Three tests, in order of usefulness.
- Size versus open interest. This is the cleanest test. If the contract being traded has an open interest of 300, a 1,500-contract trade is a five-times increase in the position. Someone is taking a real stand. If the open interest is 50,000, a 1,500-contract trade is rounding error. Compare every interesting print to the open interest on that contract before you get excited. For a quick reminder of what open interest is, see Open Interest: Definition.
- Size versus average daily volume. Average daily volume tells you how busy the ticker normally is. A $750,000 premium trade in a name that averages $200 million in options volume per day is barely worth noticing. The same trade in a name that averages $3 million per day is the story of the day. What Is Open Interest and Volume Telling You? A Combined Reading goes deeper on how to use both numbers together.
- Total premium paid. The dollar weight of the trade. Premium is the cleanest single-number test once you have the other context. Most professional flow readers anchor on premium first and only zoom in on the trades that clear a threshold. Common starting points: $100,000 for an interesting print, $500,000 for a serious one, $1 million-plus for a print that should make you stop scrolling.
The order matters. Premium alone, without context, will mislead you. A $2 million trade in SPY weekly options is routine flow that retail traders chase every day. A $200,000 trade in a small-cap biotech the week before an FDA decision is a different kind of signal entirely.
Patterns Worth Noticing Once You Can Read a Single Print
A single print is a starting point. The real signal in options flow comes from patterns of prints that share a thread. Three are worth learning first.
Stacked prints at the same strike. When you see ten, twenty, fifty trades hitting the same call or put strike over a few minutes or a few hours, someone is building a position. It does not always work. The buyer could be wrong. But the act of building a large position is a real-world commitment of capital, and that commitment usually rests on a thesis worth a second look.
Sweeps. A sweep is a single order that takes liquidity from multiple exchanges at once. Instead of waiting for one venue to fill the order, the trader pays up to clear inventory across every venue at the same time. Sweeps signal urgency. They are often, though not always, institutional. The full distinction between sweeps and split orders is its own topic, covered in Sweep vs. Split Orders: What the Difference Tells You.
Repeated flow across days. A single big print is a thesis. The same kind of print, in the same name, three days running, is a campaign. When the same strike and expiration keeps drawing aggressive buying day after day, the position is being built deliberately, not opportunistically. These are amongst the cleanest signals you will see.
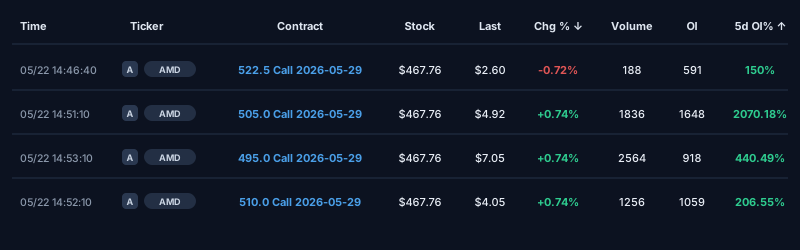
Let’s consider a real example as found on GOF’s Options Flow screen: AMD, which saw open interest increase dramatically over the 5 day period leading up to May 22nd at strikes ranging from 495 to 522.5. Volume was unusual as well. The Gamma Exposure (GEX) picture showed meaningful positive GEX at the 500 strike, right in line with the heaviest activity between 495-505. These 4 strikes show traders aggressively positioning for higher prices on AMD as we look toward the May 29 expiration they all share in common.
How to Read Options Flow Without Drowning in It
A live flow feed never stops. You will see hundreds of prints per minute on an active day. You cannot read them all. You do not need to.
The mental model that works.
- Filter aggressively before you start reading. Set a premium floor. $250,000 is a reasonable starting threshold for most readers. Below that, you will spend your day reading retail noise. You can drop the threshold later for specific names you are tracking.
- Read from the top. Recency matters. A $750,000 print that filled three minutes ago is more useful than the same print from two hours ago. Recent activity tells you what the market is reacting to right now.
- Look for repetition, not single events. A single big print can be a hedge, a roll, a rebalance, or a real bet. You cannot always tell. When the same strike keeps printing aggressively for an hour, the read is much cleaner.
- Ignore the obvious noise. Earnings hedges, index-level hedges, and rolls of expiring positions create high-premium prints that are not directional bets. Learning to spot and skip these is its own skill, covered in How to Filter Out Noise in Options Flow.
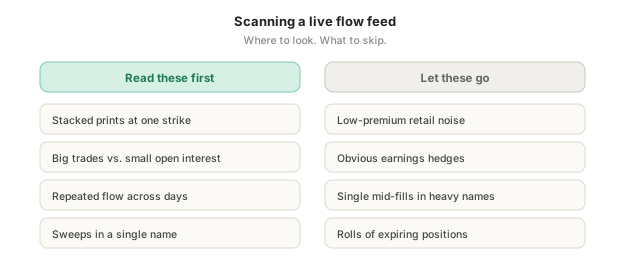
Most traders who burn out on flow do so because they tried to read every print. The fix is not effort. The fix is choosing what to ignore.
What You Can Do Now That You Can Read Flow
If you worked through this guide carefully, you can do five things you could not do before.
- Parse a single options flow print field by field
- Tell direction from the fill side
- Judge whether the size matters by comparing it to open interest and average volume
- Spot stacked prints, sweeps, and repeated flow as patterns
- Scan a live feed without trying to absorb every row
That is most of what an intermediate reader of options flow does. The next step is using what you see. Reading flow is recognition. Acting on it is decision-making, and it deserves its own treatment. When you are ready, How to Follow Unusual Options Activity as a Trading Signal covers what to do with the prints you have learned to identify.
If unusual activity is the concept you want to nail down first, What Is Unusual Options Activity, and How Do You Spot It? sits between this article and the strategy piece. It defines the category. The strategy piece tells you what to do once you can spot it.
The Real Test
Reading options flow is a skill you build by reading flow. The fields and patterns in this article are the map. The territory is a live feed scrolling in front of you on a Tuesday morning. While you will have the tools to read options flow on your own on GOF’s Options Flow screen, you don’t have to do it alone. A lot of traders doing the exact same thing are interacting everyday in GOF’s community Discord, where you can ask other members what they think, or if they’re seeing what you’re seeing. It never hurts to read tutorials, either, which you can do for free in Discord to have a headstart on using GOF’s Options Flow tool specifically.