
Time For The Market to Choose?
Friday gave a seemingly decisive break of key bull/bear levels on my charts, only to see the damage dramatically reduced with today’s gap up and rally. We raised question about the sustainability of Friday’s decline in Discord, mentioning that a lot of negative GEX expired that day. Today seems to validate that observation.
Looking more closely at the chart, the Keltner channels signal SPX has a path of least resistance down to 5299, since we’re below the middle Keltner channel. C{I Wednesday and Friday the 13th (for the superstitious traders out there) might be arguments for lower prices. However, we have 9/11, an overwhelmingly bullish market day on the anniversary of 9/11/2001, and we have generally oversold conditions.
If we do have a short-term rally, 5530-5550 match with some important resistance areas not shown on the chart below, though the Hull Moving Average is plunging lower toward those levels imminently. I’ve mentioned that I like to stay long above the Hull and short below the Hull, but another observation is that the Hull crossing over or under the price also marks brief periods of consolidation before potential trend changes. We saw that in late May and late August, though July was more abrupt. Even then, long above and short below was a good rule of thumb.
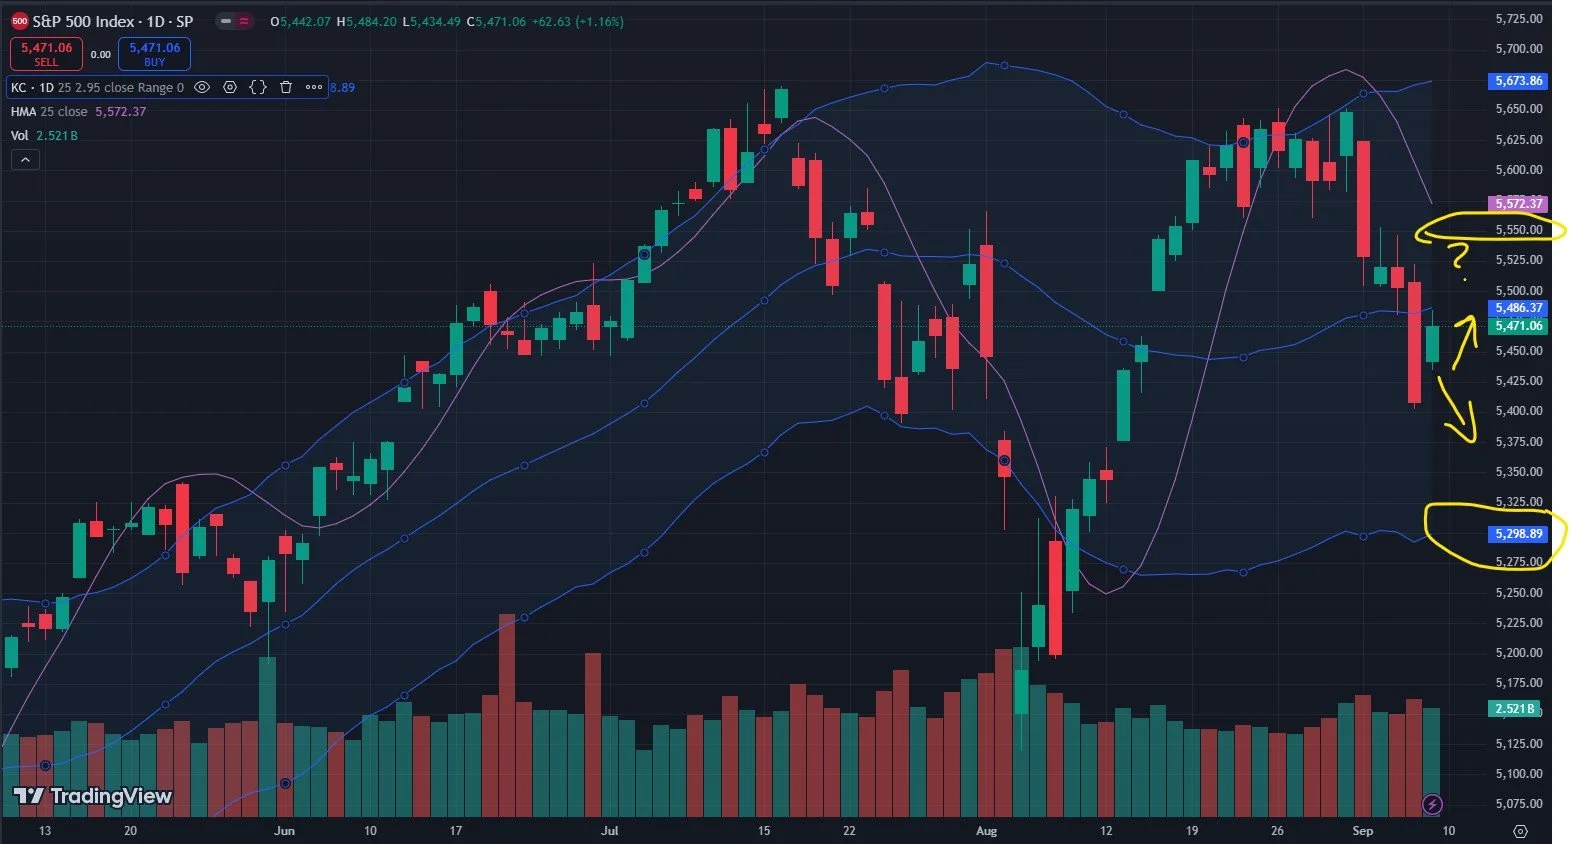
SPX Chart; TradingView.com
Turning more toward gamma (GEX), SPX is meandering around the zero gamma level, with a big Dealer Cluster zone way up at 6000 and another zone below at 5200. For today, I notice high option volume at 5000, though we can’t draw any definitive conclusions from that.
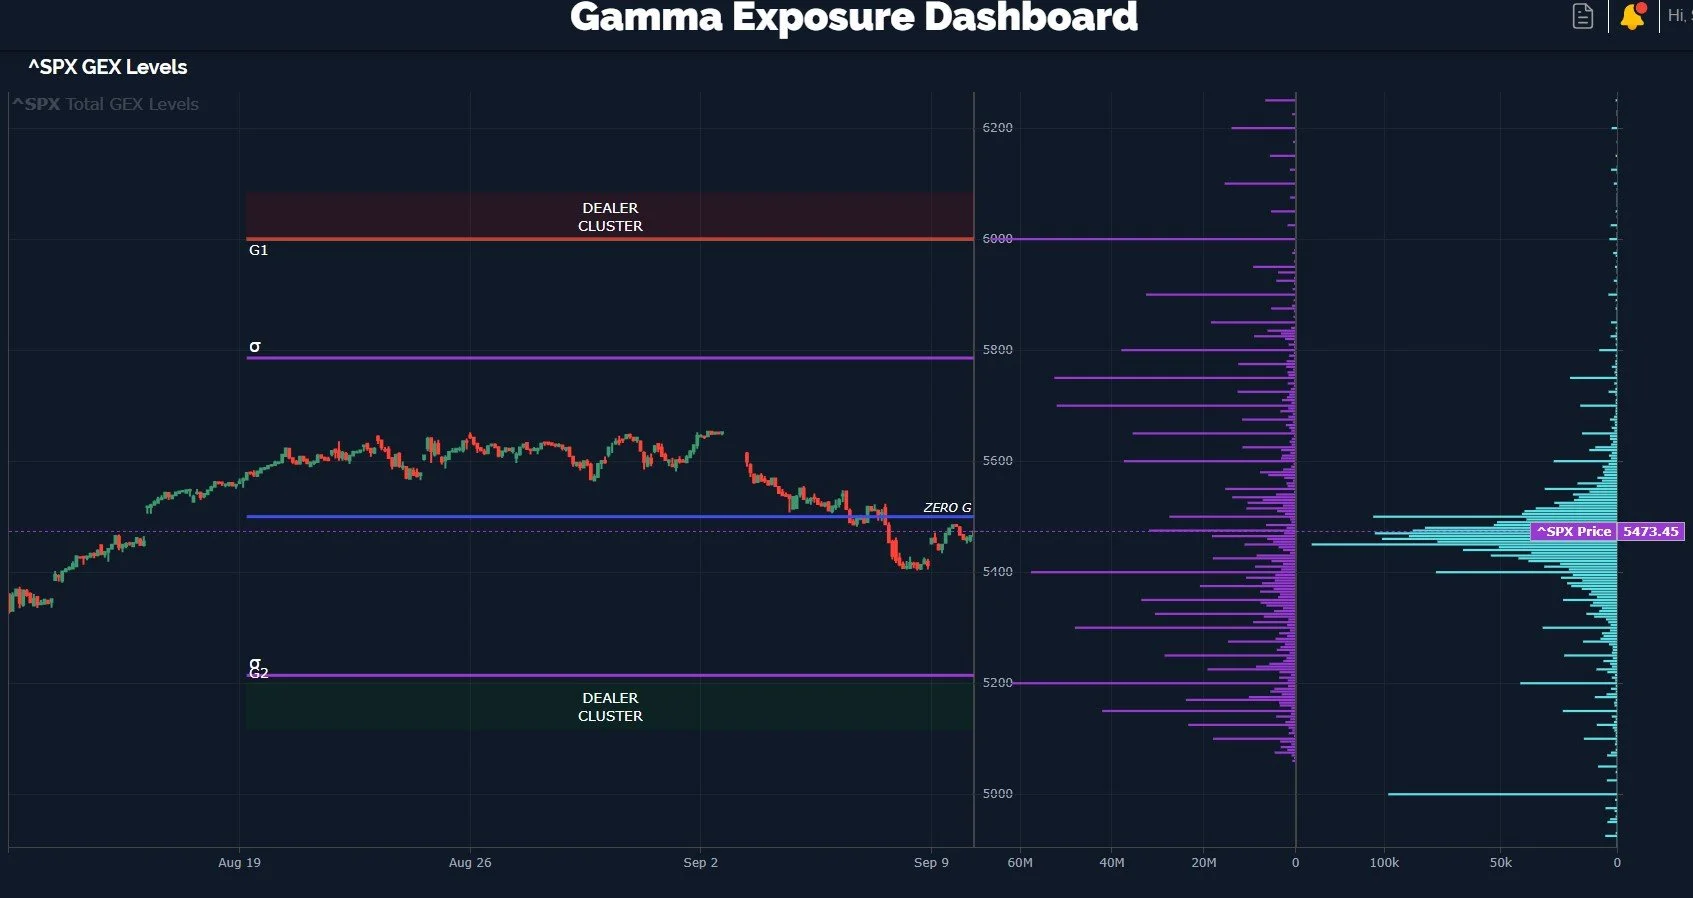
SPX GEX Levels: www.geeksoffinance.com
Friday saw SPX total net GEX drop to deep within what we consider bearish territory at -1.4B, though much of that expired that day, leaving us with an apparently improved and neutral -115M GEX for SPX. SPY remains deeply negative at -1.74B currently. Both are technically negative (though SPX is considered neutral), and neither are deep enough to the negative side to create a contrarian positive signal.

SPX Historical GEX: www.geeksoffinance.com
One observation last week was that DIA appeared to have a more bullish configuration than SPX or QQQ, both in terms of the chart and GEX. This continues to be so, with the Keltners showing a clear upward slope, and price holding the middle Keltner perfectly. Even if DIA is to turn down more meaningfully (which is not supported by technical evidence as of yet), GEX and price back a potential test of 413-415 area at a minimum.

DIA chart: TradingView.com
You can see below that DIA barely dipped into negative GEX territory and as of today is back in slightly positive territory.
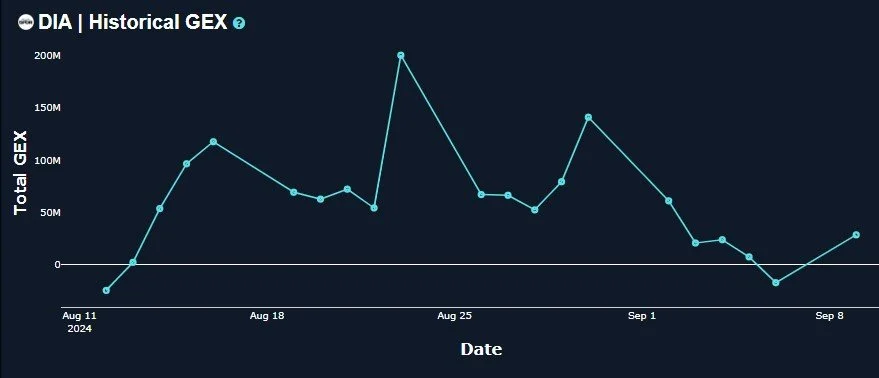
DIA Historical GEX: www.geeksoffinance.com
We first noted that indices seemed to break down into clearly negative areas, then mentioned the potential for a rebound to certain resistance areas. While this may be true, such a bounce may prove to be short-lived, partly due to the signal being provided by volatility. The VIX appears to be consolidating sideways from a much higher “base” over the last 4 days. Meanwhile, the Hull Moving Average is rising sharply, currently at 18.63. GEX is positive for the VIX and a spike to 28-29 seems realistic given the Keltner channels as well. Does such a spike wait for CPI? The Fed? Some sort of election surprise? We can try to watch for clues along the way.
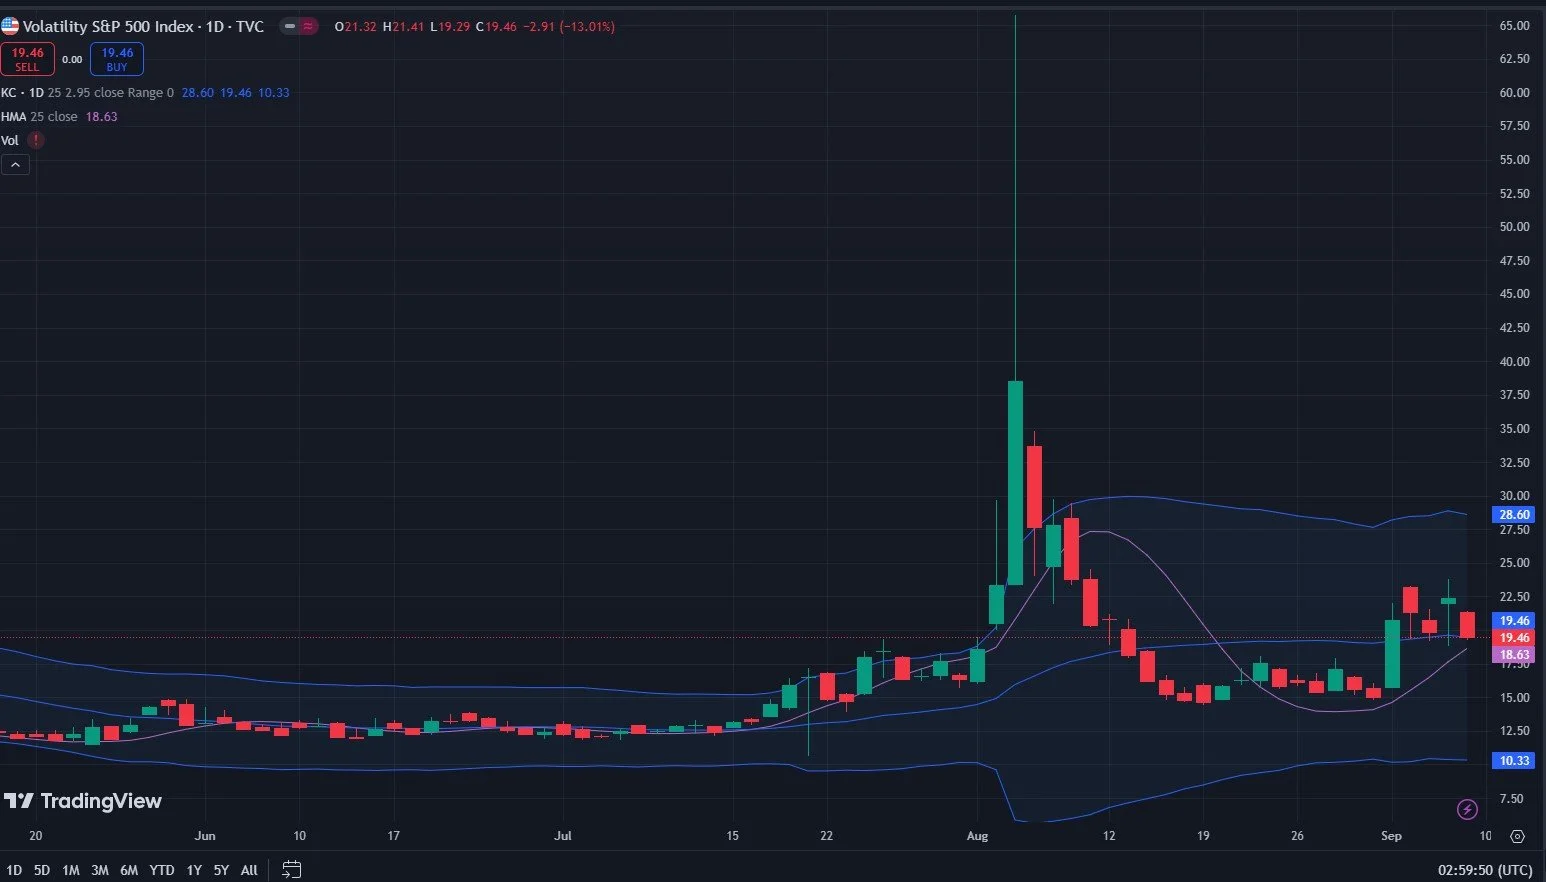
VIX Chart: TradingView.com
Looking Ahead to 9/11 And Friday The 13th
We have a very quiet data release day tomorrow, but Wednesday will be important with CPI and the 10-year auction, Thursday with Jobless Claims and more, and Consumer Sentiment on Friday. I don’t personally trade news headlines, but I find myself preparing for technical levels before the event in anticipation that the volatility ensuing after release might easily hit the upper or lower target I wanted to see. I find myself to be a lot less stressed by reacting to such news instead of biting my lip and grasping my mouse firmy with sweaty palms. Stay with us in Discord and we will alert what we see throughout the day. Hopefully you’ll join us!
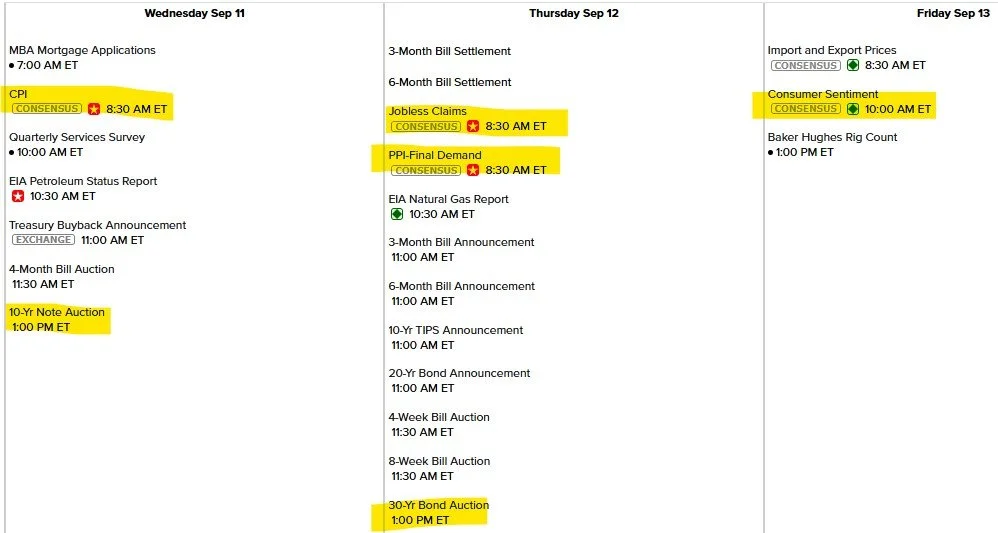
Calendar Source: Econoday.com
If you’re interested in learning more about our strategy approach, we address all of these topics in our Geek University course which is included in all memberships.
If you’re interested in accessing our tools and analytics, be sure to check out our website!
Thanks for being part of our community and know that we invite your feedback!
We have a variety of educational videos on YouTube as well!
The information provided by Geeks of Finance LLC is for educational purposes only and is not intended to be, nor should be construed as, an offer, recommendation or solicitation to buy or sell any security or instrument or to participate in any transaction or activity. Please view our Investment Adviser Disclaimer and Risk Disclosure.