
It Started: The 2024 Recession Cycle

Click to watch our YouTube Video discussing this content.
In the last 100 years, rising unemployment has been a precursor to the start of nearly every major economic recession.
And unfortunately, that’s the track the U.S. economy is currently on.
Let’s first dive into the macro picture to see how the economy is faring and then we’ll review some trade setups that we’re watching for this week later in the article.
Check out our Discord to see our latest market discussions as well.
The chart below highlights the correlation between rising unemployment and periods of recession. The gray zones indicate periods of recession, while the blue line indicates the US Unemployment Rate.

Source: U.S. Bureau of Labor Statistics, fred.stlouisfed.org
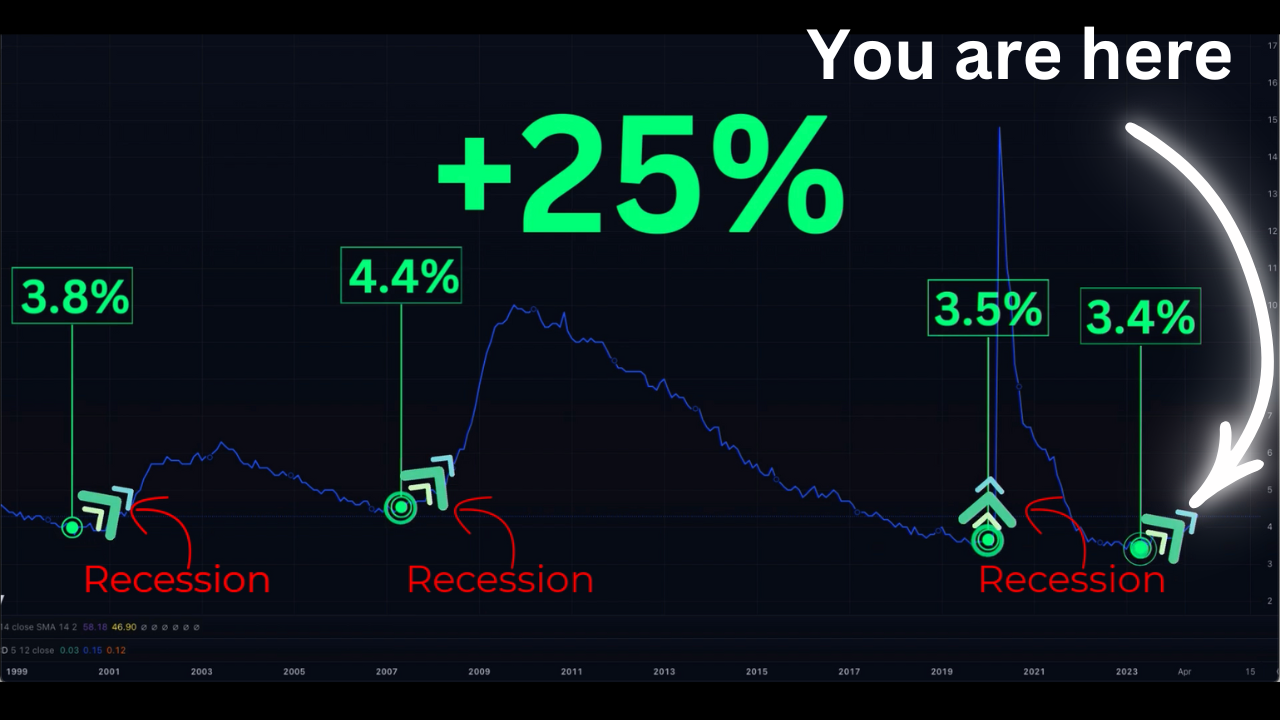
If we zoom in, we see a very precise bottoming process in the Unemployment Rate which has signaled the start of the many of these recessions, including in the past 25 years.
Starting in April 2023, unemployment bottomed at 3.4%
In February 2020, it bottomed at 3.5%
In May 2007, it bottomed at 4.4%
And in April 2000, the unemployment rate bottomed at 3.8%

Each time that we saw a rise of 25% off of the low, that has been the starting point of a recession.
And that’s exactly where we are today.
Now, this is simply just one economic statistic.
So in order to understand whether this important data point has credibility this time around or not, we should also analyze what’s happening underneath the market surface.
Let’s dive into 3 of the top factors influencing the economy and the market today.
1) The Japanese Carry Trade Unwind
On July 31, the Bank of Japan surprised global markets by raising its policy rate to 0.25%, which was only its second rate hike in 17 years. The BOJ also announced plans to slow bond purchases to reduce economic stimulus.
This kicked off the unwind of the big global “Carry Trade” strategy which literally has trillions of dollars at stake.
What Is a Carry Trade?
A carry trade is an investment strategy that involves borrowing currency from a region with low interest rates (i.e. - Japan) and reinvesting that capital in a region with higher interest rates (i.e. - the U.S.). The Japanese yen has been a popular choice for carry traders due to Japan's historically low interest rates.
But that trade is now unwinding after the BoJ’s surprise rate hike, as well as expectations for a Fed rate cut. Both factors are significantly reducing the profitability of the carry trade strategy.
And because this mega globally-important trade could still be unwinding for days or even weeks to come, the market volatility we’ve seen over the past couple of weeks may not be going away just yet.
2) The Fed Funds Rate/Unemployment Correlation
The below chart highlights the inverse relationship between interest rates and unemployment.
Simply put, rising unemployment is a strong force that pushes the Fed to cut rates.
The crucial question is: What does the market typically do when the Fed is forced to consecutively lower rates over time?
Usually there is an initial positive reaction to the prospect of lower rates. However, with time we have historically seen higher volatility and lower prices in the ensuing months after the start of a Fed rate cutting cycle.
This is typically due to deteriorating economic conditions, and unemployment is a primary signal that the Fed watches to monitor these conditions.
We can clearly see the inverse relationship between interest rates and unemployment in the chart below.

Fed Funds Rate: Blue Line, Unemployment Rate: Orange Line
3) The Fed Is Behind The Curve
Former NY Fed President Bill Dudley made headlines on July 24th by suggesting that the Fed needed to begin cutting rates at the August 2nd FOMC meeting.
He cited deteriorating economic concerns among the factors contributing to his assessment, and now of course he’s looking pretty smart with both his timing and his outlook.
Wall Street is also pushing for cuts with Goldman, JP Morgan, and several other large banks suggesting a 50bp rate cut may be necessary at the September FOMC meeting.
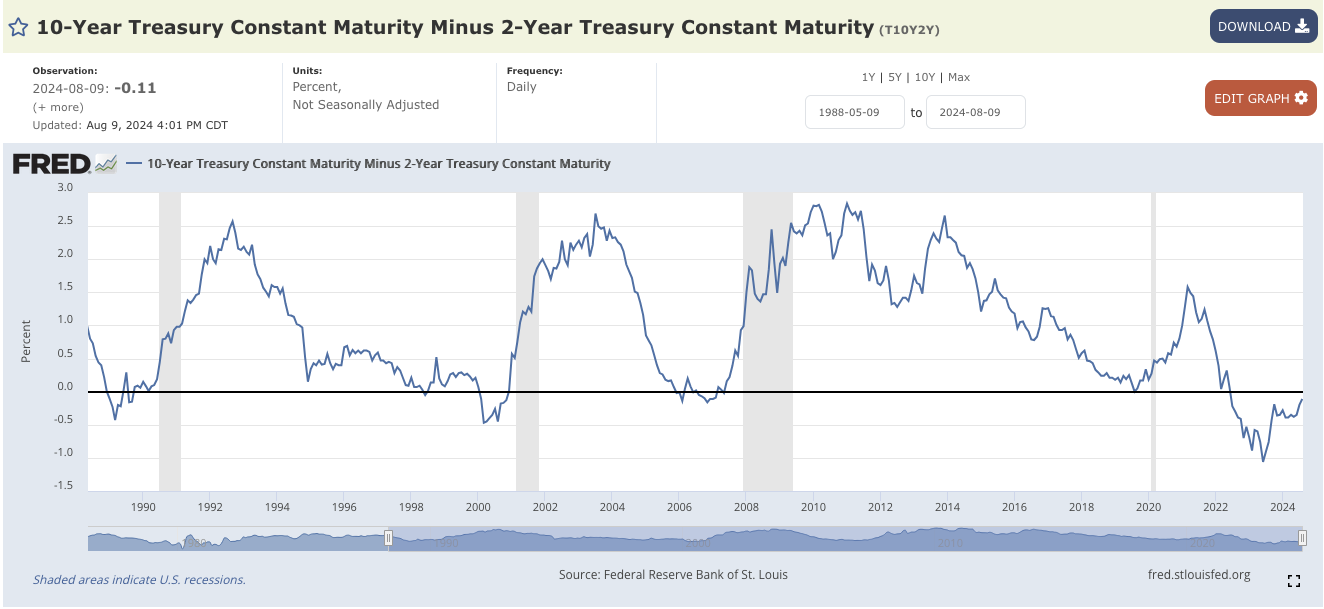
On top of all that, the 10 year-2 year chart appears to be un-inverting. Another pre-recession signal with a near perfect track record.
The Macro Bottom Line
If these macro factors continue along their current trajectories, the U.S. economy could have as little as 60-180 days left before it officially enters a recession.
It remains to be seen just how close to recession we are and how much the market cares about it in the immediate term. In the meantime we will continue to monitor tactical data such as GEX and implied volatilities to gauge day to day setups.
Trade Setups We’re Watching
Now that we have the lay of the land from a macro perspective, let’s review a few trade setups that we’re currently watching.
SMH
The semiconductors have been one of the leaders in the market selloff over the past few weeks.
The SMH(semi-conductor ETF) appears to be reaching an important area both from a GEX perspective (near Zero GEX) and from a technical perspective as it approaches the down trend line.
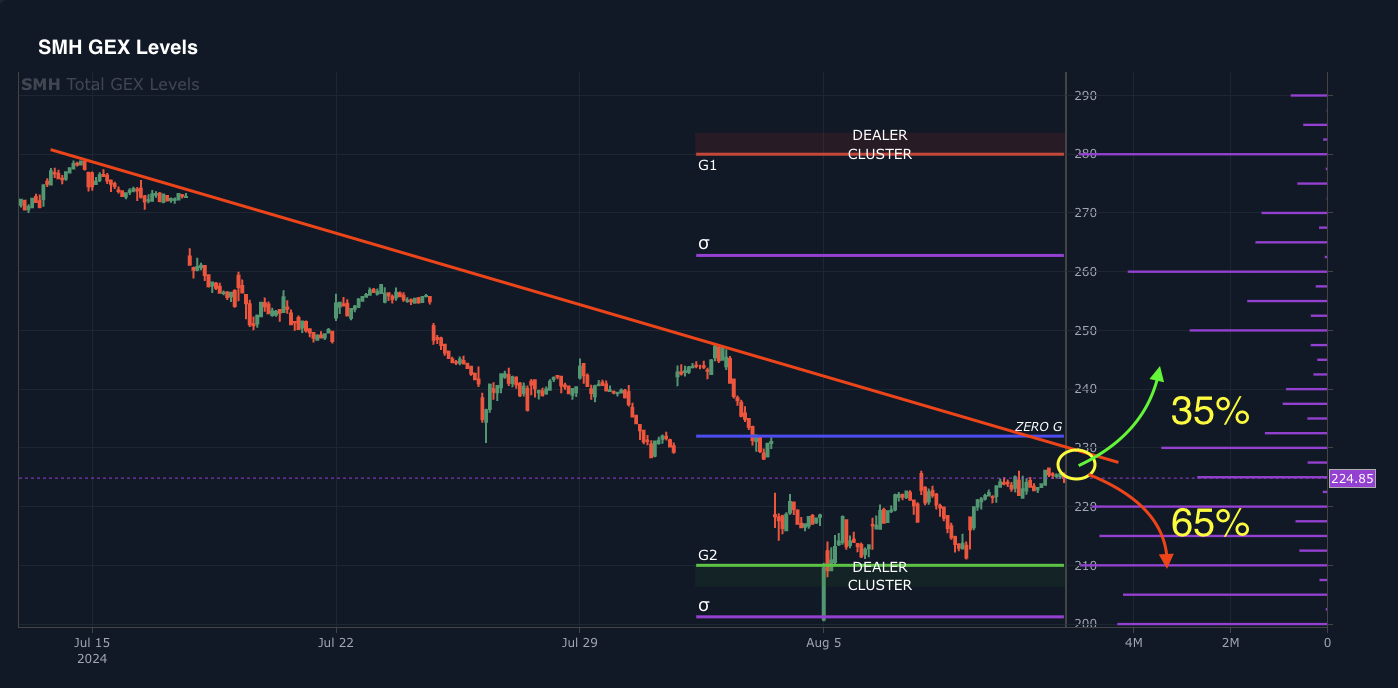
Our simple estimate is that the probabilities are higher for a continuation of the downtrend in the near term than for a major breakout based on the GEX structure (right-side purple bars).
But since we don’t have a crystal ball, we like giving ourselves opportunities to profit if either outcome materializes in the coming week and so we are going long an iron condor strategy on SMH that gives us exposure to both a large breakout and a large breakdown.
Btw if you’re not a member and you’re interested in our GEX tools and analytics, check out our site here.
GLD
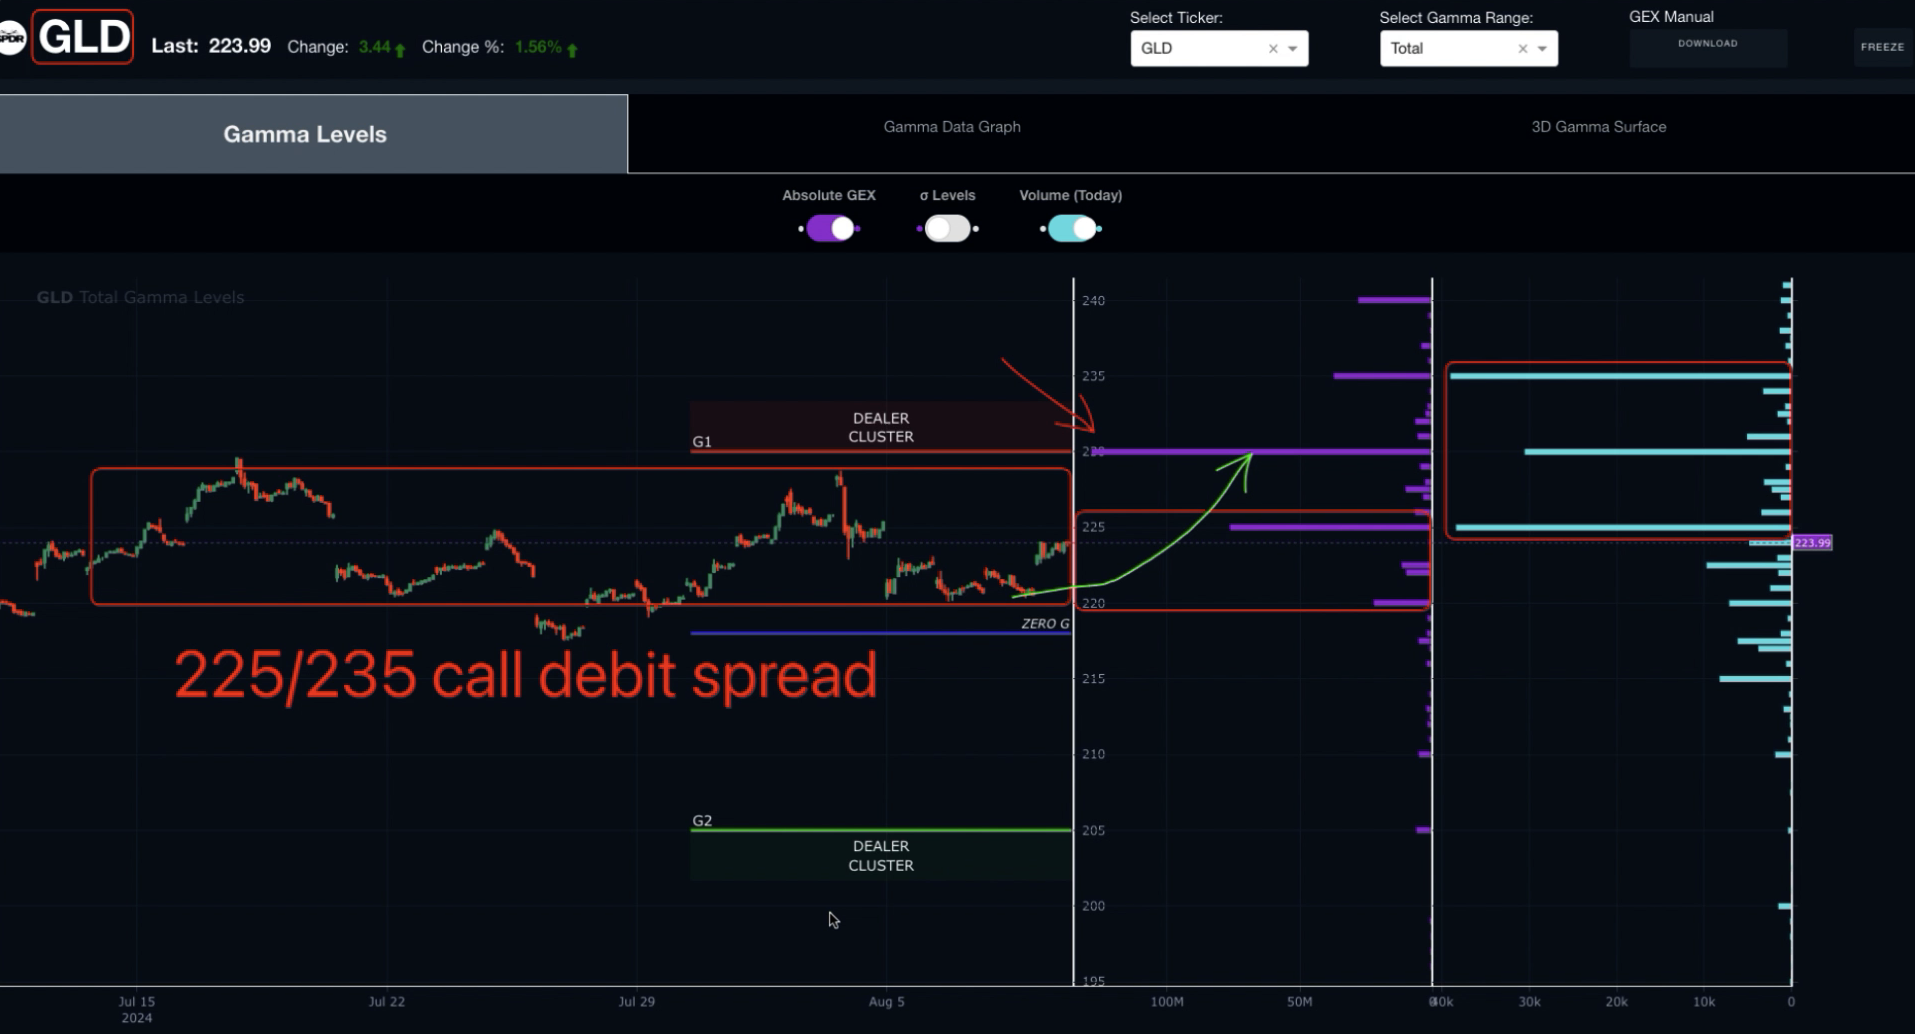
We have an existing position on GLD which we are aiming to exit this week, however GLD continues to see GEX growing at higher strikes.
Recently, the largest GEX concentration has been at the 230 strike and we think there is a decent probability that GLD can make a move towards that level in the coming weeks, especially given market and geopolitical uncertainties rising.
We’re watching the 225/230 or 225/235 call debit spread in the September expiration as an interesting idea to take advantage if an upside move continues.
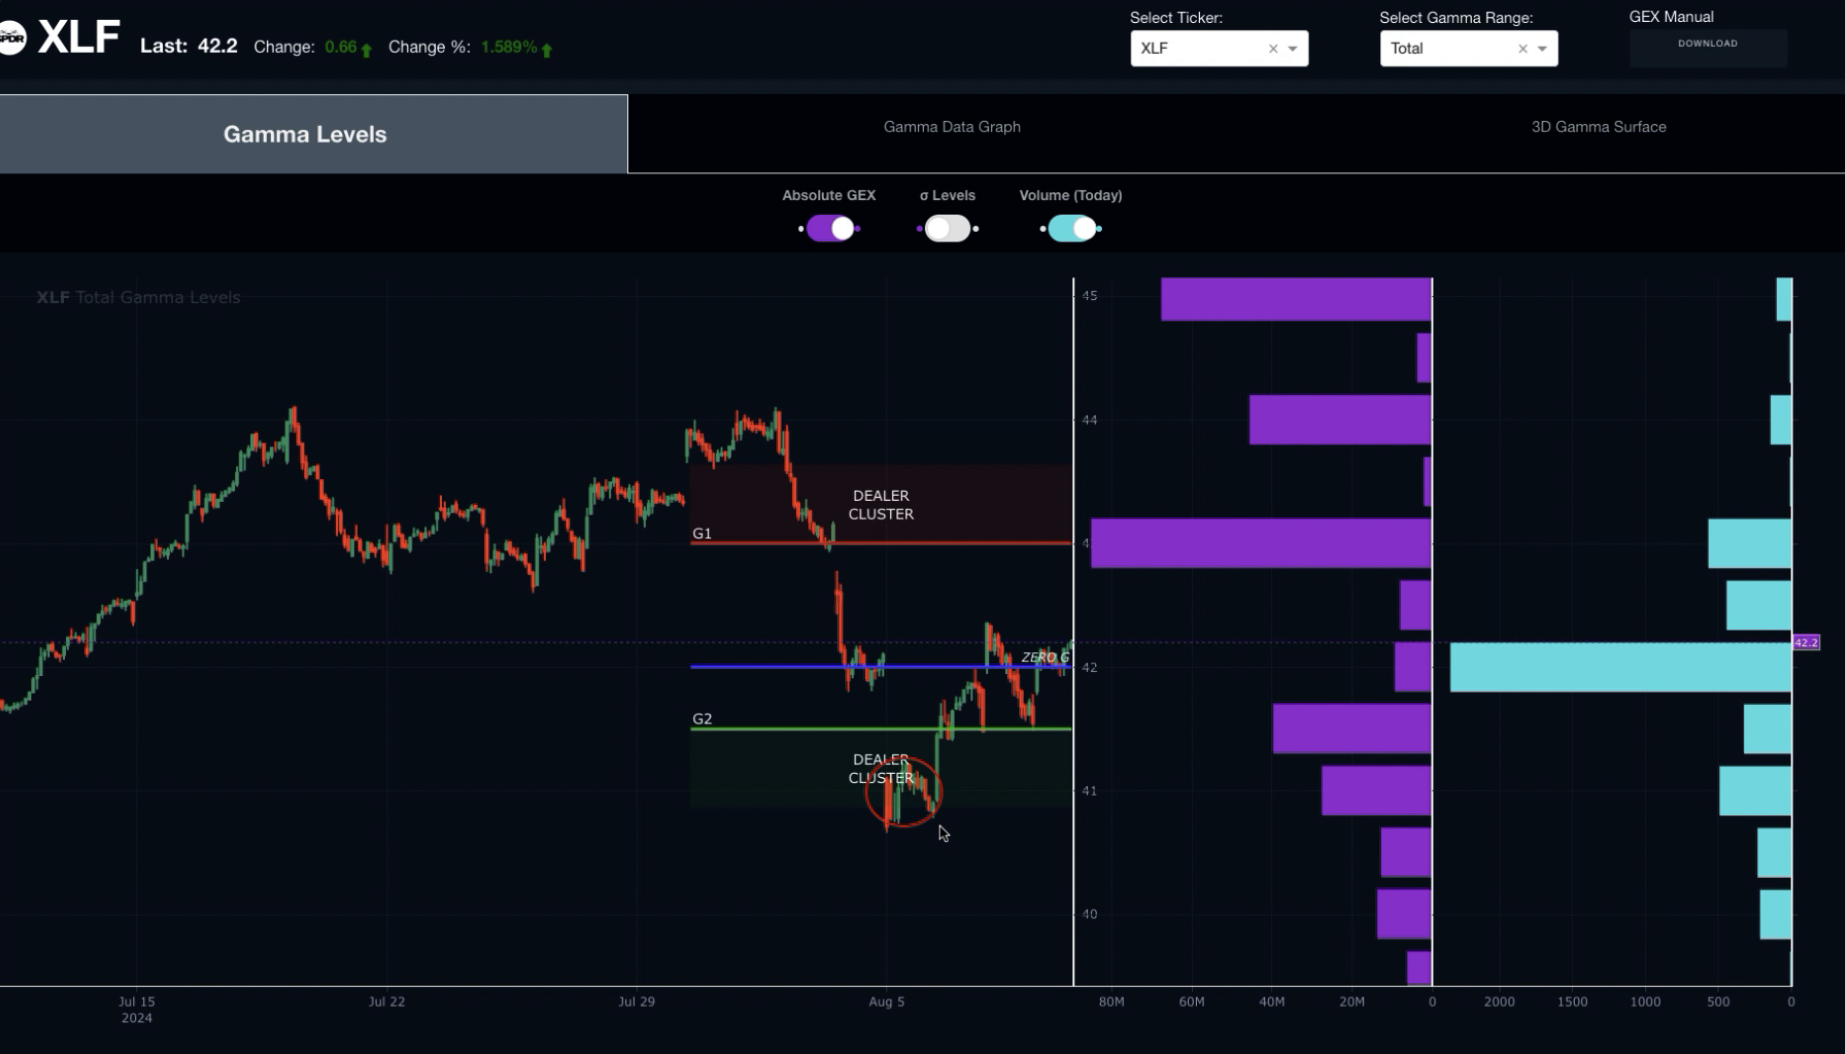
XLF
The financials have been a relative outperforming sector in the past month and the GEX structure on XLF shows that market participants appear to be focusing on the 43-45 strikes (purple bars).
XLF recently bounced off of a Dealer Cluster zone and so we are watching to see if the move continues to the upside this week.
We’ll be discussing these ideas and others in the coming week - We invite you to check out our community discord for our latest market conversations.
If you’re interested in learning more about our strategy approach, we address all of these topics in our Geek University course which is included in all memberships.
If you’re interested in accessing to our tools and analytics, be sure to check out our website!
Thanks for being part of our community and know that we invite your feedback!
We have a variety of educational videos on YouTube as well!
The information provided by Geeks of Finance LLC is for educational purposes only and is not intended to be, nor should be construed as, an offer, recommendation or solicitation to buy or sell any security or instrument or to participate in any transaction or activity. Please view our Investment Adviser Disclaimer and Risk Disclosure.