
MASSIVE MARKET SHAKEUP: How We’re Trading The Reversal
REMINDER: $300 OFF THE ANNUAL PM SUBSCRIPTION ENDS SOON! ENTER SUMMER2024 AT CHECKOUT TO RECEIVE THE DISCOUNT!

Click to watch our YouTube Video discussing this content.
52.7% of market participants were BULLISH on July 17th, the highest reading since last year according to the AAII Sentiment Survey.
That also happens to be the recent market top.
The move is a massive swing in market sentiment, compared to mid-April when bullishness was only 32.1%, and it’s also far above the historical average of 37.5%.
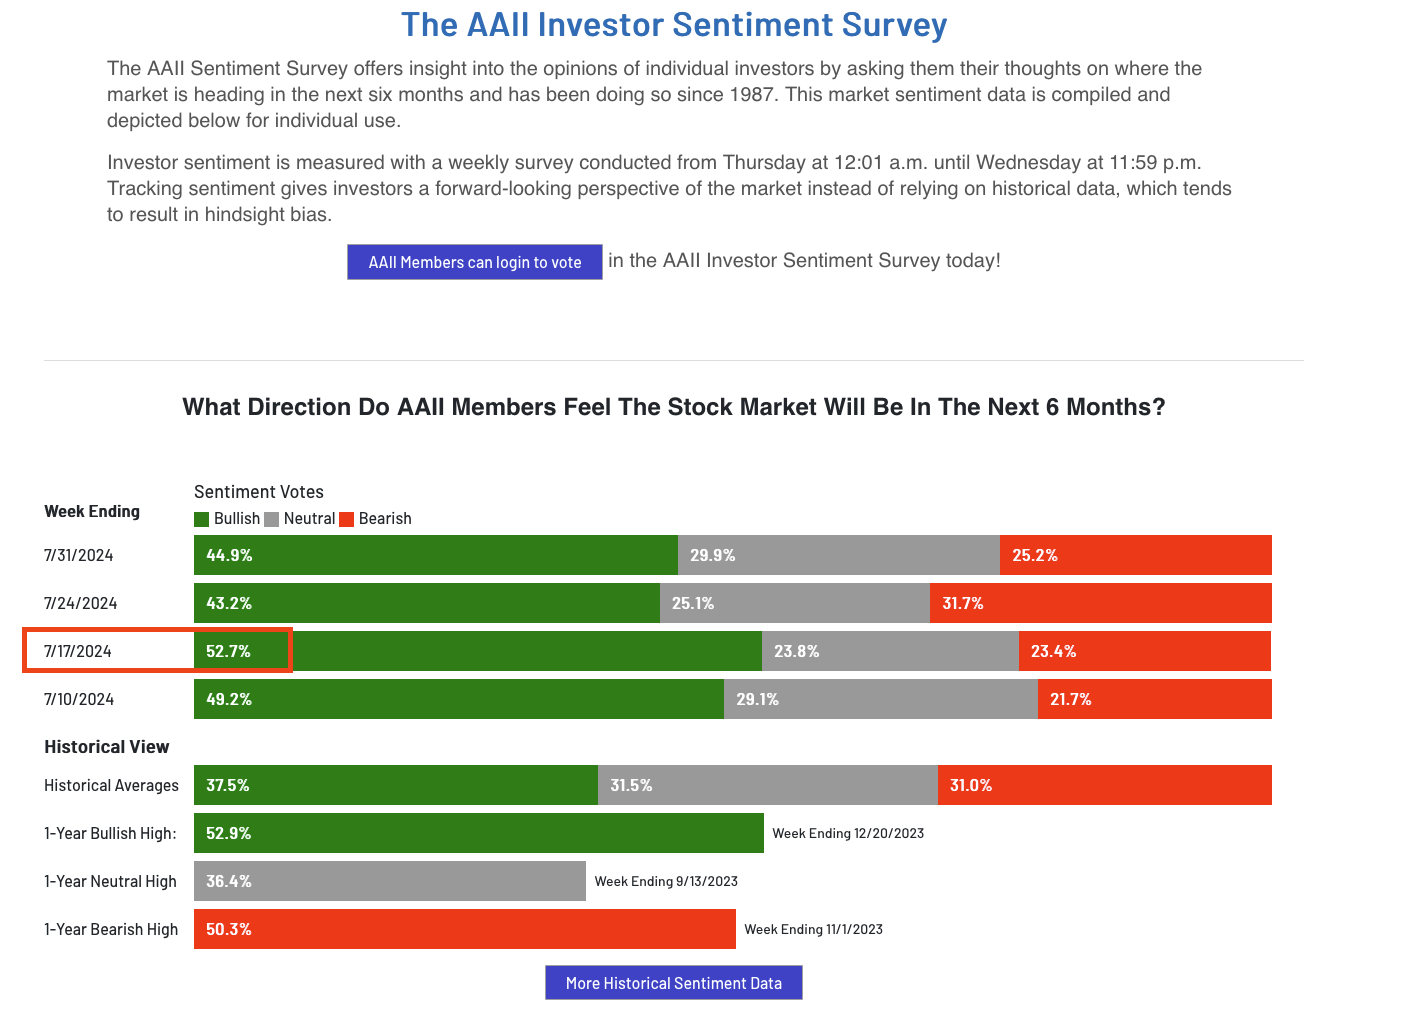
The recent bullishness is in line with previous levels of PEAK bullishnesses and has historically been an indication of impending market reversals.
In fact the last time over 50% of participants were bullish, on March 27th, the market saw a quick 5% pullback.
The same thing happened after the extreme readings on July 17th - a quick 5% pullback, plus some.

Reversals following peak bullishness
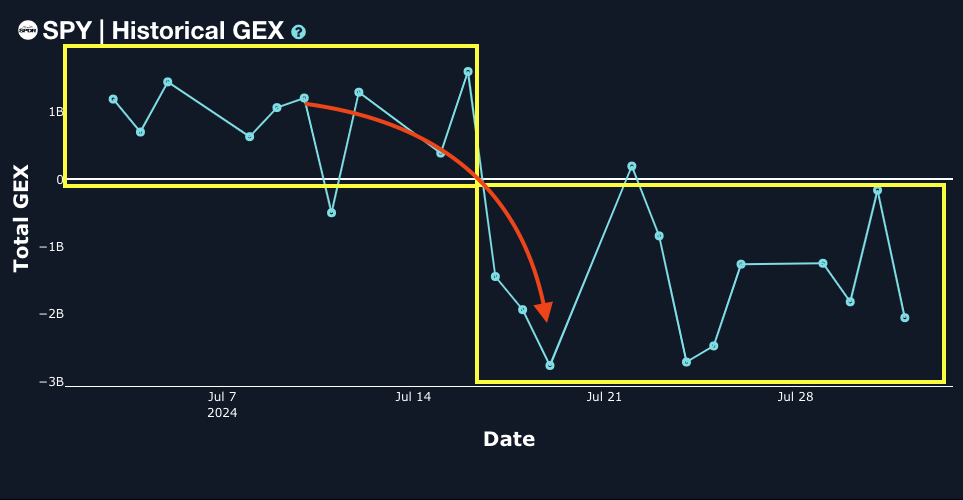
When GEX enters negative territory, volatility typically rises and lower prices result. The recent shift in GEX illustrates how drastically the options market can change when there are no buyers left.
So, how are we trading the reversal?
Analyzing GEX targets
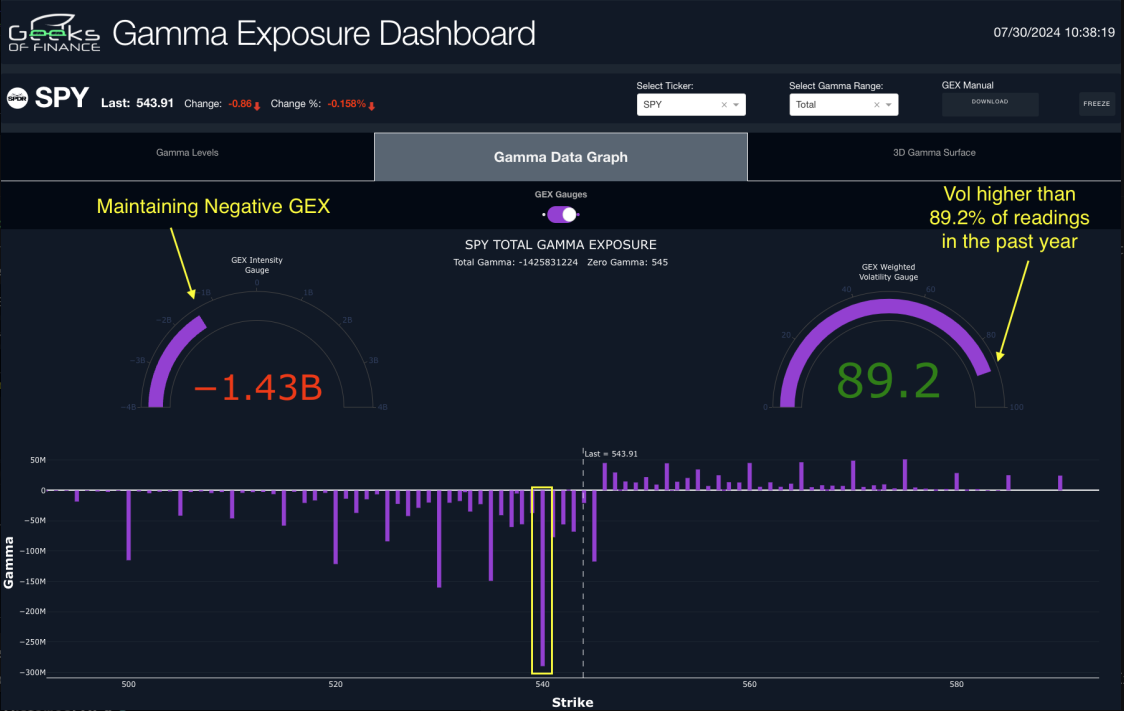
Large shifts to highly positive GEX (or highly negative GEX) are typically accompanied by large positive (or negative) GEX concentrations. These concentration levels act as magnets and ultimately potential price targets.
On 7/30, SPY was showing a large GEX concentration at 540 with a growing concentration at the 530 level.
Our GEX Intensity Gauge showed that there was plenty of room to go if the market started unraveling, while Implied Volatility was 89.2% higher than readings over the past year. Both of these signaled that more downside was likely.
Btw, if you’re not a member and you’re interested in our tools and analytics, check out our site.
Once the 540 level broke and the market opened up at 535.75 on Friday morning, the probabilities increased for a sharp move down to the 530 strike.
As of 8/2 the SPY hit its large GEX target at the 530 strike and we also saw negative GEX growing at the 500 strike.

SPY 500 and 530 negative GEX concentrations
Searching for Trade Setups
The tricky part of trading heading into next week is that the market is already starting to look stretched based on both Volatility and GEX data.
As part of our asymmetric risk/reward strategy, we are looking for plays on both the upside and downside in the near term.
One of our favorite setups involves going long on a pullback into a lower Dealer Cluster zone. Our GEX Dashboard automatically identifies these areas but you can also estimate where these are by analyzing gamma and open interest.
Currently the SPY could be setting up for a snapback bounce next week, even if only temporary. We want to see more GEX growing at 535-545 next week to confirm the setup.

Potential bounce setup forming
The VIX
The VIX moved an insane 50% on Friday breaking through a long term down trend before retracing at the end of the day.
When it comes to analyzing the VIX, we divide the VIX into 3 distinct volatility regimes: Low, Moderate, and High.
A Low Vol regime is when the VIX is primarily below 20 for an extended period.
A Moderate Vol regime is when the VIX is primarily between 20-35 for an extended period.
A High Vol regime is when the VIX is primarily above 35 for an extended period.
The below chart helps illustrate these regime periods. Are we seeing a shift from Low Vol into a Moderate Vol regime?
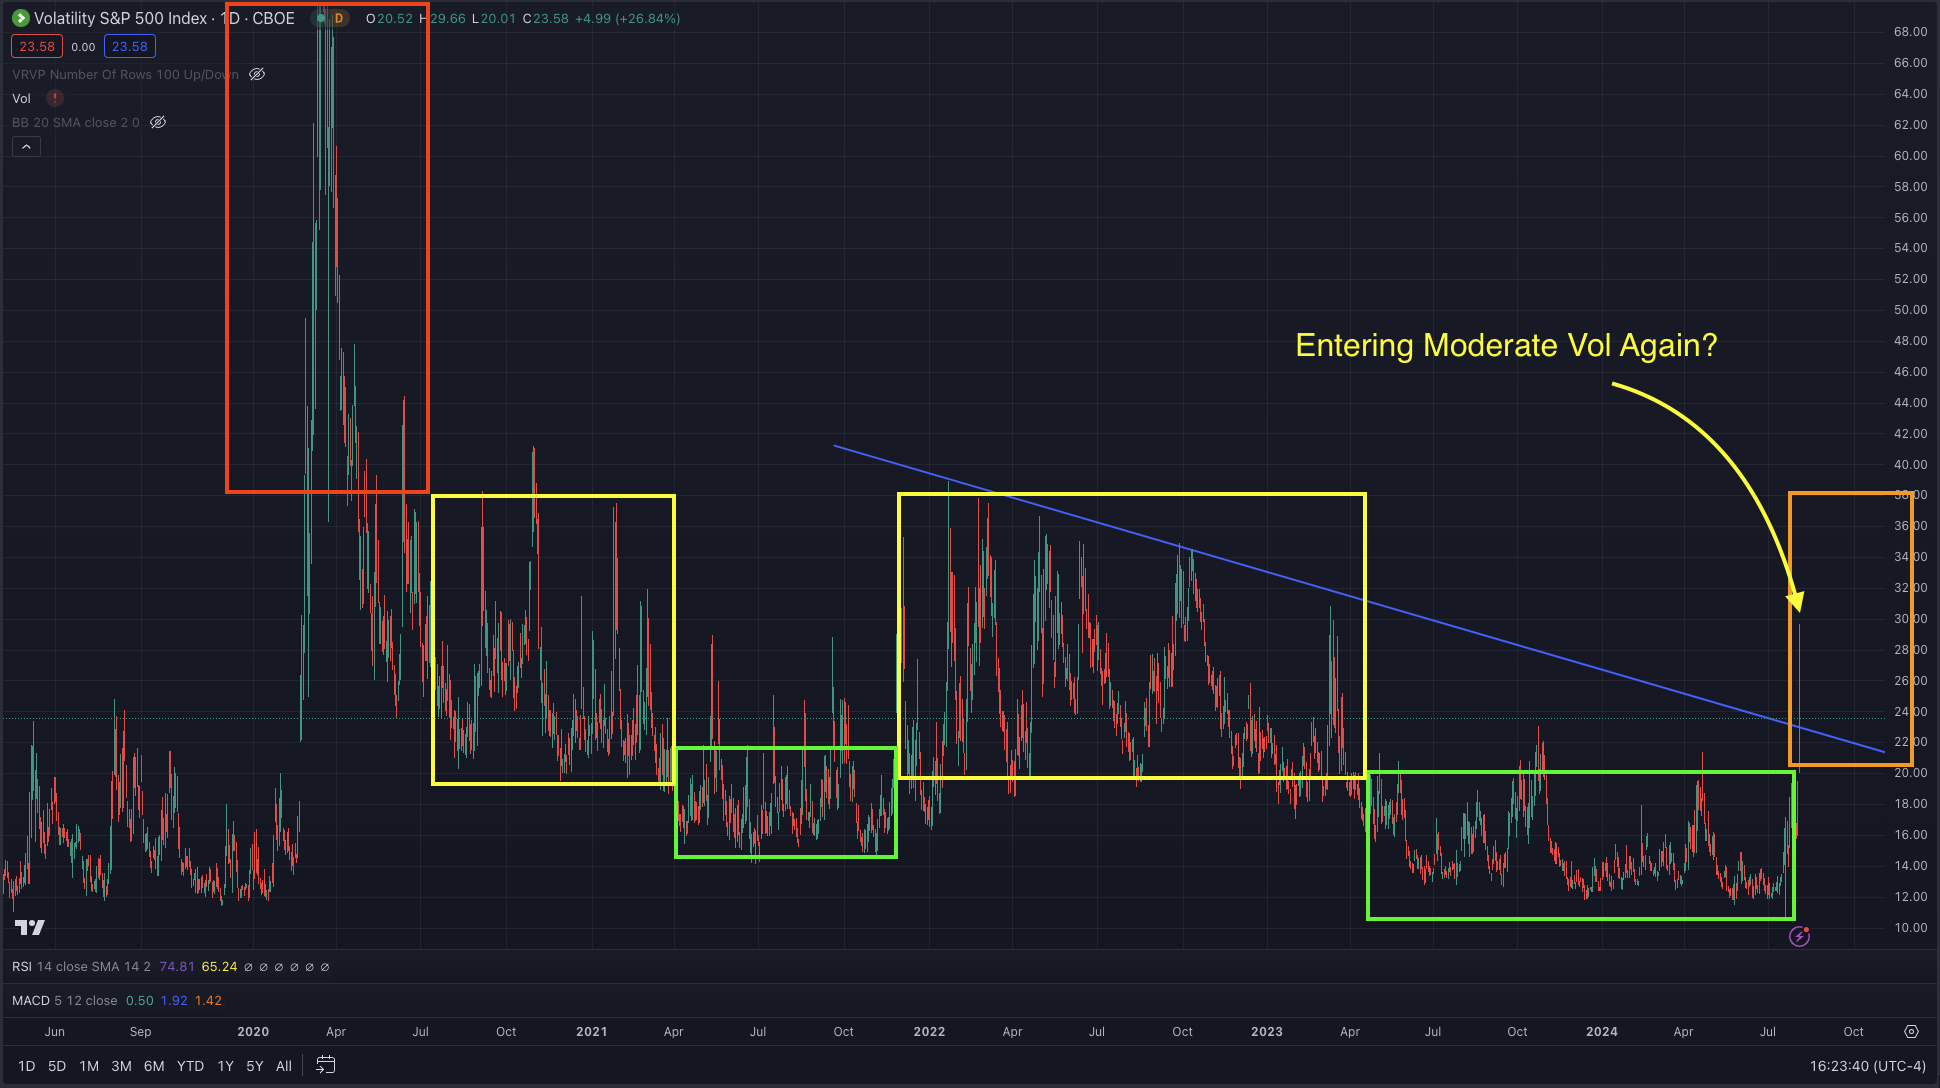
Volatility Regimes
Identifying Major Reversal Zones
Market reversals often coincide with short-term or long-term cycles which can be identified by specific characteristics.
The elements we typically look for to spot/confirm a major reversal zone are:
Big Swings in GEX
Increasing Volatility (near both tops and bottoms)
Extreme Sentiment Readings
There’s nothing extraordinarily complex about these data points, but learning to properly interpret the data and apply an effective portfolio strategy are the main keys to success.
If you’re interested in learning more, we address all of these topics in our Geek University course which is included in all memberships.
We also invite you to check out our community discord for our latest market conversations and trade idea discussions.
If you’re interested in accessing to our tools and analytics, be sure to check out our website!
Thanks for being part of our community and know that we invite your feedback!
We have a variety of educational videos on YouTube as well!