
Geek’s weekly preview
friday, July 5 & full week Review:
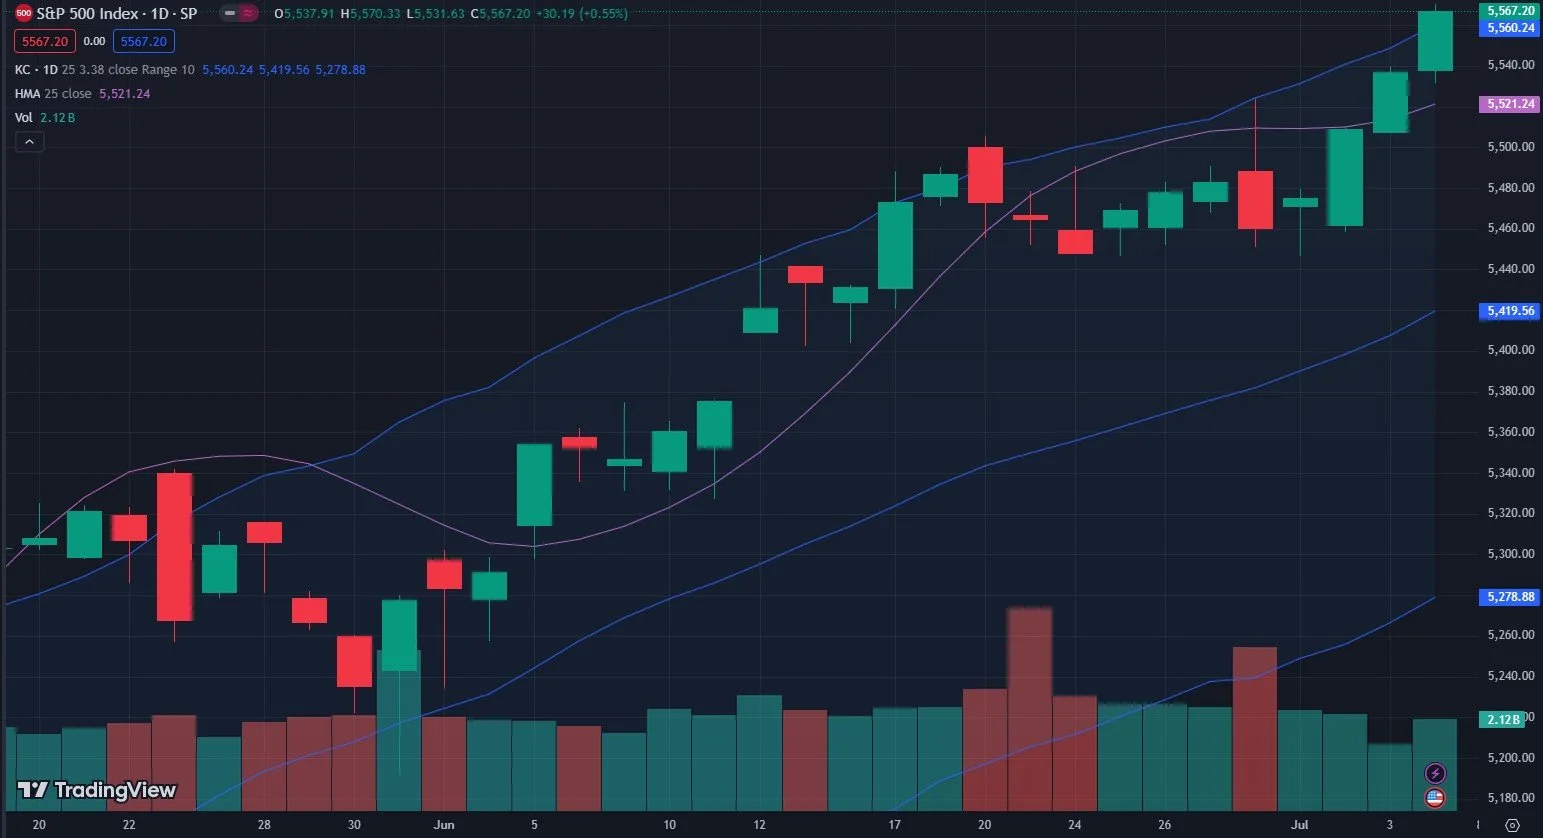
We have been eyeing 5600 for at least a couple of weeks as a potential upside target, and we reached 5570 during a low-volume, one-sided bullish week last week. It’s nice to see gamma (GEX) giving us such clues in advance, even though the day-to-day can still be tricky along the pathway to targets being fulfilled.
SPX’s move higher brought us above the daily upper Keltner channel, and QQQ is even more stretched above the top. We’ll look at several reasons that-combined with the theoretical resistance of the Keltner channels-might be signaling a pullback is near.
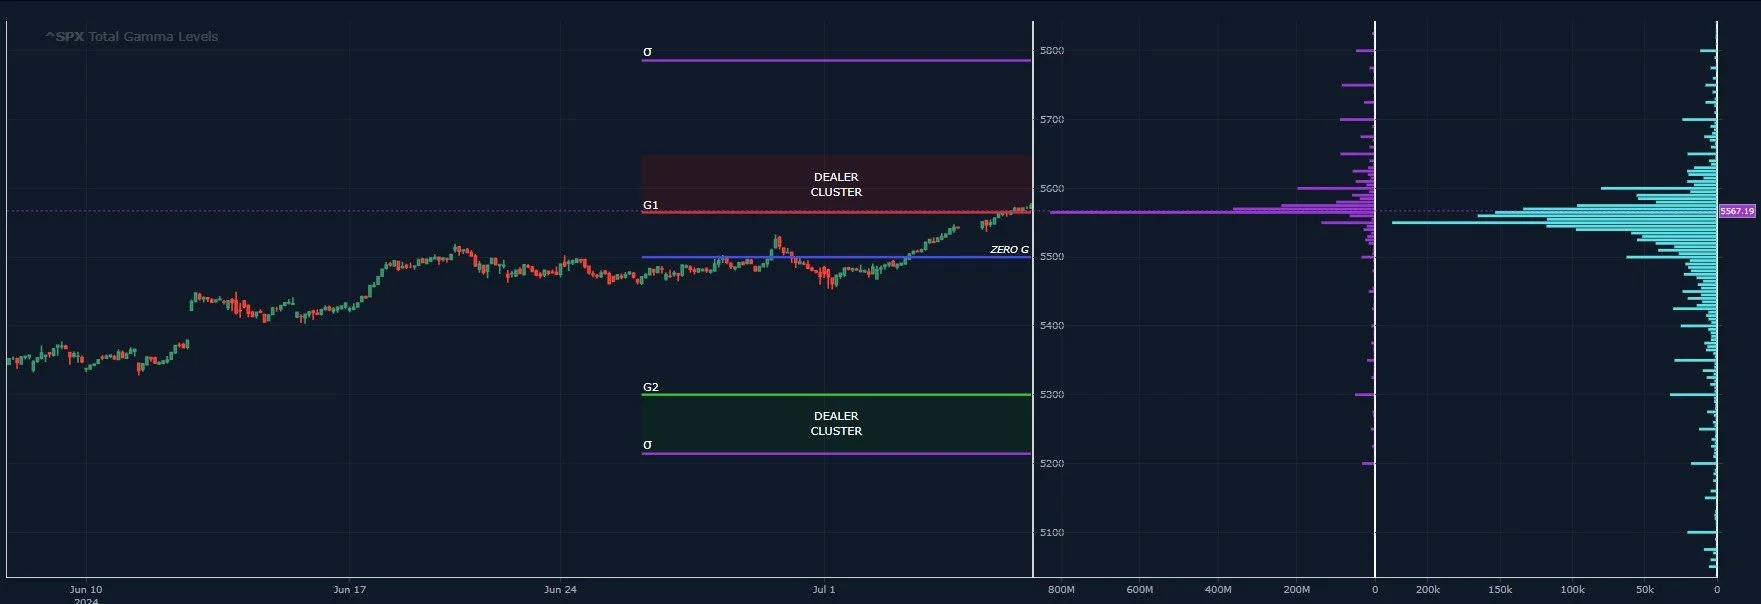
SPX is within the red Dealer Cluster Zone, which we interpret to mean that market positioning currently doesn’t support a sustainable move higher (sustainable being the key word).
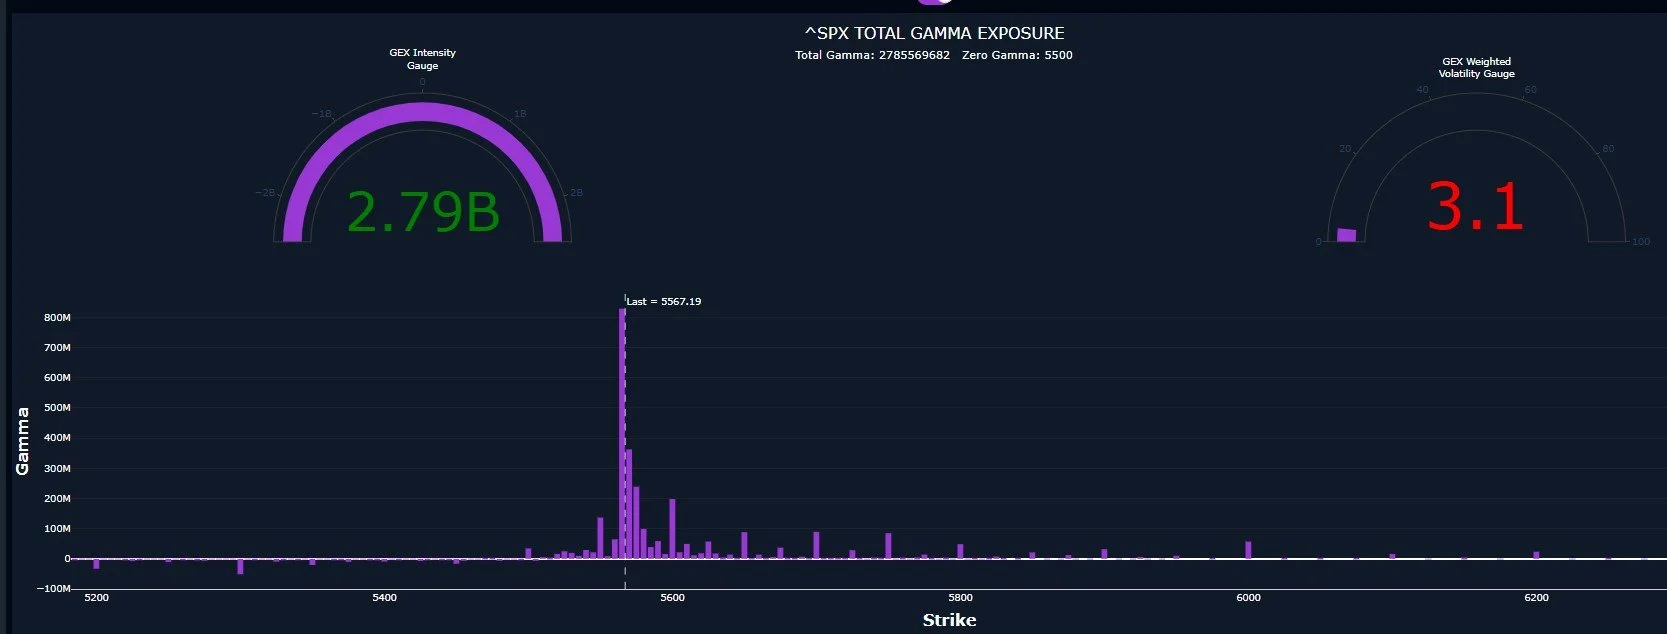
GEX-weighted volatility is very low, near a lower extreme, in fact. Mean reversion tends to gradually or suddenly occur from such levels. We also see the GEX Intensity Gauge showing positive GEX that is at quite the extreme relative to where GEX has been over the last 12 months.
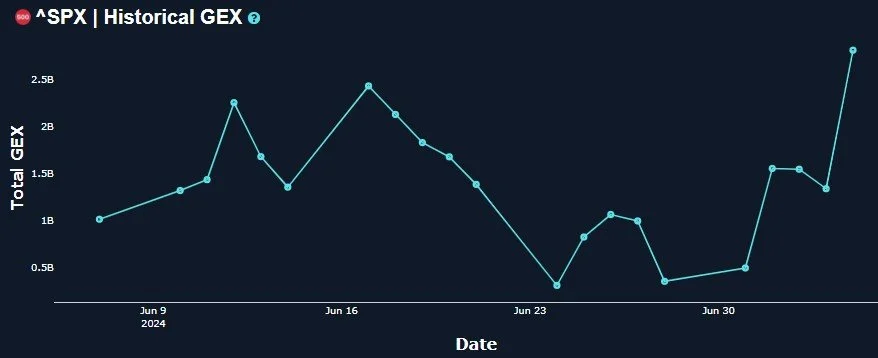
To demonstrate this another way, look at the historical chart, which shows SPX’s positive GEX to have exceeded the last two highs. For the record, those last two spikes around mid-June marked short-term tops. The logic behind extreme GEX creating the environment for a reversal in the opposite direction is that the extreme readings show very one-sided positioning by participants, leading to those participants inevitably getting caught offsides. No analogy is perfect, but think about Volmageddon in 2018, you can’t point to a widespread news headline or economic reason for the death of the short volatility funds, but the strategy became too crowded. The pendulum extending to its max in one direction is reason enough for the swing in the other direction, it doesn’t require someone to push it back. You can find that in my Geek’s Book of Wisdomous Sayings: Inspirations From Yogi Barra & Jack Handy (out of print).
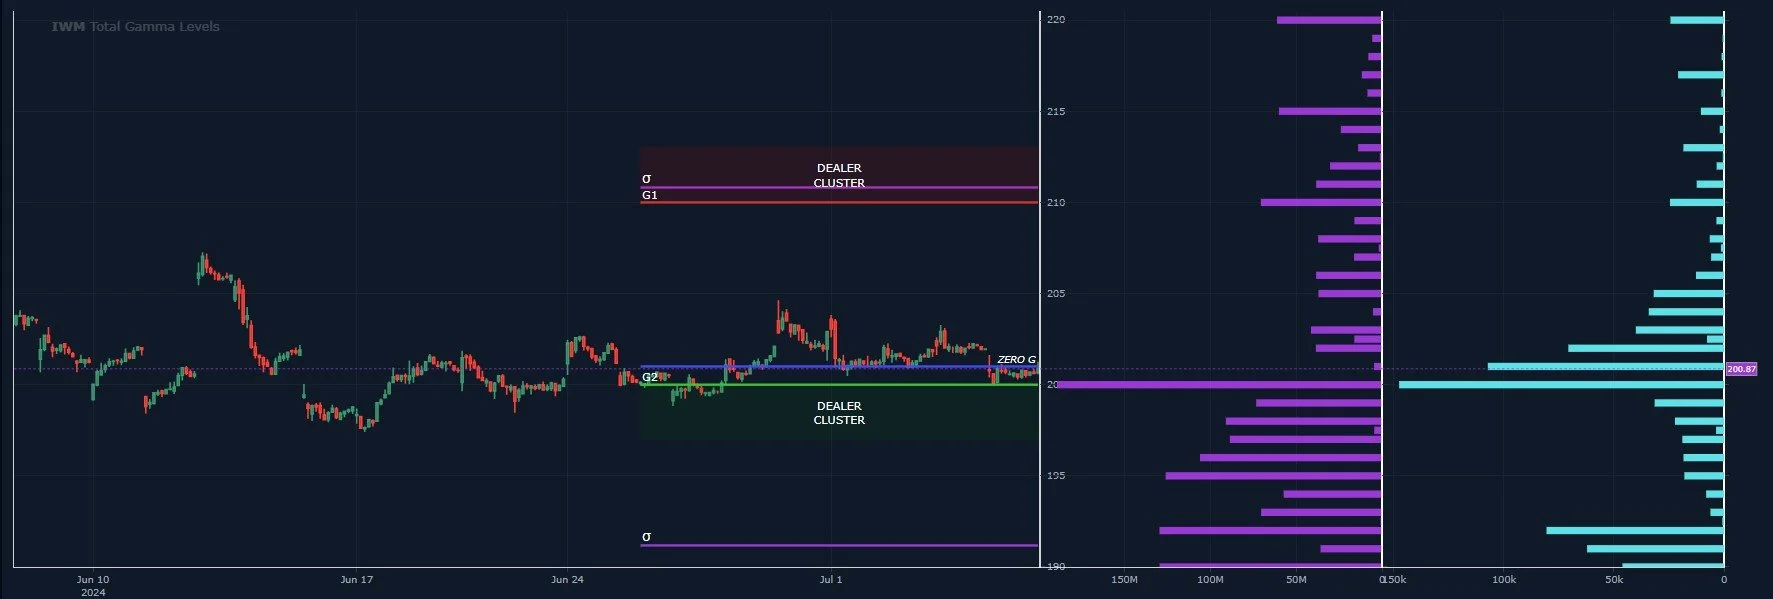
IWM is still maintaining the rotational comic relief, where SPX/SPY and QQQ can go up as long as IWM goes down. IWM has only briefly shown positive GEX recently, but even today’s negative reading is within the neutral range. I can draw a line showing that it’s holding some potential support, even though I don’t like that it’s below the Hull Moving Average. Forgive the trendline being drawn from the bottom of the first candle wick to the lower body of the candle to the right, I know that’s a no-no for religious candle practicioners.

IWM is also right at the top of what the current GEX positioning shows to be a Dealer Cluster Zone that might see some buying, though I see the light blue volume bars indicating options trading at lower strikes. Those trades could be bearish, but they could also be smart traders selling puts, we don’t know from that data point alone. Either way, IWM appears to have at least the potential to do better looking ahead, and with recent history as our guide, it might be in the face of SPX and QQQ declining to some extent. They can’t be treated as one and the same, that’s for sure.
What are we watching this week?
Economic data is pretty light until Thursday and Friday, when we will have some important data points like CPI on Thursday and PPI Friday. But we do have Powell speaking Tuesday and Wednesday as he testifies in front of Congress, which always carries some potential for volatility.
We’ve seen a number of VIX/VVIX negative correlation days or both being up when the market is up, which is a warning sign for market bulls short to mid-term (it’s not a precise timing indicator), and we pointed out SPX’s extreme GEX reading while we are in a Dealer Cluster Zone as well, so negative signals are starting to add up. We don’t have a trigger to signal the correction is here yet, but it can start at any time and we think hedging is prudent for those with long exposure. We’ve practiced what we preach in the Educational Portfolio, taking some profits last week while maintaining our hedges.