
Compression Continues: Break Up Or Down?
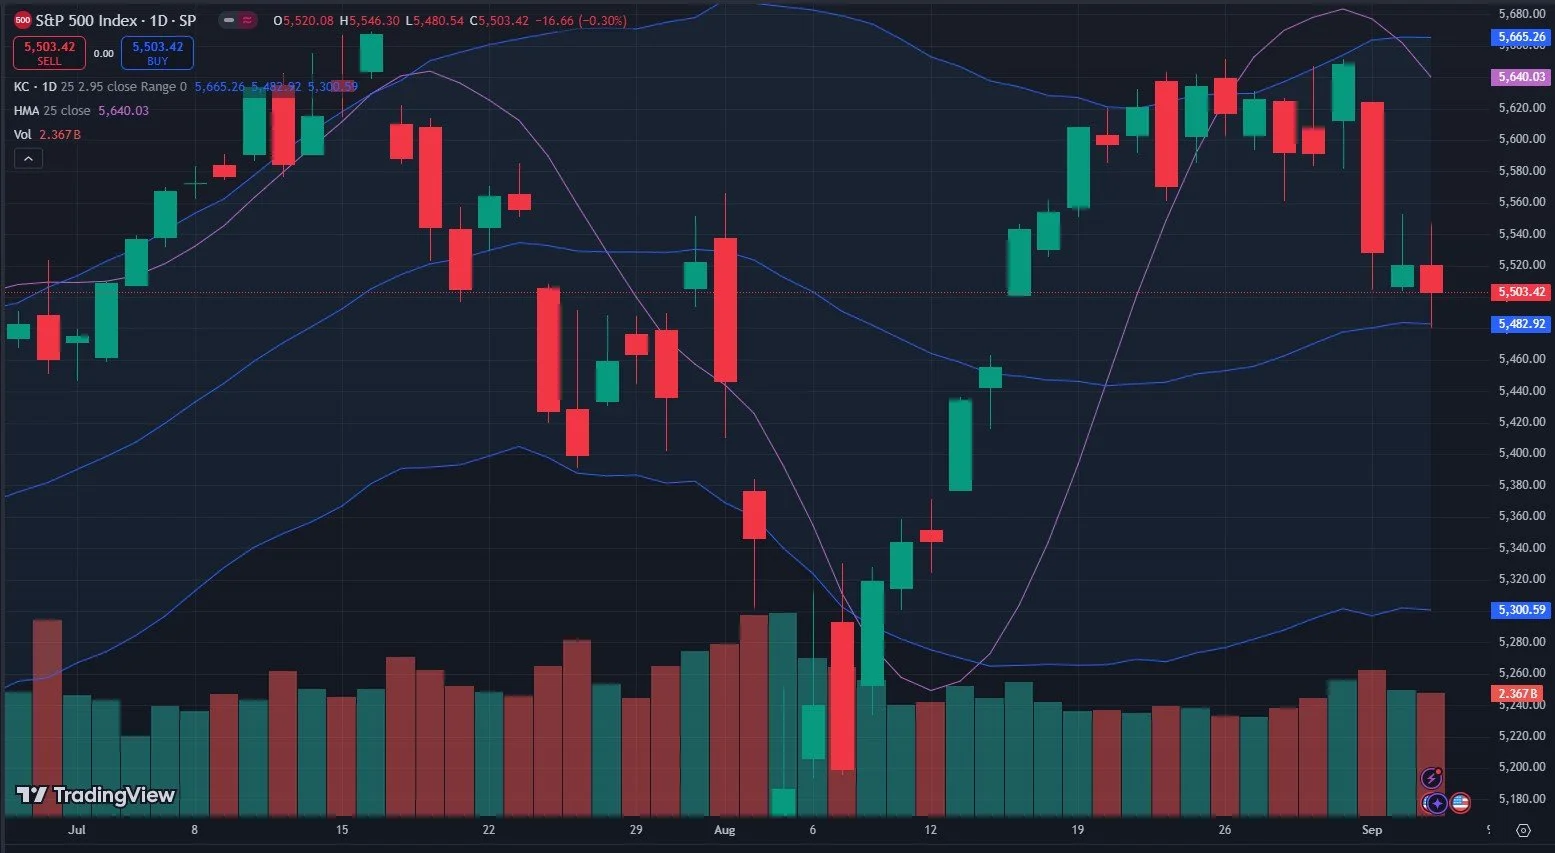
In yesterday’s newsletter, we gave the slight edge to the bears in the short term, and today the S&P finally tagged the 5480 we were looking for yesterday, bouncing almost perfectly off of the middle Keltner channel. Notably, we see a lower high and a lower low, which is not a good look, though overall we are dealing with a market that has apparently been awaiting the big jobs number that we’ll see at 8:30 AM ET before the next volatility trigger takes hold, whether up or down from here.
Looking strictly at the chart below (not the only set of considerations, though), SPX holding below 5482 opens the door to potentially working our way down to 5300. We’ll look at a few other factors that might influence how confident (or unconfident) we feel about the near-term.
One point scored for the bears today: Gamma (GEX) barely changed, remaining at -553M, and SPY GEX was even worse at -1.69B. Technically, we consider +1B or -1B to be the boundaries for strong positive or negative GEX environments, so we have two different readings on SPY versus SPX.
A contrarian take is that SPX tends to reflect the actions of more sophisticated traders, since SPX trades via options on an index as opposed to the SPY ETF that your mom, your Uber driver (no offense to these fine barons of transportation!), and your younger brother who became rich from a now defunct crypto coin sling around, so SPY may be reflecting very pessimistic retail traders instead of the will of the “pros.” I can certainly think of times over the last 18 months where SPX gave a very different signal than SPY, and SPX ended up being the right one. So we’ll see.
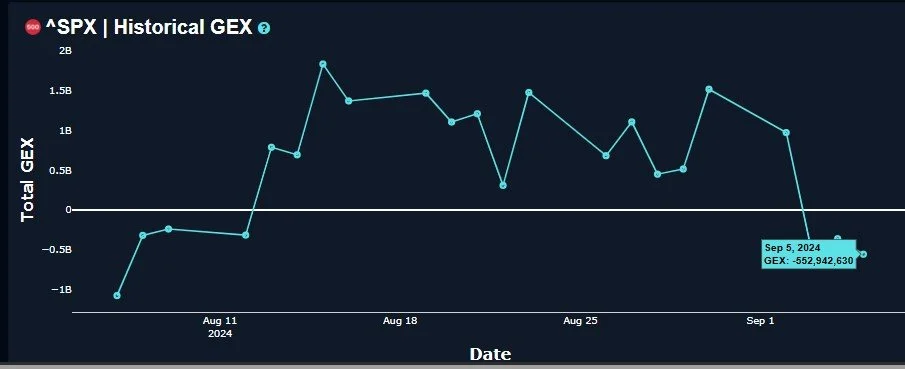
SPX Historical GEX: www.geeksoffinance.com
Looking at Dealer Cluster Zones, which do change from day to day (some days more dramatically than other days), SPX should give bears pause on account of being near the top edge of a zone where dealers may be buyers or cover shorts, based on GEX, at least. This zone does stretch down to 5400 or so, thus we cannot assume that even IF SPX is correct, the drop stops here. Room exists to the downside, if the market so chooses to scare bulls deeper into the box.

SPX GEX Levels: www.geeksoffinance.com
Going along with the more bearish GEX view on SPY relative to SPX, SPY’s Dealer Cluster Zone doesn’t even start until 540, which is the bottom edge of SPX. Since we know logically that SPY and SPX price movement will follow each other, which one is right? If I look for consensus, because hey, I’m a bull/bear peacemaker (wait- would that be a premium killer? Nevermind), I’m probably not wanting to be too greedy if we do drop into the box. SPX 5400 or so would be the area of overlap.
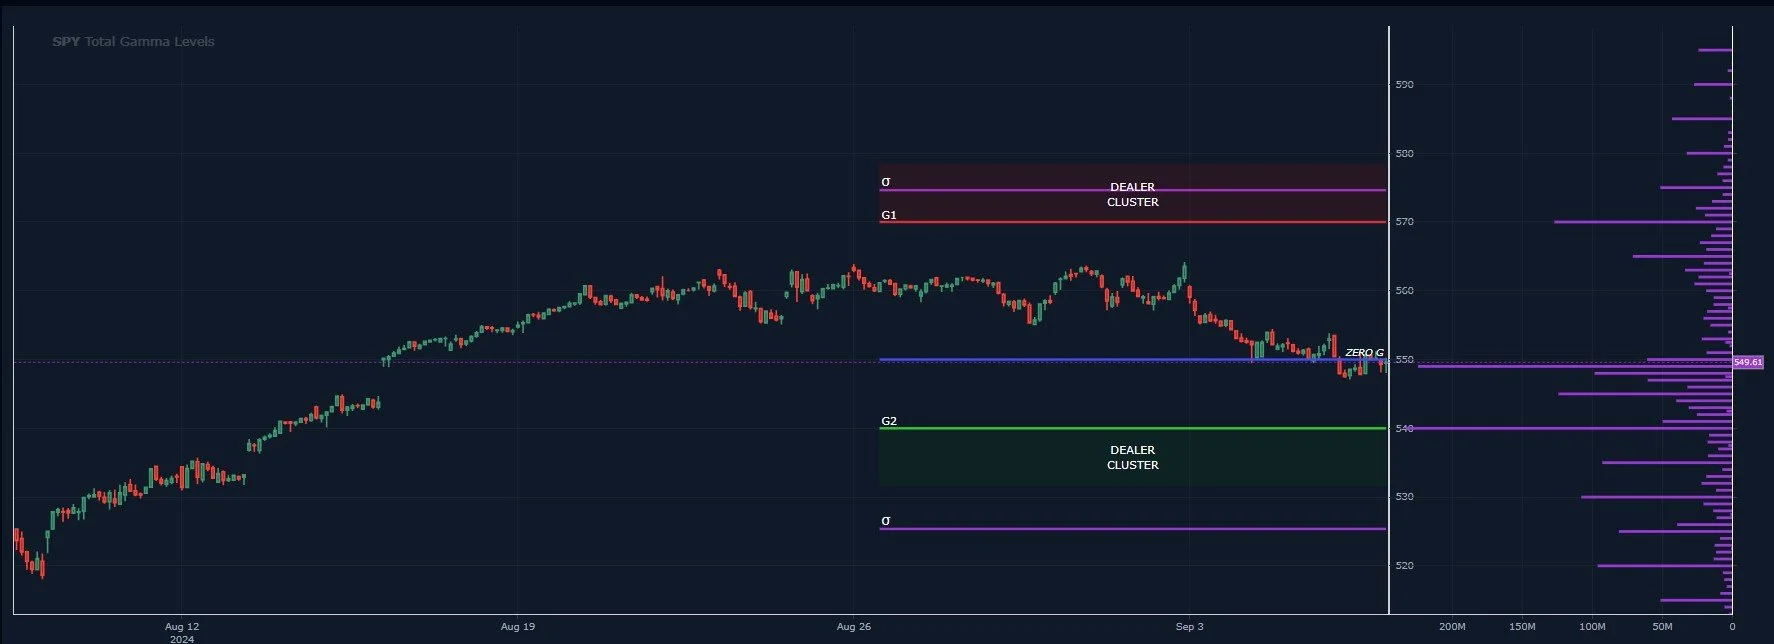
SPY GEX Levels: www.geeksoffinance.com
Given that the top holdings of SPY, SPX, and QQQ all have significant overlap of roughly 80%, can we glean anything by glancing at QQQ’s chart? Don’t worry, it’s clear as mud as well.
One one hand, if we look at the daily chart with daily Keltner settings, I see two bearish wicks right at the middle Keltner channel, potentially indicating eager sellers that do NOT want to hold over 463. Holding below the middle Keltner “should (in theory)” portend an eventual trip down to 440, which also matches with a big GEX level that I won’t display tonight. But I notice today’s candle managed to print a higher low and a higher high…Ok, thanks for introducing doubt.
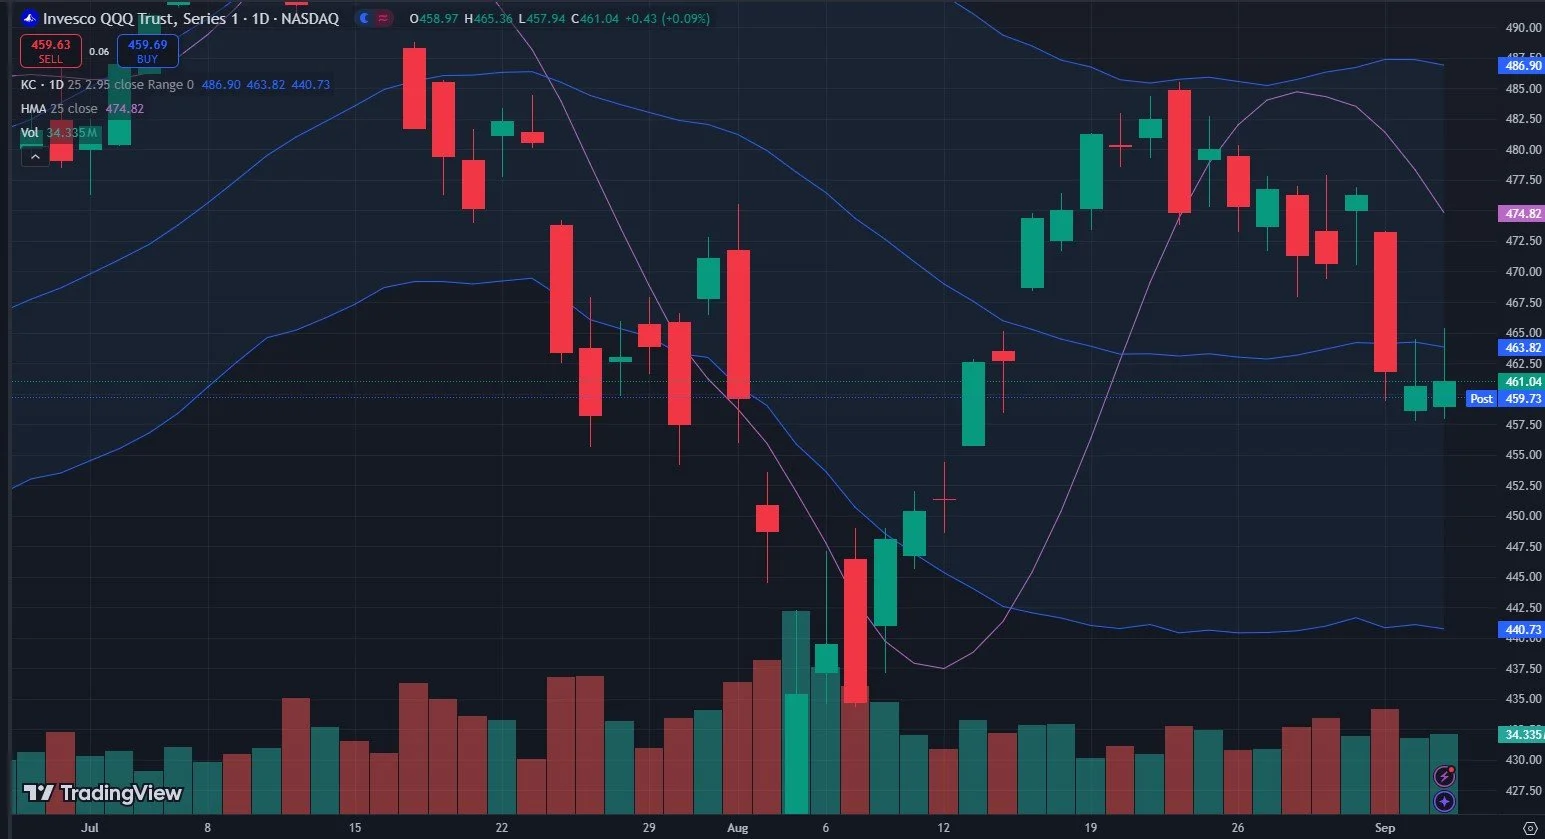
Oh great, here we go. I just HAD to keep looking around instead of sticking to a bias. Changing my Keltner settings to weekly, but the chart itself still reflecting daily candles, I see QQQ is still holding the middle Keltner channel, similar to SPX on the daily as shown previously.
What about QQQ GEX? Overall, it looks fairly bearish at -478.6M, but 2/3 of that is same day expiry. Exclude that and you’re left with just about as neutral a picture as we see on SPX. I think the term “gamed” comes to mind, for some unknown reason.

I Feel Like I’ve Wasted My Time. Can You Just Click the Mouse for Me, “BUY/SELL”?
Sorry, no can do. But we can still look at other factors that might contribute toward possible conclusions about the markets next move. Since a market rally or drop implies that volatility will also shift, let’s look at the VIX to see if we can spot any clues that might tilt our bias in one direction or another in the immediate future.
We’ve seen a historic VIX spike, followed by a historic VIX collapse, then another mini-spike, and now we’ve consolidated lower for a couple of days in what looks like more of a bull flag than anything. Notice we’re above the Hull Moving Average (which I consider bullish for volatility) and we’re also holding above the middle Keltner channel. The chart seems to imply a wider range for the VIX going forward, based on the Keltner limits at 10 and 28.5.

Furthermore, a contrarian bullish signal was created by the recent spike and drop in the VIX, with our GEX-Weighted Volatility Gauge measuring implied volatility at one of the lowest levels over the last year. Dropping to zero implies a likelihood of eventually climbing to some non-zero level, to share a very insightful conclusion reached after years of climbing the breathtaking mountains of Colorado while grasping an old copy of a book written by Confucius.
In summary, a drop to as low as 16.5 for the VIX still leaves open a possible big spike to 30 or higher, so we need to keep an eye on where any potential SPX or QQQ rally might take the markets at the point where the VIX is at that Hull support level. It’s well within reason to expect that a short-term oversold QQQ might retest the Hull just over 470 before resuming a slide to lower levels. This is getting quite granular, so the big picture is that we are in a downtrend since mid- to late-August and we don’t need to be the hero attempting to bottom tick the market.
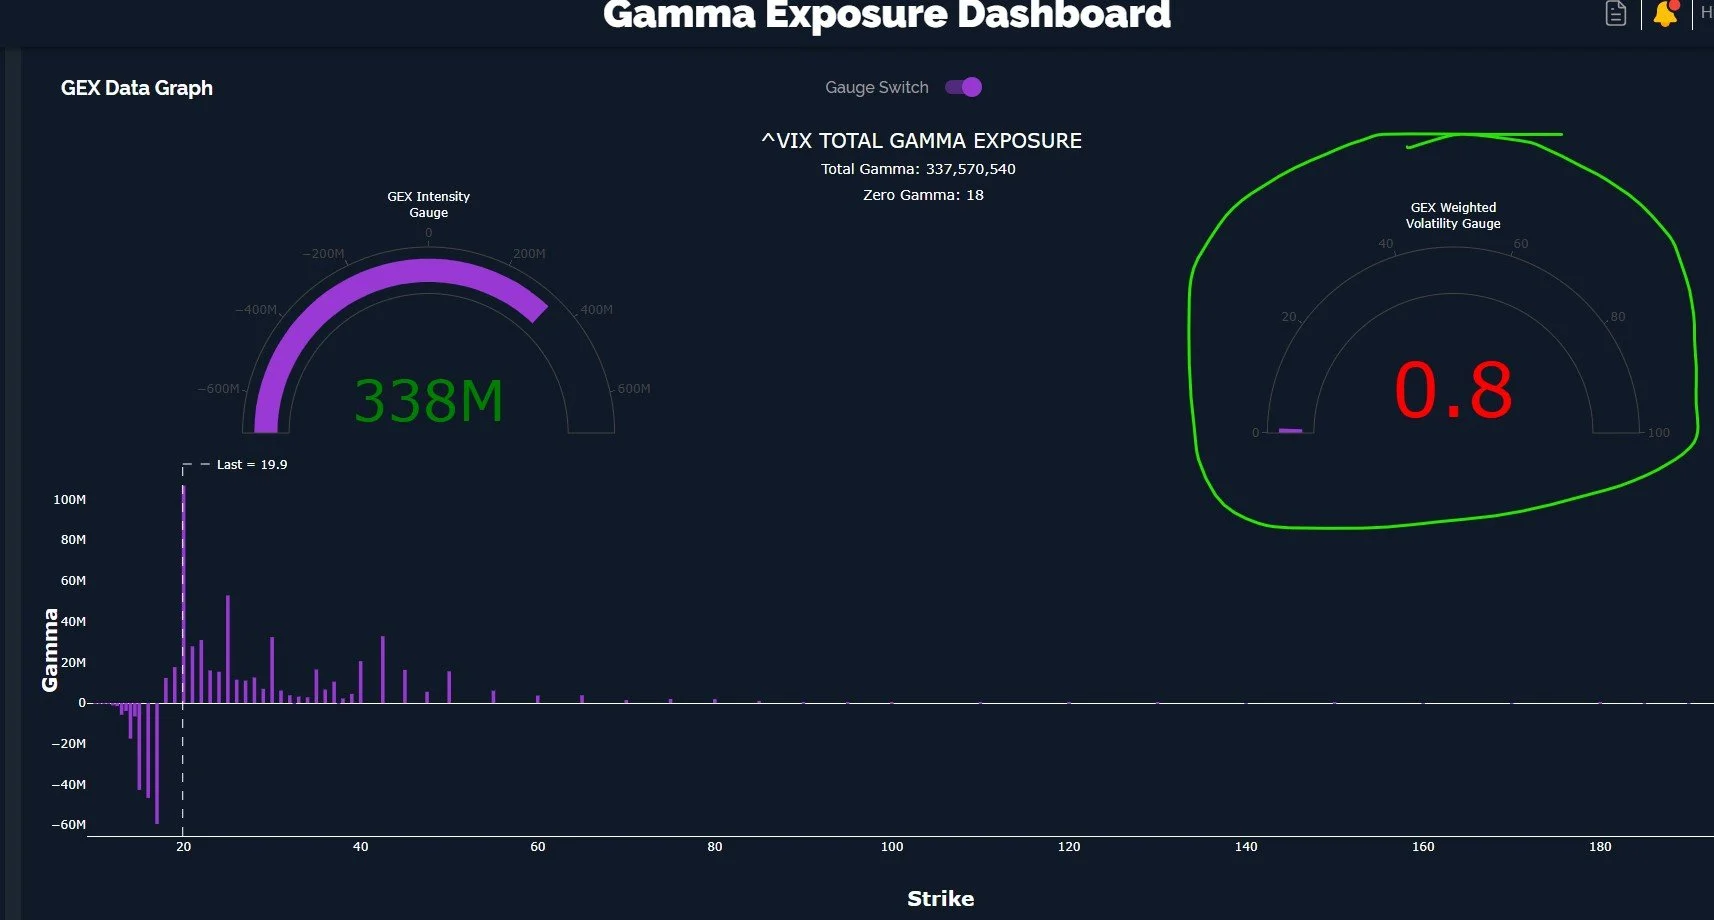
VIX GEX Data Graph: www.geeksoffinance.com
One last comment on the commodity sector, specifically oil: USO has been in a downtrend since the beginning of July, and the latest move lower has been quite sharp. Currently, USO’s price rests below the lower Keltner channel and the channel itself is in a downtrend.

Interestingly, it appears that we are flirting with the launchpad zone where we saw price rally in June, and (as shown below) USO has positive GEX with a big strike at 78 concentrated on September 20. Could we potentially see a 10%+ relief rally for oil? With positive GEX (though close to zero) and a very large GEX cluster at 78, I’ll definitely be refilling my tank sooner than later.
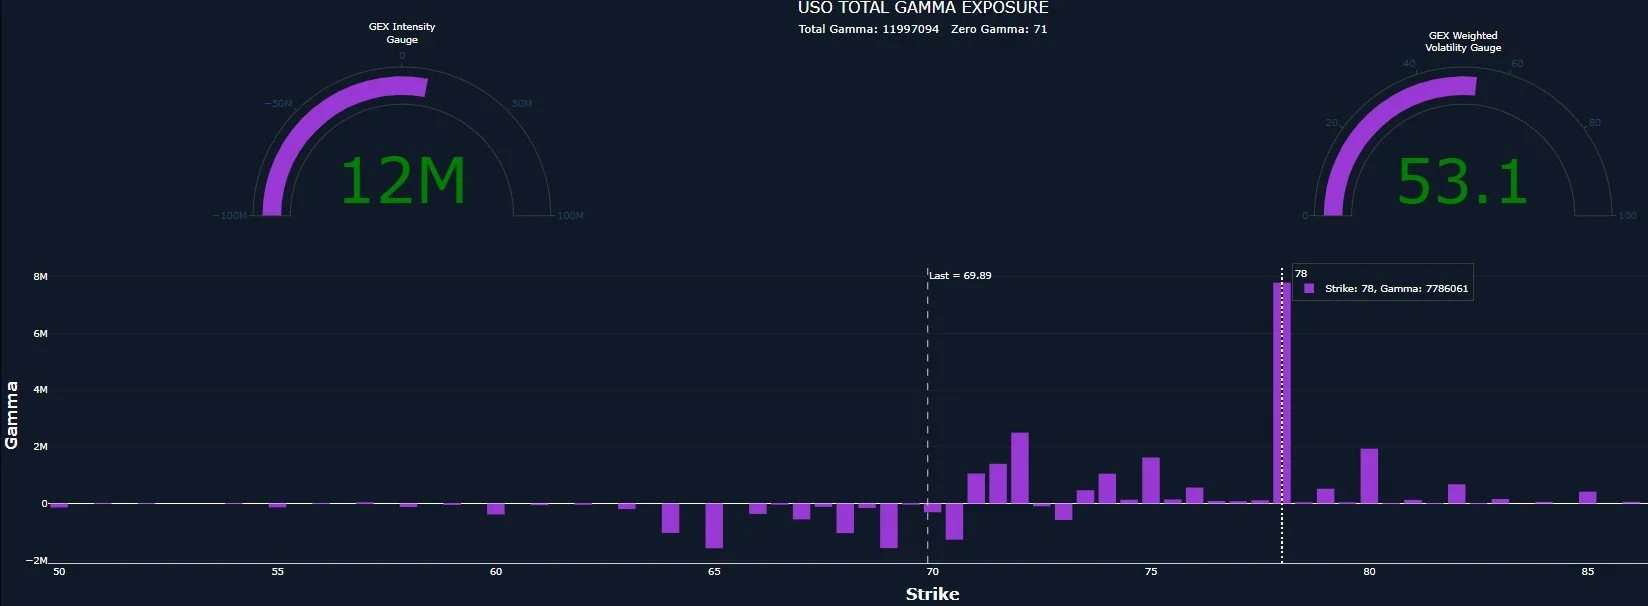
USO GEX Data Graph: www.geeksoffinance.com
If you’re interested in learning more about our strategy approach, we address all of these topics in our Geek University course which is included in all memberships.
If you’re interested in accessing our tools and analytics, be sure to check out our website!
Thanks for being part of our community and know that we invite your feedback!
We have a variety of educational videos on YouTube as well!
The information provided by Geeks of Finance LLC is for educational purposes only and is not intended to be, nor should be construed as, an offer, recommendation or solicitation to buy or sell any security or instrument or to participate in any transaction or activity. Please view our Investment Adviser Disclaimer and Risk Disclosure.