
Seeking Order Amidst Chaos: Daily Or Weekly Timeframes?
REMINDER: $300 OFF THE ANNUAL PM SUBSCRIPTION ENDS SOON! ENTER SUMMER2024 AT CHECKOUT TO RECEIVE THE DISCOUNT! ONE More Subscription Available This Round!
Geek’s Daily Review: Tuesday, August 6
This morning in our Discord channel at 10:33AM ET, we pointed out what stood out to us after glancing at our gamma (GEX) 0 DTE Flow chart on our website (link below the image, which is the exact image with notes that we posted). In the face of pressure across the board, the 530 and 5320 strikes for SPY and SPX respectively were seeing some strong positive flow. We were vindicated with a nice move from 423 SPY to the day’s high of 429.75 SPY, a nearly perfect fulfillment of what had been hinted by GEX. Futures have since retraced quite a bit in the face of some semi earnings reports and perhaps for other reasons I don’t yet see.
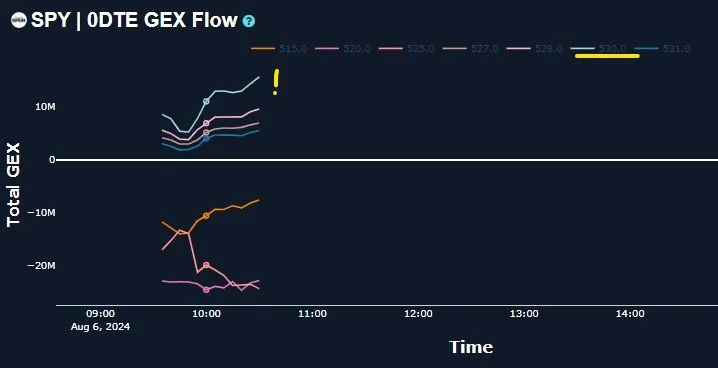
0 DTE GEX Flow- www.geeksoffinance.com
The daily chart for QQQ and SPY show sharp overshoots to the downside, below the lower Keltner channel, and of course we saw the VIX spike to 66. I prefer to find borders and guidelines that give a sense of order to chaos, so what potential indicators give us some sort of possible boundaries for support and resistance? When the daily charts fail, which usually happens when we’re seeing statistically unusual moves of great magnitude, we can sometimes look to weekly charts for larger timeframe areas to watch.
Why look to charts if GEX is so great? As demonstrated with the first point in today’s newsletter, GEX has been mostly working great for us on an intraday basis, which is nice if you wake up and want to look for a trading opportunity after the market is open. We also see actionable GEX targets with certain tickers on a weekly or monthly timeframe, narrowed down using our 3D charts. But if you’re holding a trade overnight, you might want to have some sort of gameplan in mind, and sometimes the big indices aren’t always clear in showing their intent with GEX over longer timelines lately. But GEX can certainly help (in conjunction with other factors) in narrowing down possibilities and improving your overall odds of success.
Let’s look at SPY first, which still shows negative total GEX, despite the cash session buying we’ve seen the last two days. Note the large candle wicks overhead, showing some interest in selling from the days’ highs. SPY came fairly close to the Hull Moving Average line, which might be a target to watch (534 area). The nice thing is that we can look forward to getting some clues from the GEX structure once we get into tomorrow’s session.
Since the daily Keltners don’t give us any actionable levels below, I switched to the weekly chart (still showing daily price candles), which starts to form a potential picture of a trip down to the 497-500 area, which makes a lot of sense to me. This is but one of several possibilities, so I will keep an open mind.
In the Geek’s Educational Portfolio, we initiated an SMH short alongside our existing IWM long established yesterday, so we are prepared for either direction with asymmetric outcomes possible on either trade (those aren’t our only two positions, though).

QQQ has even better symmetry on a weekly timeframe, almost perfectly testing that Hull Moving Average from below and rejecting the level. Is it that easy? Given that SPY and QQQ are slightly different, despite both having 80% overalp on the top 10 holdings, I wouldn’t be surprised that a continued downturn might not resume until SPY reaches 534, likely causing QQQ to overshoot the Hull before giving us another big candle wick. This might not happen, but I can dream..Ultimately, we have to follow the market to survive, a potentially valid idea doesn’t make money by itself.
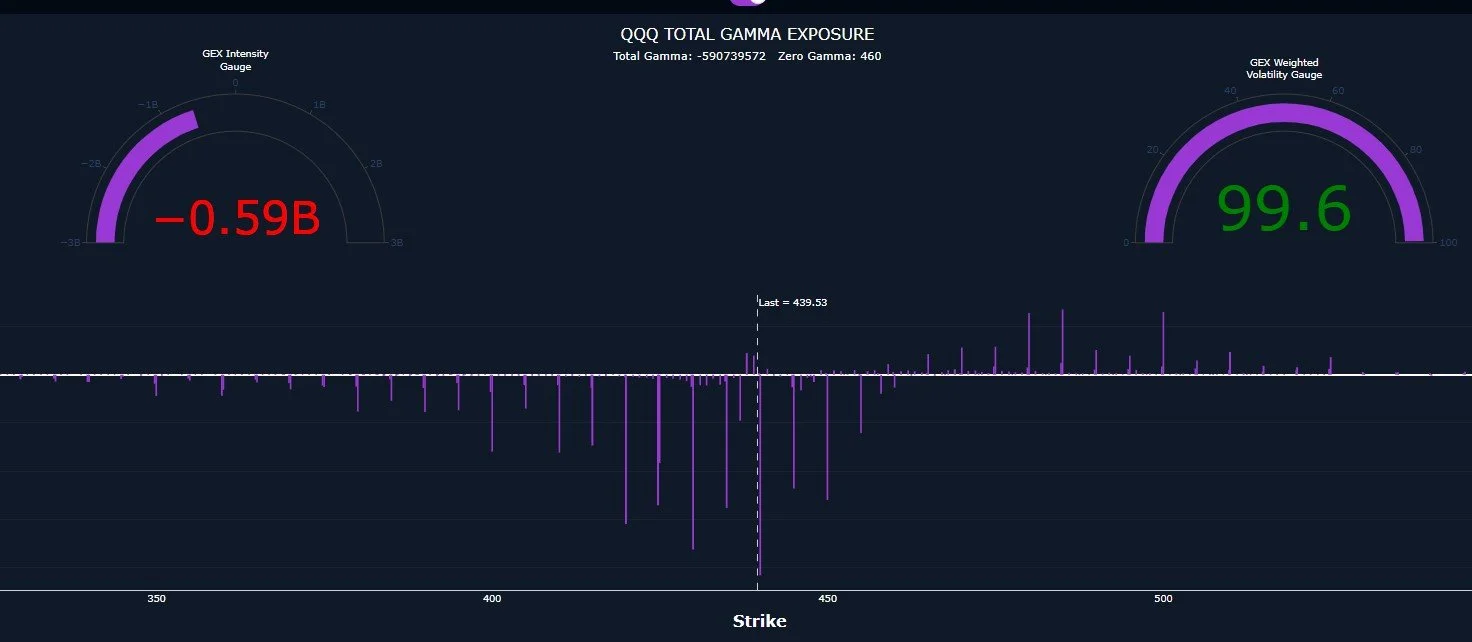
417-420 is an area to watch if QQQ continues to the downside.

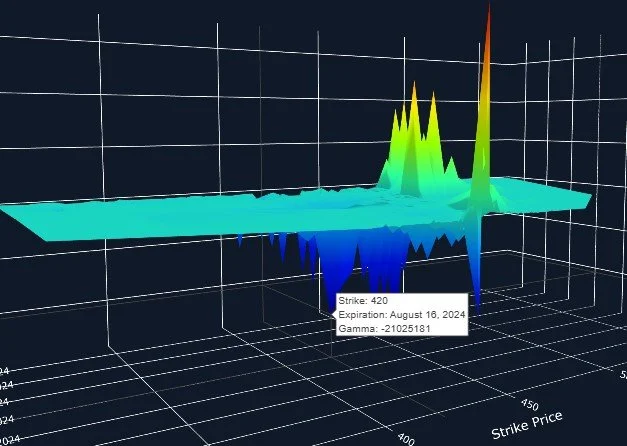
420 also shows up as the last of the larger negative GEX clusters looking at our GEX data graph, and I notice on the 3D chart below, we see August 16 is a date with a large expiring cluster of that 420 strike. There are some positive clusters for August 16 too, but there’s a good argument for the weekly downside target to be reached by then.
IWM’s daily chart (and DIA, for that matter) have held up fairly well so far, so perhaps we can still look at IWM’s daily chart as a guide in a more bullish scenario for the market short term. But IWM also has negative GEX, so if I expand my horizons to including more than just a chart in making decisions (a-la GEX), I am less inclined to take too much comfort in seeing a theoretical line holding up.

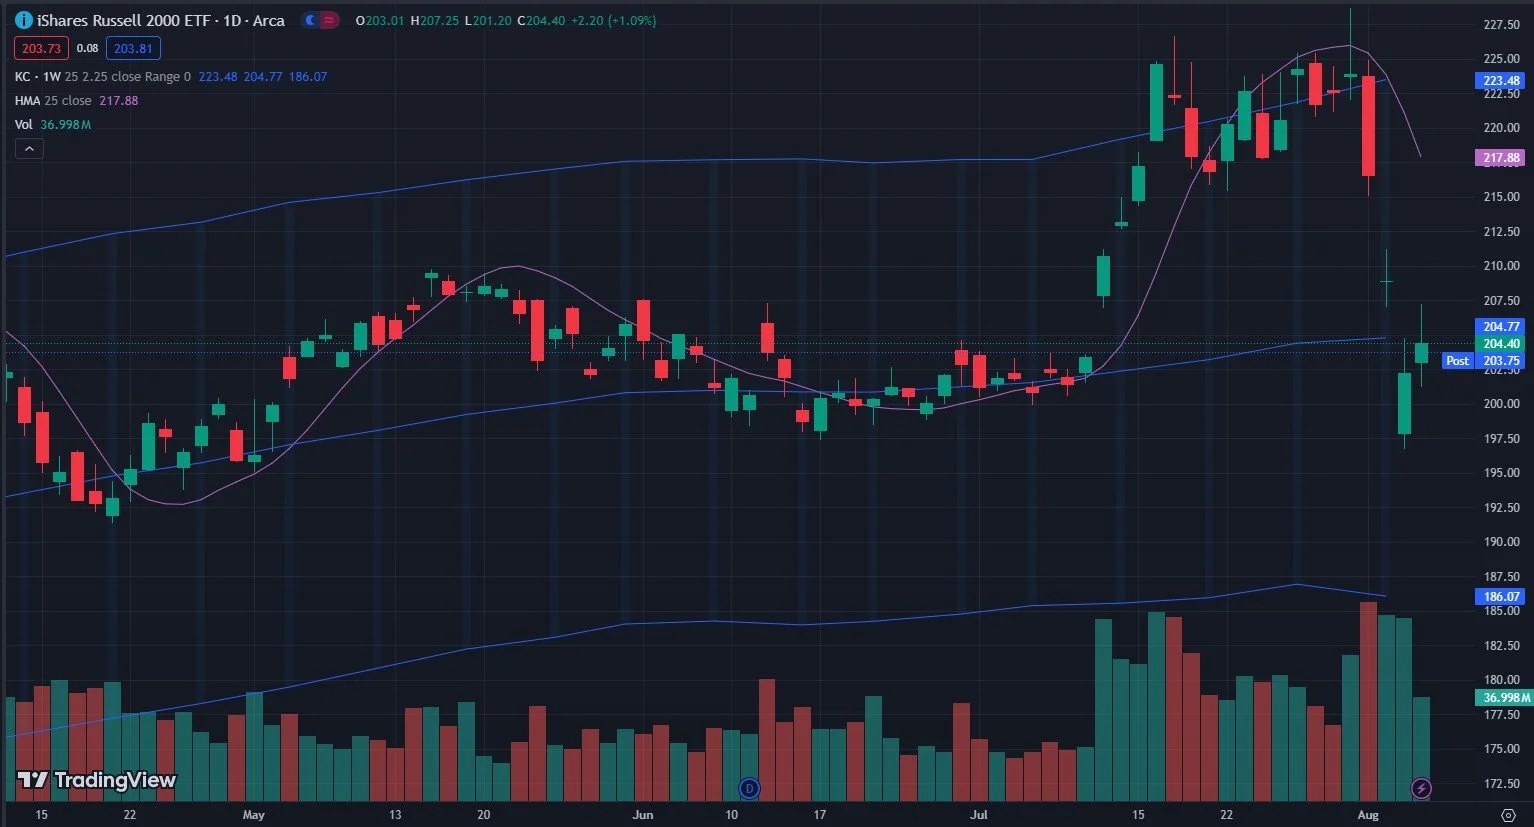
So let’s zoom out and look at the weekly chart for IWM: Wrestling with the middle Keltner channel, appearing to have failed the first attempt over the line. And below, 186 looms as a potential downside target. 186 is interesting, because for months, we saw 185-190 as a busy area. This might also end up being a good spot for longs, if we can make it to that level. I won’t hold my breath, but at least if we begin to head lower, I’ll have a target to watch.
What Do We Expect Heading Into Wednesday, August 7?
We have the possibility of the weekly charts emerging as the drivers behind where we are headed next, but we need the market to make up its mind in this pivotal spot. Don’t get caught playing in traffic, it’s better to wait for the course to be set, or at least wait for a more “extreme” high or low to be reached in order to take risk, at least that’s how we look at it for ourselves. At least the elevated VIX has given traders big moves intraday…Volatility equals opportunity!
If you’re interested in learning more, we address all of these topics in our Geek University course which is included in all memberships.
We also invite you to check out our community discord for our latest market conversations and trade idea discussions.
If you’re interested in accessing to our tools and analytics, be sure to check out our website!
Thanks for being part of our community and know that we invite your feedback!
We have a variety of educational videos on YouTube as well!