
Jackson Hole-y Market Close!
Geek’s Daily Review: Monday, August 19
Gamma (GEX) told us early today that our bias was likely higher, with 5580 as the initial SPX target based on zero days to expiration (0 DTE) GEX. Our Dashboard allows isolation of 0 DTE, weekly, and total timeframes currently, with all of them showing up on our 3D graph as well. We saw a huge move a few minutes prior to the close and through the close itself, rocketing SPX to over 5600, presumably tripping short stops as well. This was on the heels of two solid weeks of green off the lows, too. Hopefully these extreme moves have been your friend as we look to take advantage of volatility.
The chart below is incredible, showing a blistering move higher from the gap down low August 5. If we want to consider open gaps, one that seems pretty obvious is the SPX July 16 low of 5639. With the current upper Keltner channel on SPX of 5627, reaching that gap would imply an overshoot of the top channel. entirely possible and within the Dealer Cluster Zone spanning 5610-5800. 31 points higher from today’s close and we are there.
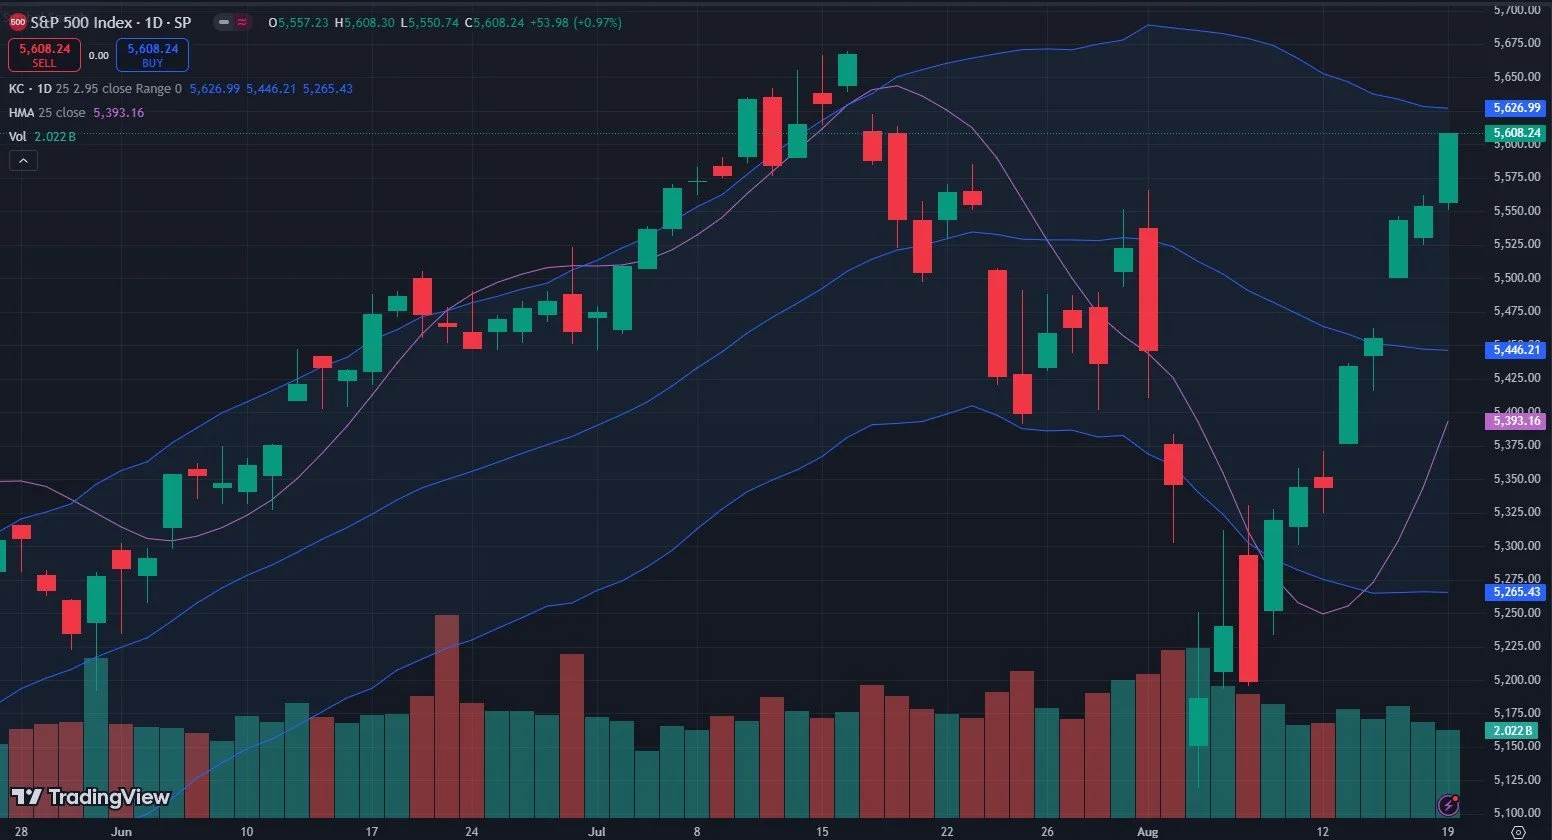
Today's SPX chart courtesy of TradingView.
While shorts have likely been decimated with the move higher, including the big green spike candle right at the close today, we do see some negative divergences worth watching. For instance, our SPX Historical GEX chart shows a 20% reduction in total GEX for SPX. For context, we are still very positive at over $1B, so this discrepancy alone is not a sole reason to go all-in short, in our humble opinion. But you can interpret this as you wish, we wanted to bring it to your attention for your own consideration.

SPX GEX Historical Chart-www.geeksoffinance.com
Let’s briefly look at QQQ, which has a lot of similarities to SPX, so no need to repeat ourselves on all of the points. We filled the July 23 gap at 480.14. Next up is 493 from July 16. Call me skeptical of a straight line move to that one, but I’m always skeptical, so that doesn’t mean too much.
The upper Keltner at 486.75 seems plausible as a target if we continue to rise. Perhaps this may be close to where QQQ tops if SPX can climb that additional 31 points to close the gap? Time will tell, and I doubt we’ll have to wait long.

QQQ Chart- TradingView
The historical GEX on QQQ gives us a more dramatic change than SPX, with GEX barely half of where it was last week at its high. So we have price diverging to the upside while the market is technically positioned LESS bullish than last week. Call me crazy, but I don’t see this as a positive for bulls beyond the very short term, and maybe not even then.

QQQ Historical GEX Chart- www.geeksoffinance.com
IWM also caught my attention, closing a mere 0.14 above the August 1 low. Another gap filled, and just above the middle Keltner Channel on the daily chart.

IWM- TradingView
IWM’s Dealer Cluster Zone sits at 220 after moving up post-close today. The huge option volume at 203 in light blue caught my attention. We noticed option volume at lower strikes was a good precursor to a drop on more than one occasion with IWM. But not necessarily the immediate day after, it might take some time to materialize.

GEX Levels Chart- Geeks Of Finance
IWM has its own divergence issues as well, such as the inability to hold positive GEX since late July. We are right on the zero line, so the next move probably determines which way IWM goes next in the short run.

IWM Historical GEX- www.geeksoffinance.com
What Do We Expect Heading Into Tuesday And The Rest of The Week?
The “fun” this week likely begins Wednesday as we see a 20-year bond auction and the release of the FOMC minutes.
Powell will be in focus Thursday and Friday with his Jackson Hole appearance, which the market seems to be prematurely celebrating. Or maybe it’s not Powell, since we do have a number of important economic data points coming Thursday and Friday, including PMI, Existing Home Sales, and New Home Sales. Oftentimes, we see big events like we’re seeing this week coincide with the market reaching a likely area where a pivot may occur, and with bears going extinct (again), I hate to start new long trades in the broader indices, but that’s just me.
We’ll continue to take it one day at a time in Discord, so join us for our discussion throughout the day.

Events calendar from Econoday.com
We invite you to check out our community discord for our latest market conversations and trade idea discussions around the more immediate picture presented by GEX.
If you’re interested in accessing to our tools and analytics, be sure to check out our website!
We have a variety of educational videos on YouTube as well! Thanks for being part of our community and know that we invite your feedback.