
Mission Accomplished! Almost…
End Of Summer Subscription Discount! Enter code SEPTEMBER2024 at checkout to receive a big $300 discount on our annual Portfolio Manager-tier subscription! Get access to ALL of our tickers, engage in our chat group with experienced traders, get access to our 5-hour educational course, and also our Trade Ideas channel for our Educational Portfolio! End Q3 with a pledge to give yourself a gamma edge heading into the New Year with the best GEX platform on the market!
Funny how gamma (GEX) '“knew” about the Chinese stimulus announcement days (almost weeks) in advance, patiently waiting at 5750 to be reached as a target. We could devote an entire separate discussion to the chicken and the egg argument, whether news drives stock prices or news acts as a catalyst for a pre-determined target, determined by advance market positioning and maximum pain, just waiting for the right trigger. I know I spend a lot less time anticipating headlines than I used to, and a lot more time studying how the market is positioned via GEX and looking at potential targets on my charts.
The gap up beyond that 5750 cluster expectedly had a tough time sustaining above that level, which is typical once price reaches the red dealer cluster zones, though holding above 5750 would have been a very bullish development, if it had happened.
Instead, we failed to hold it, though cash buyers after the first 30 minutes to an hour did alright if they caught the lows. We closed at 5745 with a big GEX cluster at that level. 5750 shows to still be present for 9/30, but since we tagged it, I am watching VERY closely now to see where the next targets emerge, and where we see GEX growing, whether positive or negative GEX.
Both SPX and QQQ maintain a little room overhead as far as the Keltner channels go, and with this being quarter-end, month-end, as well as a big GEX target, it wouldn’t surprise me to see a little dance back and forth across the 5750 level, maybe even reaching close to 5800 before we see more downside. QQQ 496 seems to be an area to watch.
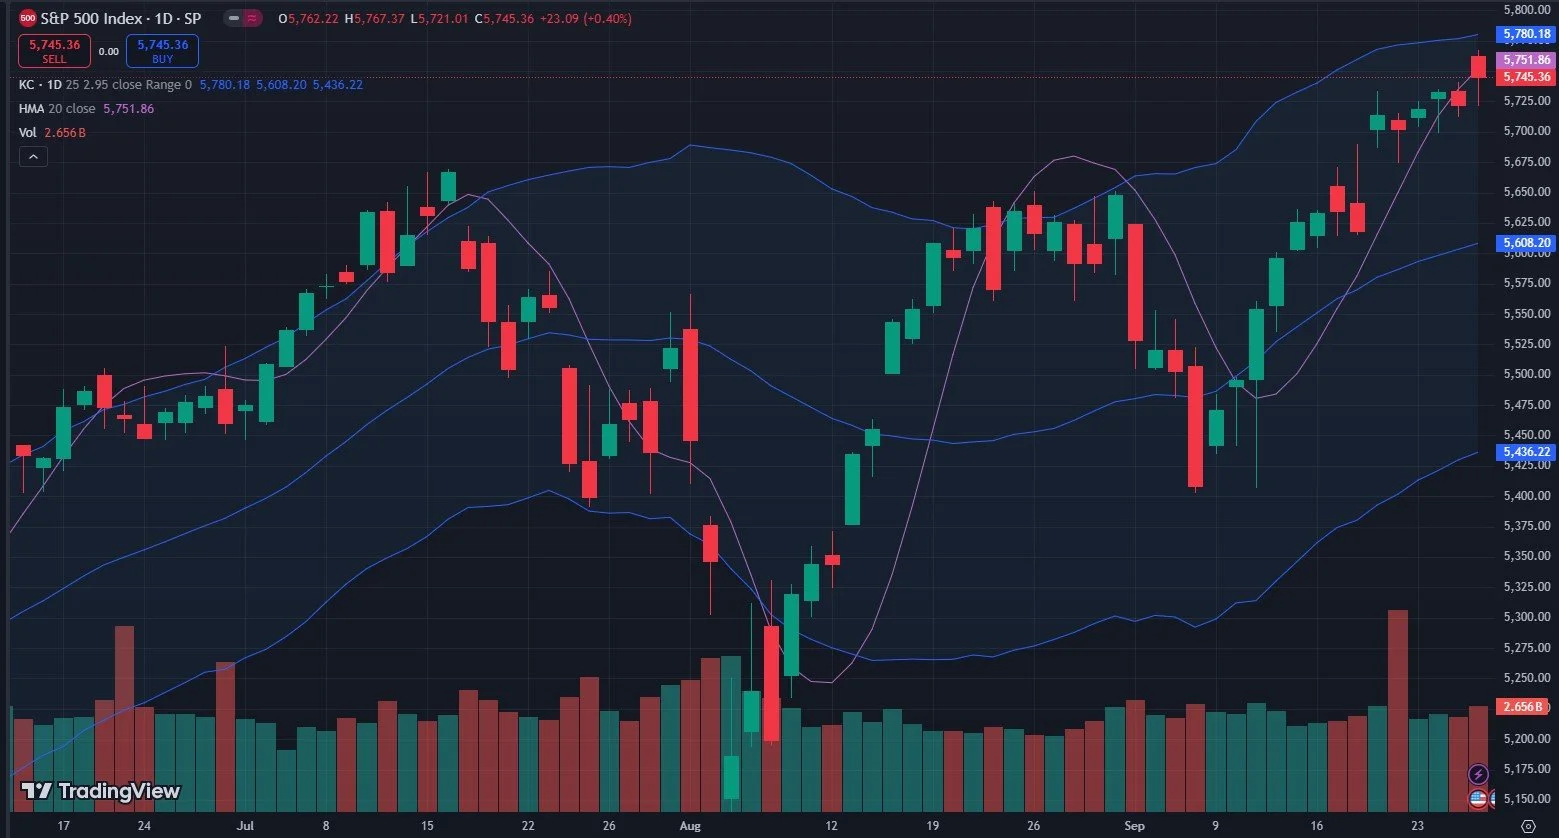
One last note on the chart above: The Hull Moving Average is rising, and when it rises this sharply, it can eventually end up putting price in a position of being below the Hull, especially when other resistance points come into play, like the Keltner channels. I use this occurrence as a sort of guide for my leaning short or long. Now that SPX is below the Hull, I look to short rips more comfortably than buying dips, especially if we push toward 5780 intraday. A close back above the Hull would be a warning to bears to not be too early.
Also, looking at the chart below, we see SPX total GEX actually rising a bit today, it’s still well into bullish territory. We know the 5750 GEX expiring 9/30 is a big part of that, so we are certain to see a big shift of some sort in the next few days as far as the GEX picture goes.
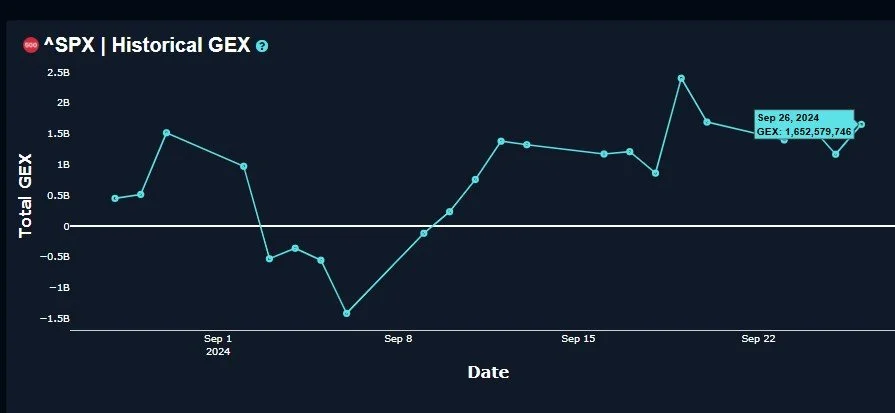
SPX Historical GEX: www.geeksoffinance.com
SPX 3D chart shown below to better visualize the main sources of positive GEX as it currently stands: the 5745 cluster that disappears today, and the 5750 cluster we’ve mentioned a few times.
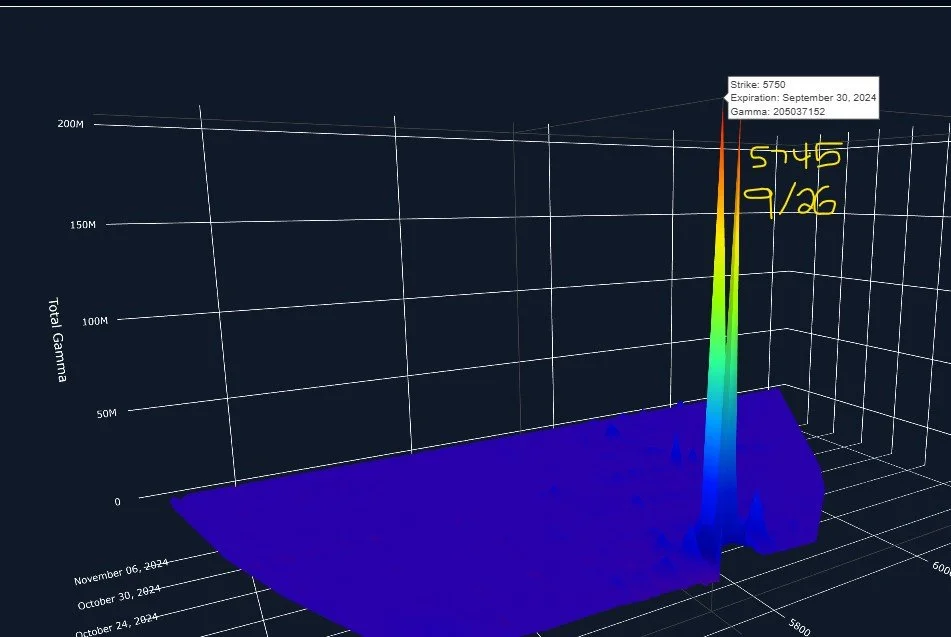
SPX 3D GEX: www.geeksoffinance.com
QQQ reached the upper Keltner, though it still closed above the Hull, and I have slightly different Keltner settings not shown here that give me 496 as a valid target. I have two main settings that I flip between to reflect lower probability and higher probability scenarios.

Both QQQ and SPX are in the red dealer cluster zones, which is where we expect consolidation and possibly a larger selloff, though we can’t speculate exactly how it will play out based strictly on this GEX picture.
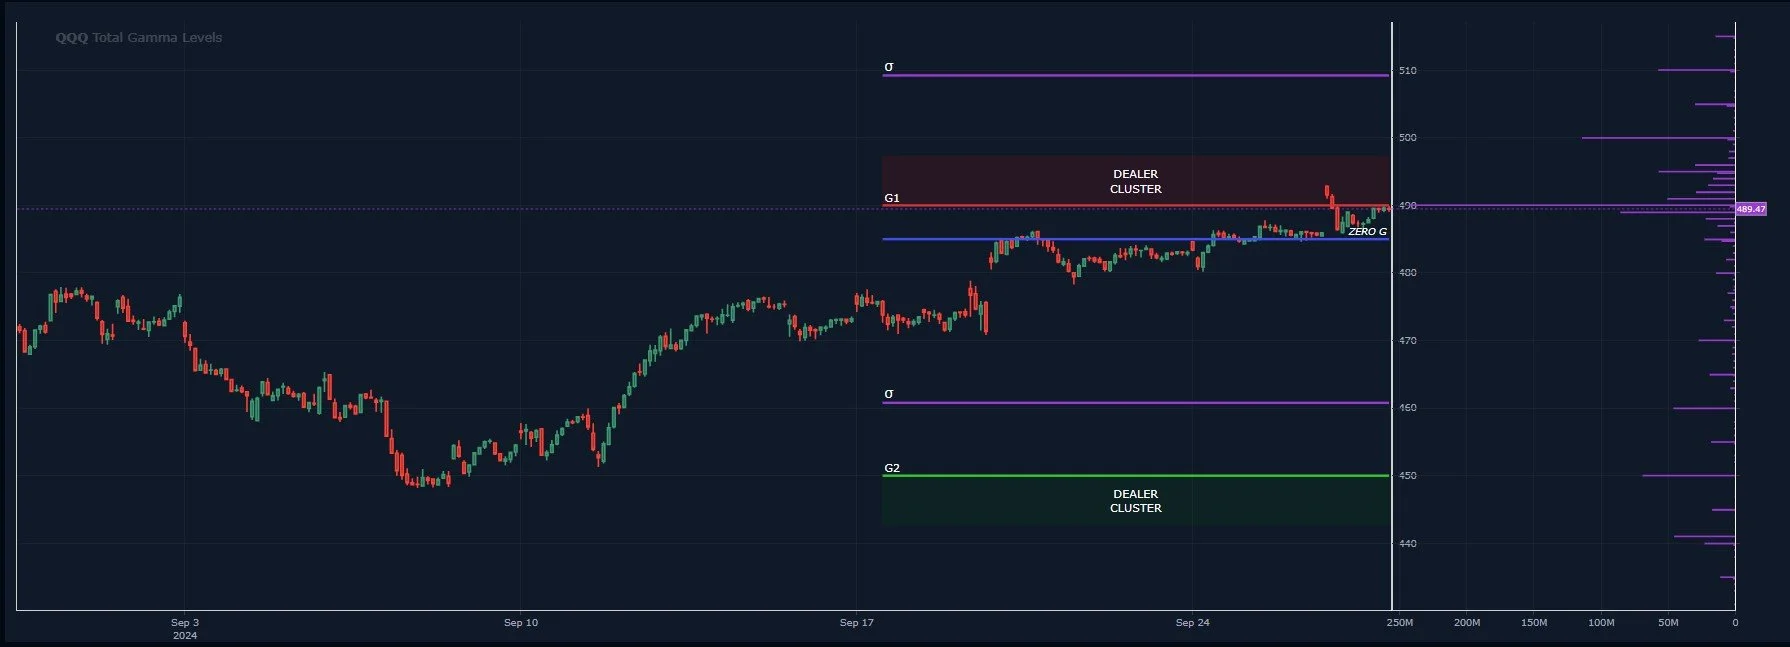
QQQ GEX Levels: www.geeksoffinance.com
QQQ saw a similar uptick in GEX, so we’re still looking fairly positive from that perspective.
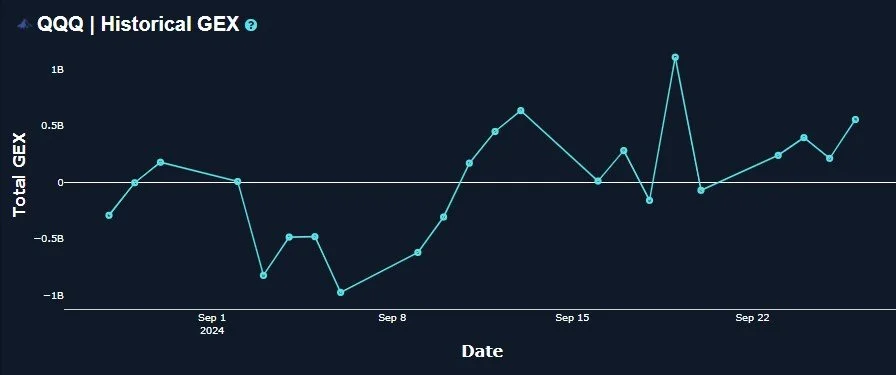
QQQ Historical GEX: www.geeksoffinance.com
IWM has been an interesting animal. We highlighted IWM as a possible play for the long side on the basis that the broader market holds up into Monday. IWM GEX did increase today, and despite the red candle (red because we closed below the gap up open), IWM closed higher than it did yesterday, above the middle Keltner channel. I don’t like that it’s below the Hull, but we’re still right at the zero GEX line, leaving either direction as a possibility. I’d like to see 223-227 as one last gasp before a deeper pullback, if the market gods can let that scenario rain down.

Lastly, the sneaky VIX hit 14.90 premarket, which might not show up on some of your charts. But 14.82 was the last update we gave on our lower Keltner target for the VIX. The VIX went green today, climbing until it hit middle Keltner resistance on the 2-hour chart. Volatility appears to be making a bottom and backs the scenario of a market top and pullback in the near future. We hope you’ll join us in Discord where we have a great group of good traders sharing their trades, and we also do our fair share to post intraday developments as we see them, which has helped us to quickly adjust to what appears to be the correct side of the trade many times recently. Thanks for reading!

VIX GEX Levels: www.geeksoffinance.com
If you’re interested in learning more about our strategy approach, we address all of these topics in our Geek University course which is included in all memberships.
If you’re interested in accessing our tools and analytics, be sure to check out our website!
Thanks for being part of our community and know that we invite your feedback!
We recently posted a YouTube video and we have many short videos for you to review where we cover a variety of predictions and educational topics.
The information provided by Geeks of Finance LLC is for educational purposes only and is not intended to be, nor should be construed as, an offer, recommendation or solicitation to buy or sell any security or instrument or to participate in any transaction or activity. Please view our Investment Adviser Disclaimer and Risk Disclosure.