
Rally Vindicated-Now What?
Well well, looks like cracking a book of statistics open once a year can pay off. Our example of 9/11 bullish tendencies over 17+ years held true today as well, with early weakness giving way to a short squeeze and a massive 155 point reversal for the S&P intraday. Something for everyone, whether short or long!
Better yet, gamma (GEX) readings early on and throughout the day proved accurate, enabling us to signal to our Discord group the initial drop to approximately 5400 SPX in advance, and then the rally to well over 5500. Even without capturing the exact bottom or top (which some of our subscribers did), plenty of room was left to capture profit in the prevailing directions in the morning and the afternoon after we posted.
We recorded another short YouTube video this afternoon where we discuss the shift in market gamma as well as the VIX and a few stock ideas. You can find this video here.
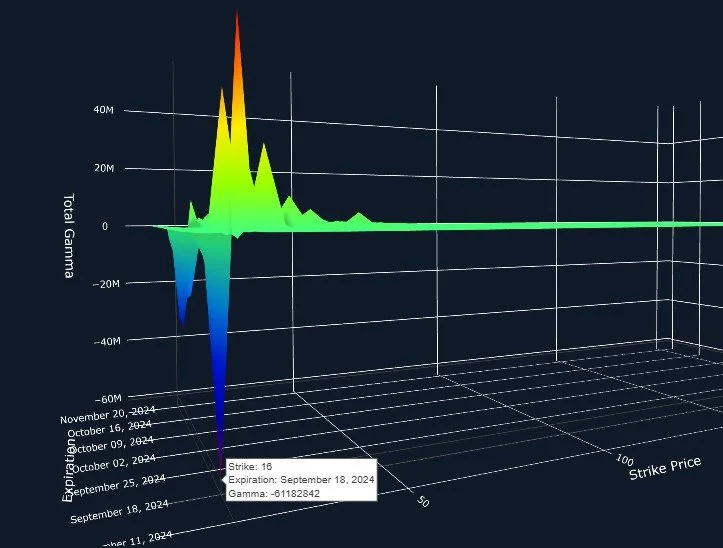
VIX 3D Gamma Graph: www.geeksoffinance.com
Let’s briefly talk about the VIX, which we display in our 3D graph right above this paragraph to show the big negative GEX (also a dealer cluster zone where we might see some buying) at 16. VIX expiration for the month of September is next Wednesday, September 18. VIX expiration, when monthly VIX options expire, is important for a number of reasons, including the significance of short volatility funds in the market over the last decade or so as well as the hedging actions of long investors/traders. Practically speaking, we can look back at historical selloffs and you’ll often find close proximity between the selloff and the date of the VIX options expiring, at least within a few days in many cases.
We see a large negative GEX cluster at VIX 16, and we also see positive clusters at 17 and 20. Let’s look at SPX, DIA, and IWM and then come back to the VIX and tie it all together.

Tying it all together: It's Always Sunny In Philadelphia scene
Alright, a little comic relief. Let’s look at the Dow (DIA), which I’ve felt shows a more clearly bullish setup than SPX, yet presumably the two won’t constantly move counter to one another, though we have seen that phenomenon lately. We had a wild reversal intraday, leaving a long candle wick at the lows near 400, and DIA closed just a hair above the Hull Moving Average, which technically I find bullish. GEX is positive, and the upper Keltner channel points sharply higher toward 420.

DIA Chart: TradingView.com
DIA respected our Dealer Cluster Zones perfectly, bouncing off of the extreme lower boundary and closing at the zero GEX level. As mentioned in our YouTube video, GEX levels can change dynamically as we go along, so we keep an eye on the changes in GEX as well as the absolute daily readings. The upper Dealer Cluster Zone where we would expect potential selling/consolidation ranges from DIA 415-420.

DIA GEX Levels: www.geeksoffinance.com
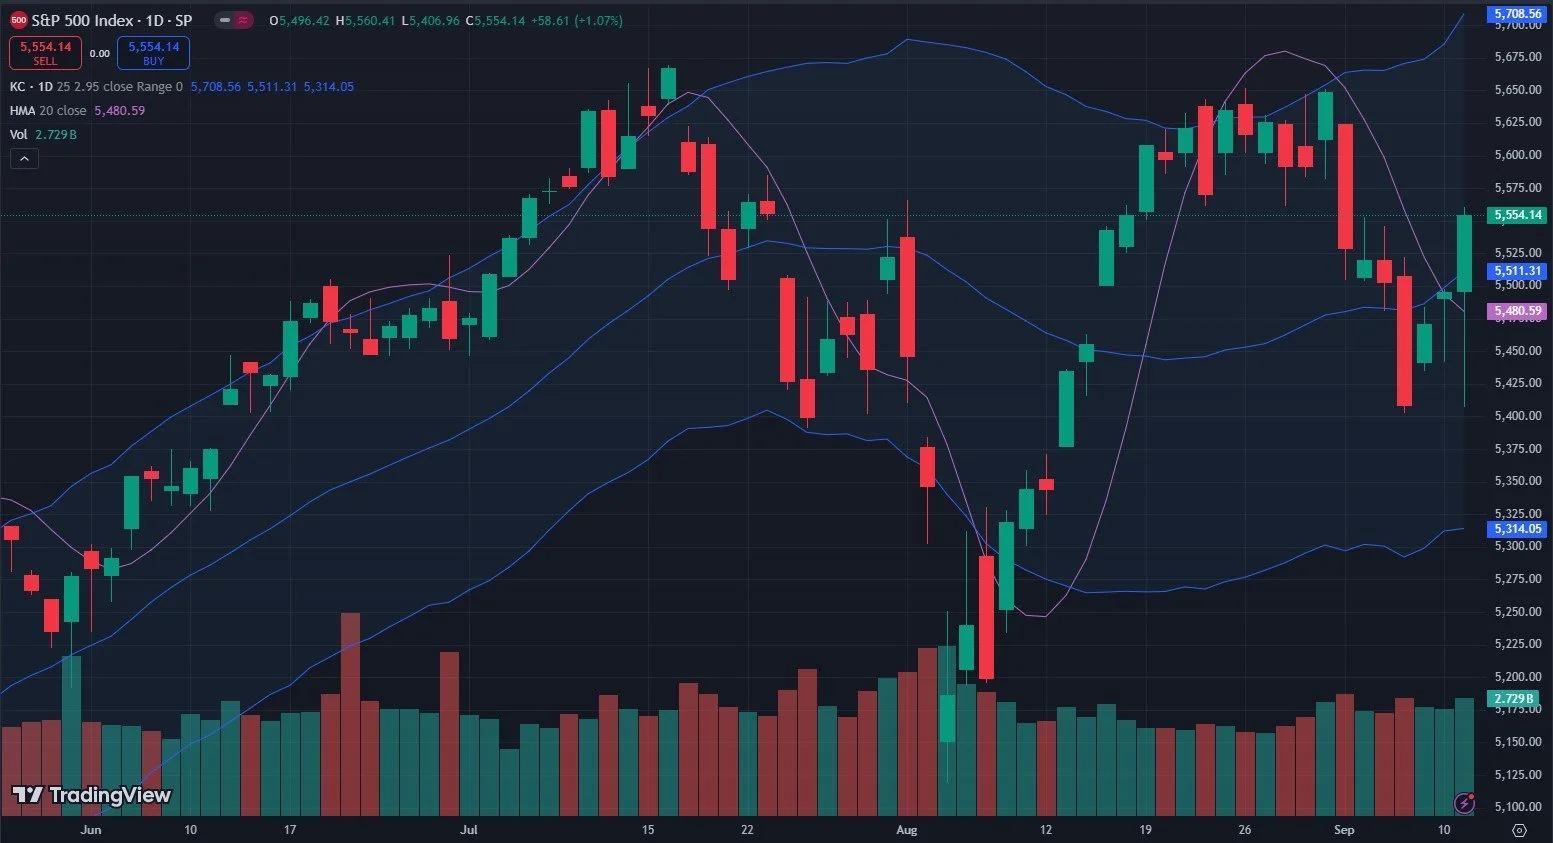
SPX had a more dramatic and potentially trap worthy move today, appearing as if it were diving toward the 5300 zone before reversing sharply, overtaking the Hull Moving Average and the middle Keltner channel to close at 5554. Note the higher low relative to 3 days ago as well.
GEX is positive again for SPX, and the chart looks bullish.
SPX Chart: TradingView.com
Looking at a traditional chart, SPX appears to show the sky as the limit for this rally, even the Keltners not showing resistance until 5700+. Not so fast, we have GEX to the rescue, giving us levels otherwise not obvious on your normal chart. Here we see 5555 (right above our close today) as the beginning of a Dealer Cluster zone where selling might occur. Interesting.
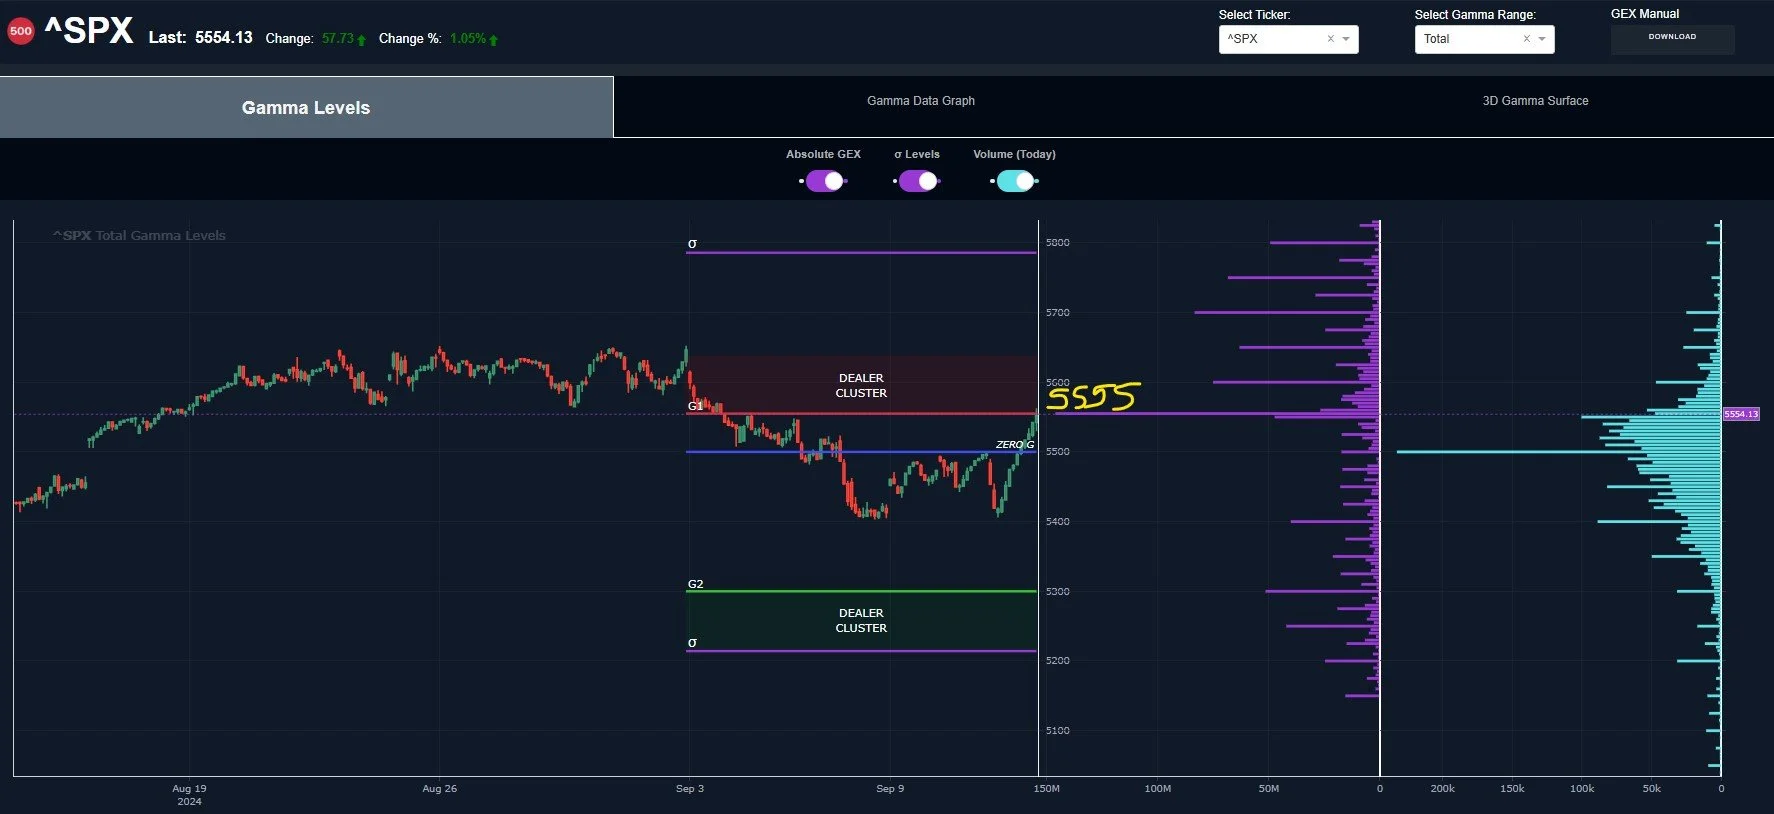
SPX GEX levels: www.geeksoffinance.com
Lastly, before tying the grand conspiracy together, let’s look at IWM, the small caps. IWM looks like it has the most potential for upside if we zoom out, yet its action has been weaker than the others. Today’s move didn’t quite even make it to the Hull, leaving question as to whether we are heading for 201 or 212 instead.

IWM Chart: TradingView.com
Once again, GEX helps us to tilt our odds in our favor regarding where we’re headed with IWM. We entered a Dealer Cluster zone that may mark a short-term top, and interestingly, the 195 strike saw very heaving volume today.

IWM GEX Levels: www.geeksoffinance.com
IWM GEX remains deeply negative and has not dramatically increased over the last 3 days, especially when compared to SPX.
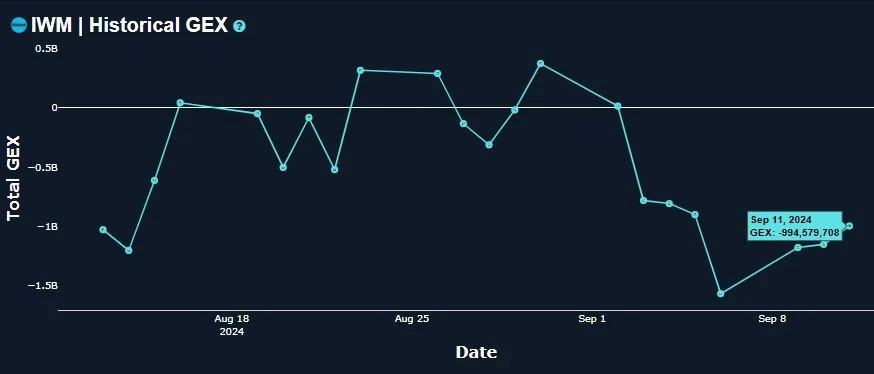
IWM historical GEX: www.geeksoffinance.com
Alright Charlie, Tie It All Together For Us!
All we have are theories this far in advance, but we can conclude that A) GEX has moved more positively across the board today while prices breached or reached key resistance areas, and B) the VIX has dropped a lot over the last week, and VIX expiration positioning as of now points to possibly an even lower VIX by Wednesday.
What happens next? It’s still a guessing game, but I would not be surprised if the VIX is somewhere between 16-17 Wednesday to deliver pain to those 16 puts as well as the 17+ calls, yet we are also quite overbought on smaller timeframes after today’s move. I’d personally like to see the momentum continue a bit further for the market, allowing IWM to contend with its resistance around 212, and we’ll see where SPX and QQQ as well as DIA are at that point. Let’s see if we can get a pullback between tomorrow and Monday, then a rally into Wednesday before looking at what the GEX picture tells us going forward.
join us in our free Discord channel (or become a paying subscriber for a lot more) And we will share some real-time updates on how we see GEX shifting in the 0 DTE markets. Hopefully you’ll join us!
If you’re interested in learning more about our strategy approach, we address all of these topics in our Geek University course which is included in all memberships.
If you’re interested in accessing our tools and analytics, be sure to check out our website!
Thanks for being part of our community and know that we invite your feedback!
We have a variety of educational videos on YouTube as well!
The information provided by Geeks of Finance LLC is for educational purposes only and is not intended to be, nor should be construed as, an offer, recommendation or solicitation to buy or sell any security or instrument or to participate in any transaction or activity. Please view our Investment Adviser Disclaimer and Risk Disclosure.